
Why Accurate Cytokine Profiling Matters in Translational Research
In the era of systems immunology and biomarker-driven discovery, cytokines are more than signaling molecules—they are navigators of immune landscapes. Their concentrations and temporal dynamics often serve as proxies for cellular activation, inflammation, and signaling crosstalk. Yet, many published studies struggle with reproducibility or low statistical power because the underlying cytokine measurements are noisy or inconsistent.
Consider this: you may detect a 2-fold increase in IL-6 in one experiment, but in a replicate run, that result vanishes. Such inconsistency can derail biomarker validation, cohort stratification, or mechanistic inference. High-¬quality cytokine data must meet three pillars: sensitivity, specificity, and reproducibility across biological and technical replicates.
As multiplex immunoassays have proliferated, two platforms stand out in translational research settings: Olink's proximity extension assay (PEA) and Luminex's bead-based multiplex system. Each has its inherent strengths and limitations in cross-reactivity, signal interference, throughput, and data handling. Selecting the right platform is not trivial—it shapes downstream statistical power, biological interpretation, and ultimately, the success of your biomarker pipeline.
In this article, we perform a side-by-side technical comparison: Olink vs Luminex, focusing on accuracy, reproducibility, and practical workflow considerations for immunology groups and biomarker teams. We will walk you through:
- The fundamental detection principles of each platform
- Their limits of sensitivity and how they perform on low-abundance cytokines
- Reproducibility metrics, cross-reactivity risks, and interference sources
- Workflow and automation tradeoffs relevant to large studies
- A real-world cytokine panel comparison to illustrate performance in practice
By the end, you'll gain a grounded, research-practical view on which platform better suits your assay design, sample constraints, and data quality expectations.
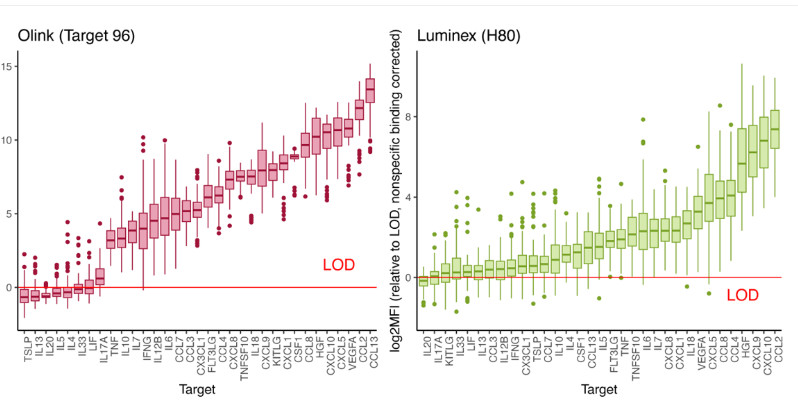 Figure 1: Detectability across platforms. Measured values relative to limit of detection (LOD) for 33 common targets assessed in 78 COVID-19 serum samples from 23 patients and 8 healthy control serum samples. Targets are sorted from left to right based on the median
Technology Overview: PEA vs Bead-Based Multiplex Immunoassay
To compare Olink vs Luminex meaningfully, we must first understand how each technology works—its core chemistry, signal generation, and multiplexing framework.
Olink Panel — Dual Recognition + DNA Barcoding
How it works (stepwise):
Dual antibody binding
- Two distinct monoclonal antibodies, each conjugated to a unique oligonucleotide tag, bind to different epitopes on the same target protein in solution.
- This design ensures that a signal is only generated when both antibodies simultaneously bind the correct analyte, improving specificity.
Oligonucleotide proximity and hybridization
- The paired oligo sequences are designed to partially complement each other. When brought into proximity, they hybridize.
- A DNA polymerase extends one strand, converting the hybrid into a full double-stranded DNA "barcode" unique to that antibody pair (hence unique to that protein).
Amplification and readout
- The DNA barcode is then amplified (by qPCR or NGS) to yield a quantitative readout proportional to the protein concentration.
- In Olink's systems, different panels use qPCR (e.g., Olink Target) or NGS (e.g., Olink Explore) depending on multiplex depth.
Key advantages inherent to PEA architecture:
High specificity via dual recognition
Because two independent antibodies must bind the same target for the signal to form, non-specific binding by a single antibody rarely triggers a false signal.
Scalable multiplexing without performance loss
Each antibody pair is tied to a unique oligonucleotide barcode. Even in high-plex panels (hundreds to thousands of proteins), cross-reactivity is minimised because non-matching oligos cannot hybridize to form amplifiable products.
Low sample volume requirement
Many Olink assays require only microliter-scale inputs (e.g., 1–6 µL) while delivering high sensitivity.
Internal controls and normalization pipelines
Olink includes built-in controls and normalization steps to correct technical variation across samples and plates — improving data comparability.
Luminex Bead-Based Multiplex Immunoassays — Spectrally Encoded Beads + Sandwich Assay
How it works (stepwise):
Bead coding and antibody coupling
- Each bead population (microsphere) is internally dyed with a unique ratio of two fluorescent dyes (e.g., red and infrared). These dye ratios define "bead regions," each corresponding to one analyte.
- A capture antibody specific to that analyte is conjugated to beads of that region.
Antigen capture and sandwich formation
- Beads are incubated with sample containing antigens. The analytes bind to the capture antibodies on beads.
- After washing, a biotinylated detection antibody is added, binding a second epitope on the analyte.
- Streptavidin-phycoerythrin (PE) is then added to bind to biotin, yielding a fluorescent signal proportional to amount of bound antigen.
Readout via flow-based multiplex reader
- A Luminex instrument (e.g., 100/200, Magpix) analyzes each bead: one laser identifies the bead region (i.e., which analyte), while another laser quantifies PE intensity to infer antigen amount.
- Multiple beads per region are measured to average out bead-to-bead variation.
Strengths and inherent limitations:
High flexibility and customizability
Users can tailor bead panels, select analyte subsets, and combine different bead types.
Established technology with broad adoption
Luminex has widespread use in immunology research; many validated kits and reagents exist.
Bead crowding, steric hindrance, and cross-reactivity risk
In highly multiplexed panels, antibodies may compete, steric interference may occur, and non-specific binding or cross-reactivity can confound signals.
Larger sample volume or dilution may sometimes be required
To maintain dynamic range and prevent bead saturation, samples may need dilution in some settings.
Comparison Table (PEA vs Bead-Based Multiplex)
| Feature | Olink PEA | Luminex Bead-Based |
| Recognition mechanism | Dual-antibody + DNA barcoding | Single capture + detection antibody sandwich |
| Signal transduction | DNA barcode → PCR / NGS | Fluorescence (PE) on beads |
| Multiplexing scale | Hundreds to thousands (e.g. 96, 384, 3072 panels) | Up to ~100 analytes in many commercial kits |
| Sample volume | Very low (1-6 µL typical) | Moderate (often 25–50 µL or more) |
| Specificity in multiplex | High (minimal cross-hybridization via unique DNA barcodes) | Moderate (cross-reactivity and matrix interference possible) |
| Automation friendliness | Amenable to semi/fully automated workflows | Flexible, but more manual handling and calibration steps |
| Normalization & QC | Built-in controls, internal standards, normalization pipelines | Often requires external controls or manual normalization |
Notes / considerations:
In highly multiplexed immunoassays, cross-reactivity is a critical technical risk. Olink's dual-recognition plus DNA barcoding design helps suppress false positives by ensuring only correct antibody pairs yield signal, while bead assays must contend with potential antibody–antigen crosstalk.
The choice of readout (qPCR vs NGS) in PEA panels allows flexibility: moderate-plex panels often use qPCR (faster, lower cost), whereas discovery-scale panels use NGS to expand multiplex depth.
While Luminex is more mature and customizable, users must carefully optimize panel design to avoid bead interference, ensure non-overlapping fluorescence spectra, and maintain dynamic range across analytes.
Sensitivity and Dynamic Range: Detecting Low-Abundance Cytokines
When comparing Olink vs Luminex, one of the most critical considerations is their ability to reliably detect and quantify low-abundance cytokines across broad concentration spans. In practice, sensitivity and dynamic range directly influence how many samples yield usable data and how well differential expression can be resolved.
Olink's Sensitivity and Dynamic Range
Olink's Target 48 Cytokine panels report limits of detection (LOD), lower limits of quantification (LLOQ), and upper limits of quantification (ULOQ) for each analyte. For example, the IL-6 assay in the Target 48 panel has an LOD of ~0.030 pg/mL and LLOQ of ~0.060 pg/mL, with a quantifiable range up to ~3,906 pg/mL (about 4.8 logs) (Olink datasheet)
The panel is designed to detect cytokines in as little as 1 µL of sample, which is especially valuable when sample volume is limited (e.g., precious clinical or small-animal samples).
In comparative studies, Olink held strong performance in the magnitude of dynamic range and sensitivity versus bead-based platforms. In the Olink white paper comparing Olink Target 48 with Luminex and MSD, Olink showed favorable linearity, dilution behavior, and overlap in sensitivity for many analytes, particularly in multiplex format.
A qualification study of a 48-plex cytokine panel used in pediatric and rare disease sample sets confirmed the assay retained precision and accuracy even at low-concentration ranges with minimal sample input (1 µL) .
Takeaway (Olink): It supports femtogram-to–low picogram sensitivity in well-optimized assays, coupled with ~4-5 log dynamic ranges in many cytokine assays. Because each analyte is barcoded and amplified, minor signals are amplified while preserving linearity over several logs.
Luminex's Sensitivity and Dynamic Range
Many commercial Luminex multiplex kits—e.g., Thermo Fisher's ProcartaPlex panels—report sensitivities in the low picogram per milliliter range (for many cytokines). The dynamic range usually spans ~3 to 5 logs, depending on the kit and analyte.
The newer Luminex INTELLIFLEX instrument (with "High Sensitivity mode" and extended calibration curves) has demonstrated improved sensitivity and lower LLOQ for many biomarkers. In some analytes, extending the standard curve and using the high sensitivity mode offered ~8.4-fold reduction in LLOQ and ~57% better detectability of previously undetectable samples.
That said, in certain published studies with non-human primate (NHP) serum/plasma, multiplexed Luminex assays struggled to quantify key cytokines below 100–300 pg/mL, implying that lower-abundance analytes may lie below quantifiable thresholds in that matrix (especially for inflammatory cytokines) .
In head-to-head validation studies, Luminex has shown solid performance for cytokines present in mid-to-high pg/mL ranges, but sensitivity limitations and cross-analyte competition can cause failed quantification at the lower end compared with single-plex ELISAs or ultrasensitive platforms (e.g. in Quantitative Validation and Comparison of Multiplex Cytokine Kits).
Takeaway (Luminex): It generally performs robustly for mid- to high-pg/mL cytokines, with dynamic ranges that can accommodate biological variation. However, its lower limit of quantification may hinder detection of extremely low-abundance analytes in complex matrices.
Practical Implications for Detectability and Data Yield
Sample dropout risk: If a cytokine lies below LLOQ in many samples, those data points may be censored or dropped, reducing statistical power. Olink's lower quantification limits often reduce dropout.
Dilution strategies: With high-concentration analytes, both platforms may require dilution to avoid saturation. Olink's broader dynamic range helps reduce the number of dilutions.
Panel overlap and missing data: In comparative analyses (Olink vs Luminex) of overlapping analytes, differences in sensitivity may lead to non-detects in Luminex that are quantifiable in Olink, skewing correlation metrics.
Linearity and dilution QC: Both platforms require validation of dilution linearity, parallelism, and matrix effects. Olink's dual-recognition design helps preserve linearity under multiplexing stress.
Matrix interference / background noise: Complex biological matrices (plasma, serum) introduce background binding or interference, impacting effective sensitivity. A well-normalized background in Olink or thoughtful bead blocking in Luminex are essential.
Reproducibility and Cross-Reactivity: Consistency Across Samples
In biomarker discovery or mechanistic immunology studies, reproducibility is non-negotiable. Differences in assay signal stability, cross-assay interference, or lot variation can erode confidence in data and thwart downstream modeling. In this section, we examine how Olink vs Luminex perform on reproducibility, cross-reactivity, and interference risk.
Olink: Precision, Inter-site Consistency, and Low Cross-Reacticity
Precision metrics in Olink Target 48
In a beta-site validation of the Olink Target 48 Cytokine panel, 15 samples were distributed to two labs using two reagent lots. The mean intra-assay CVs were ~7%, while inter-assay CVs were ~8–10% (depending on lab/operator) (Austrian Institute of Technology validation).
For the 45 analytes in that panel, mean intra-assay CV was ~4% and inter-assay CV ~6% in controlled runs.
In the qualification study for rare disease pediatric samples, the Olink 48-plex panel exhibited inter-operator, inter-day, and inter-run precision across 2 operators over 2 days, with typical CVs in the range 2–29% across analytes (lower end for abundant ones) (BioAgilytix poster).
Inter-site reproducibility
Olink reports that, with proper operator training and controlled protocols, inter-site reproducibility is "very good" among certified core labs globally.
Cross-reactivity and specificity
During validation, each assay (antibody–oligonucleotide pair) was challenged against all other recombinant proteins in the panel. Generally, only the intended target triggered a reporter signal; off-target proteins yielded negligible cross-signal.
One known exception: the CCL3 assay showed a small cross-recognition (~1.5%) of CCL4 at endogenous concentrations due to ~58% amino acid identity. Yet, this cross-contribution is low and typically within acceptable limits.
Olink's dual-antibody + DNA barcode scheme inherently minimizes cross-binding artifacts because only exactly matching oligo pairs will hybridize and extend.
Interference and matrix effects
Because of the requirement for dual binding plus DNA extension, many non-specific interactions or heterophilic antibody interference (e.g. human anti-animal antibodies) have less chance to yield false signal.
However, as with any immunoassay, matrix effects (sample-specific binding blockers, endogenous inhibitors) must be assessed. In validation, Olink ensures dilution linearity and spike recovery checks to detect such interference.
Summary for Olink
- High precision both within and across runs
- Strong inter-site reproducibility when protocols are followed
- Minimal cross-reactivity, with exceptional outliers noted and quantified
- Robust to many interference sources, but users should always validate for their matrix
Luminex: Variability and Cross-Interference Risks in Bead Multiplexing
Sources of variability
A recent study, "Sources of variability in Luminex bead-based cytokine assays" , identified multiple contributors to assay inconsistency: bead lot variation, operator technique, analyte identity/concentration, kit vendor, instrument drift, and bead coupling quality.
Lot-to-lot and between-run variability are common concerns in commercial multiplex kits, as reagent lots may differ in antibody coupling efficiency or bead stability.
In multi-lab comparisons of multiplex kits, differences in measured cytokine levels between labs and between reagent lots were highly significant (p < 0.001) for cytokines such as IL-6, IL-8, IL-10, TNF (MACS/WIHS study).
In commercial animal Luminex assays, matrix effects and prozone effects severely affected quantitation. In one rat Milliplex panel, a prozone (hook) effect in IP-10 was prominently observed, and recombinant vs endogenous protein behavior diverged.
 Figure 2: Effect of assay kit manufacturer on the precision and accuracy of Luminex bead assays.
Cross-reactivity, interference, and bead crowding
In high-plex bead panels, antibodies can interfere with each other. Proximity of beads, steric hindrance, and competition for detection antibodies can cause signal suppression or enhancement.
Cross-binding (one detection antibody binding off-target capture) is a risk in multiplexed designs if antibody specificity is not well characterized or if antibodies share epitopes.
In published Luminex kits (e.g. Thermo Fisher ProcartaPlex), the manufacturer states that each multiplex assay is individually tested for combinability, interference, and cross-reactivity (i.e., ensuring that adding analytes doesn't distort the standard curve).
Bead carryover from prior wells or residual binding on instrument surfaces may also introduce cross-sample contamination in high-throughput runs.
Reproducibility in practice
In a validation for NHP serum/plasma, a Luminex assay for 15 cytokines showed precision and accuracy within regulated criteria, but many analytes were near the lower detection limit (100–300 pg/mL) in normal samples, limiting quantitative reliability.
In a miniaturized 384-well Luminex format designed for lead optimization, assay performance (CVs, dynamic range) was constrained by reagent limitations and multiplex interactions.
Summary for Luminex
- Variability is driven by reagent lots, operator technique, and sample matrix
- Cross-reactivity and bead interference are non-negligible risks, especially in dense multiplex panels
- Reproducibility across labs or reagent lots can show significant divergence
- Careful panel design, QC controls, and validation (e.g. spike recovery, parallelism) are essential
Comparative Summary & Recommendations
| Metric | Olink (PEA) | Luminex (Bead-based) |
| Intra-assay CV | ~4–7% typical | Varies; 10–20% not uncommon in multiplex kits |
| Inter-assay / inter-lab CV | ~6–10% in validation studies | Often higher; lab-to-lab differences detectable |
| Cross-reactivity risk | Very low (dual recognition + barcode screening) | Moderate, especially in high-plex panels |
| Interference handling | Better built-in suppression of nonspecific binding | More vulnerable to matrix effects, steric hindrance |
| Multiplex stability | Maintains performance at higher plex | Risk of interference increases with plex size |
Best practices to maximize reproducibility
- Run technical replicates and include internal reference/control samples
- Use blocking reagents and matched dilution buffers to suppress nonspecific binding
- Perform spike recovery, dilution linearity, and parallelism tests for your specific matrix
- Monitor lot-to-lot consistency by analyzing a standardized QC sample across batches
- In bead assays, avoid extremely high plex density unless thoroughly validated
Automation, Throughput, and Workflow Efficiency
When choosing a multiplex cytokine platform for large studies or service labs, the hands-on time, scalability, and automation compatibility often matter more than absolute sensitivity. Below we compare Olink vs Luminex in those practical dimensions.
Olink: Semi-Automated and Scalable Proteomics Workflow
Olink Explore HT and automation readiness
The Olink Explore HT platform is explicitly designed for high-throughput proteomic projects. It supports automated and semi-automated workflows to reduce human error and handling time.
Olink and SPT Labtech have partnered to integrate Olink Explore with the firefly liquid handling system, enabling more streamlined automation (pipetting, non-contact dispensing, incubation) for proteomics workflows.
This automation allows miniaturized reactions (low dead volumes) and sample consumption as low as 2 µL in some workflows — helpful in sample-limited studies.
While Olink Target (lower-plex panels) generally use more manual pipetting steps (qPCR setup, dilution, plate management), labs with automation infrastructure (liquid handlers, robotic plate handlers) can integrate Olink protocols into automated pipelines.
Throughput and scaling claims
According to Olink, a single instrument line of Olink Explore HT can generate ~11 million data points per week.
In comparative performance documents, multiplex workflows including immuno-reaction, library prep, sequencing, and data processing are architected for parallel sample pooling and scalable sample numbers.
The automation path mitigates the "bottleneck" effect of manual pipetting when scaling to large cohorts.
Strengths & challenges
| Strengths | Considerations / Challenges |
| Reduced manual handling lowers operator error | Automation capital cost and programming overhead |
| Miniaturization and low-volume reaction compatibility | Some steps (e.g. qPCR setup, library prep) still require fidelity |
| Scalable data throughput suitable for proteome-scale projects | Labs must invest in validated automation platforms |
| Integrated QC and normalization pipelines further reduce manual QC burden | Protocol adaptation and validation required when scaling |
In large-scale biomarker programs or proteomics service facilities, Olink's automation compatibility can significantly reduce time per sample and improve reproducibility across plates and operators.
Luminex: High-Throughput Multiplexing with Automation Options
Automation support for Luminex workflows
Thermo Fisher markets automation solutions for Luminex (ProcartaPlex) assays, allowing partial or full automation of sample prep, reagent dispensing, and plate handling. They claim up to ~80% reduction in bench time by integrating upstream steps (e.g. pipetting) with robotic systems.
Users can adopt 96- and 384-well plate formats for Luminex multiplexing, which dovetail with automated liquid handling systems in high-throughput labs.
In published work, a 384-well Luminex format for cytokine assays has been validated, consuming <25% of reagents compared to 96-well formats, enabling higher sample throughput per run.
Throughput and constraints
Luminex reading is relatively fast. Typical read times are ~45 minutes per 96-well plate; for dense multiplex panels, flow cytometric detection ensures per-well multiplexed readout rather than serial analyte measurement.
Because each bead well contains multiple bead populations, throughput is limited by sample incubation and wash times more than read time.
In high-plex or heavily multiplexed panels, reagent and assay optimization become more complex, potentially slowing down throughput scaling.
Strengths & challenges
| Strengths | Considerations / Challenges |
| Well-established automation options integrate with common lab robotics | Some steps (e.g. wash, incubation, bead mixing) remain prone to handling variation |
| Compatible with 384-well formats enabling large sample throughput | Increasing multiplex density or number of beads may reduce per-analyte robustness |
| Faster read time per plate given multiplexed detection | Cross-talk, bead crowding, and coupling variability may impose extra QC burdens |
| Lower barrier to entry for labs already using liquid handlers | Greater hands-on verification may be needed for complex panels or new analytes |
In essence, Luminex offers robust multiplex throughput, and its automation support is mature. However, scaling and maintaining consistency across complex panels or ultra-high throughput screens demands rigorous QC, validation, and optimized automation design.
Practical Considerations for Platform Selection in Service Labs
Throughput vs. per-sample cost tradeoff: For very large sample sets, Olink's scalable automation may reduce marginal labor cost and error risk; Luminex's more modular automation may suffice for mid-sized projects.
Automation infrastructure investment: If your facility already has liquid handling robots, plate handlers, or pipetting stations, both platforms can integrate. But Olink's newer automation integrations (e.g. SPT firefly) are optimized for proteomics scale.
Sample batching and throughput planning: Use batching (e.g. pooling libraries or multiple plates per run) to maximize instrument utilization. Olink pooling of libraries before sequencing is one strategy.
QC and calibration time: Automated systems reduce manual error, but scheduled calibration, validation, and maintenance protocols must be integrated.
Downtime and flexibility: Luminex may allow more flexible assay design changes or smaller batch runs; Olink automation is powerful when run volumes justify it.
Data Quality and Biological Interpretability
Accurate measurement is only one half of the equation—translating multiplex cytokine data into biologically meaningful insight demands robust normalization, QC, consistency across batches, and thoughtful statistical interpretation. In this section, we compare how Olink vs Luminex handle these challenges and what users must consider in practice.
Olink: NPX, Normalization, and Bridging Across Batches
NPX: Relative Quantification in Log2-space
Olink reports protein levels in NPX (Normalized Protein eXpression) units, which are arbitrary log2-based values derived from Ct differences and normalization controls (Extension, Detection, Inter-plate) injected into every sample (e.g. immuno/incubation, extension, detection controls) .
Because NPX is relative, it is not an absolute concentration and direct comparisons of NPX across plates or projects require normalization.
A difference of 1 NPX unit corresponds approximately to a doubling of relative protein abundance.
Normalization and QC pipelines
Before output, Olink applies built-in QC steps using the internal controls (incubation, extension, detection) to flag failed samples or assays.
Plate control normalization or intensity normalization is applied within a project to correct for intra-plate variation and systematic shifts.
When combining multiple Olink datasets (e.g. several plates, batches, or projects), bridging normalization is used: shared (overlapping) samples are used as "bridge samples" to align NPX distributions across datasets.
The R package OlinkAnalyze implements functions such as olink_normalization_bridge, olink_normalization_subset, and olink_normalization_n to harmonize NPX data across batches (e.g. via median adjustment or quantile smoothing).
Advantages for interpretability
- Because every analyte is internally controlled, systematic drift and technical noise are better accounted for, improving confidence in relative comparisons.
- Bridging allows multi-plate studies to be merged robustly, preserving biological signal across large cohorts.
- The NPX framework encourages downstream analyses (e.g. differential expression, clustering) using normalized, QC-flagged values.
Caveats and user best practices
- NPX is not an absolute concentration—users should avoid interpreting NPX differences across analytes without calibration or standard curves.
- The success of bridging depends on the quality and number of overlapping samples per batch; insufficient overlap can degrade normalization accuracy.
- Outlier plates or samples failing QC must be excluded or re-run before bridging.
- Users should verify dilution linearity, parallelism, and spike recovery in their specific matrix (plasma, serum, CSF) to confirm interpretability.
Luminex: Raw Fluorescence, Curve Fitting, and Normalization Challenges
From fluorescence to concentration
Luminex produces raw fluorescence intensity (e.g. median fluorescence intensity, MFI) per bead region. This MFI is translated into concentration via a standard curve (often 5- or 7-point curves, logistic or 4/5-parameter nonlinear regression.
Some platforms or software may apply background subtraction, blank correction, or smoothing to reduce noise.
Normalization, correction, and drift control
Luminex users often include internal controls, replicate beads, or reference samples per plate to monitor drift or batch effects.
Advanced normalization methods (e.g. correcting for background fluorescence, instrument drift, or bimodal data) are emerging to improve specificity and reproducibility in multiplex data (e.g. "Comprehensive normalization and binary classification methods…").
However, because many kits or labs treat assays as standalone, full cross-plate normalization protocols are less standardized across vendors.
Interpretability constraints
Absolute concentrations rely heavily on the standard curve quality, curve-fitting model selection, and sample behavior relative to calibrators (matrix matching, parallelism).
At high multiplex levels, standard curves sometimes suffer distortion due to interference or bead interactions, especially at extremes.
Nonlinearities or matrix effects may lead to inaccuracies in low- or high-end concentration ranges.
User practices to safeguard interpretability
- Run standard curves on every plate, and confirm that sample MFI values fall within the curve's quantifiable range.
- Use replicate wells and bead replicates to smooth bead-to-bead variability.
- Monitor inter-plate consistency using reference samples or controls.
- Examine residuals, curve fit diagnostics, and flag samples near the curve boundaries.
- Where possible, adopt statistical correction models or normalization algorithms from the literature to mitigate drift or batch bias.
Comparative Summary & Recommendations for Biomarker Contexts
| Aspect | Olink (PEA) | Luminex (Bead-Based) |
| Output unit | NPX (log2 relative expression) | Concentration derived from MFI and standard curve |
| Intra-project normalization | Built-in QC, plate/instrument normalization | Internal controls, blank subtraction |
| Cross-plate normalization | Bridging (shared samples, median adjustment) | Less formalized; user must plan reference runs |
| Data comparability | Better-supported across batches | More subject to variation from curve and drift |
| Between-analyte comparison | No direct absolute conversion without calibration | Possible if calibrators used, but additional caveats |
| Best use scenario | Large-cohort, multi-plate biomarker profiling | Medium-scale panels, well-validated kits, standardization per run |
Key tips for ensuring biological interpretability:
- Design bridging samples early: Always include replicate or overlapping samples across plates/projects to enable normalization.
- Validate matrix behavior: Test dilution linearity, spike recovery, and parallelism in your specific sample matrix.
- Filter low-quality data: Use QC flags, exclude outliers, and avoid overinterpreting values near detection limits or plate extremes.
- Be cautious with between-analyte comparisons: Unless calibrated, treat fold-changes or relative differences within analytes rather than absolute cross-protein comparisons.
- Document all normalization steps: Transparency in QC and normalization improves reproducibility and interpretability, and supports downstream publishing or regulatory scrutiny.
Case Study — Comparative Cytokine Profiling in Inflammatory Disease
To ground the technical comparisons in practice, we examine a published head-to-head comparison of Olink's Target 48 cytokine panel versus Luminex multiplex assays in samples from inflammatory disease patients and healthy controls. These real data illustrate how sensitivity, reproducibility, and detectability differences manifest in an immunologically complex cohort.
Study Design & Sample Cohort
In the white paper "Multiplex analysis of inflammatory proteins: A comparative study across multiple platforms", Olink compared its Target 48 panel against Bio-Rad/Luminex and Mesoscale Discovery (MSD) platforms using matched plasma samples (EDTA plasma) from 8 healthy donors and 24 individuals with inflammatory conditions (e.g. rheumatoid arthritis, systemic lupus erythematosus, Crohn's disease) .
- Key design points:Overlap set: They identified 20 overlapping cytokines measurable by both Olink and Luminex (e.g. IL-1β, IL-6, TNF-α, IL-8, MCP-1) .
- Sample volume: Olink used 1 µL per panel, while Luminex consumed ~12.5 µL per panel in this study.
- Replicate precision assessment: Four samples (1 healthy, 3 disease) were run in triplicate to estimate intra-assay %CV for each platform.
This design enables direct comparison of detectability, linearity, precision, and correlation in a disease-relevant matrix.
Key Findings: Detectability, Precision, and Linearity
Detectability
The study reported that across the 20 overlapping cytokines, Olink identified a higher proportion of quantifiable samples within the limits of quantification (LOQ) than Luminex (i.e. fewer non-detects).
Some Luminex measurements fell below LLOQ in disease or healthy samples, reducing the usable data set for downstream comparisons.
Precision (Intra-assay %CV)
- The mean intra-assay %CV across overlapping cytokines was ~10% for Olink versus ~13% for Luminex in their setup.
- Some analytes near the lower detection threshold had greater variability, especially in the Luminex data, as expected due to weaker signals.
Linearity / Parallelism / Dilution Behavior
- The authors performed serial dilutions (1:2 steps) for six samples across platforms. Olink displayed excellent linearity and parallelism, with dilution curves staying consistent among samples. In contrast, some Luminex curves diverged or reordered sample ranking, especially for low-abundance analytes.
- This behavior suggests that Luminex is more vulnerable to matrix effects or nonlinearity in high multiplex settings.
Correlation of Overlapping Analytes
- For analytes that were quantifiable in both platforms, correlation (e.g. Spearman) was moderate to strong for more abundant cytokines (e.g. IL-6), but weaker for low-level cytokines near detection limits.
- Because Luminex had more non-detects, correlation analyses were biased to those analytes with stronger signals.
Implications from the IMPACC / COVID-19 Cohort Study
A more recent comparative work employed Olink (92-plex inflammation panel) and Luminex (80-plex) to profile serum from COVID-19 patients. The study found:
- Detectability ranking: NULISAseq > Olink > Luminex (i.e. Luminex had the lowest proportion of values above LOD) (Abe et al., 2024).
- Correlation between Olink and Luminex was decent for abundant targets, but divergence rose for low-level ones.
- Differences in detectability influenced which cytokines emerged as differentially expressed over time in disease progression, showing the practical impact of detection sensitivity on biological conclusions.
Together, these studies highlight how platform sensitivity and assay robustness directly influence data completeness, precision, and biomarker discovery potential.
Interpretation & Lessons for Biomarker Studies
From this case study, several lessons emerge relevant to translational biomarker teams evaluating Olink vs Luminex for inflammatory disease applications:
Fewer non-detects when using more sensitive assay
Lower detection limits in Olink allowed more cytokine measurements to be in quantifiable range, reducing data imputation or sample dropout.
Improved linearity and parallelism give confidence in fold-change measurements
Consistency in dilution response helps ensure that observed differences reflect biology, not assay artifacts.
Precision gains are more meaningful at lower analyte levels
While both assays behaved comparably for abundant cytokines, abnormalities or dynamic shifts in low cytokines were better resolved by Olink.
Differential expression outcomes may diverge depending on platform
In the COVID-19 study, cytokines detectable only by Olink (or with better signal) showed differential trajectories not captured by Luminex, underlining how platform choice may bias findings. (Abe et al., 2024).
Bridge/normalize carefully for cross-platform comparisons
When combining or benchmarking datasets from different platforms, sample overlap and robust normalization are essential to reduce bias.
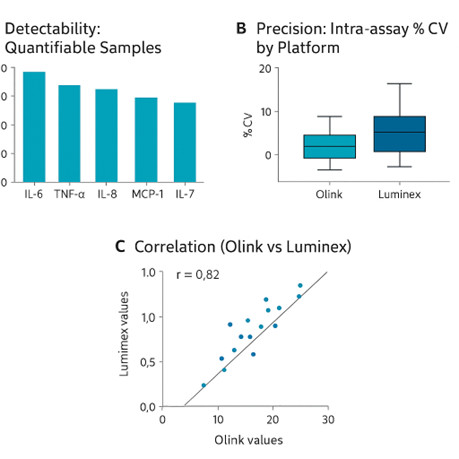 Figure 3: Comparison of Olink and Luminex performance across shared cytokines in an inflammatory disease cohort. (A) Proportion of samples with quantifiable signal above limits of quantification (LOQ) is higher for Olink. (B) Intra-assay %CVs show tighter precision for Olink (lower median and narrower spread). (C) Scatter plot of matched samples for overlapping cytokines yields moderate-to-strong correlation for high-level analytes, though values near detection limits deviate more markedly
Choosing the Right Platform for Your Study
Selecting between Olink and Luminex isn't just about technical specs — it depends on your study goals, sample constraints, throughput demands, and downstream analysis needs. Below, we outline decision axes and practical recommendations.
Decision Factors to Weigh
| Factor | Why It Matters | How Olink & Luminex Compare |
| Sensitivity needs / low-abundance cytokines | If many targets are near or below pg/mL, assay sensitivity dictates how much usable data you'll obtain | Olink generally offers lower detection limits and fewer non-detects; Luminex performs well for mid- to high-abundance analytes |
| Sample volume constraints | Precious or small-volume samples (e.g. pediatric, small animal) must be used efficiently | Olink often works with 1–6 µL inputs; Luminex usually requires larger volume (e.g. 10–50 µL) |
| Multiplex scale / panel size | The number of cytokines you wish to profile affects assay complexity and interference risk | Olink is optimized for high-plex panels with barcode-based dual recognition; Luminex flexibility is high, but multiplexing limits and interference must be managed carefully |
| Reproducibility and inter-lab consistency | Multi-site or longitudinal studies demand tight control over variability | Olink's normalization, bridge-sample workflows, and internal QC support better cross-plate consistency; Luminex needs rigorous user QC protocols |
| Throughput and automation | High-sample-count studies demand streamlined workflows and minimal manual intervention | Olink has strong automation support (e.g., Explore HT, integration with liquid handlers); Luminex is also automatable, but may require more calibration, washing, and manual steps |
| Data integration and normalization | Your ability to merge data across batches, timepoints, or platforms affects downstream analysis | Olink's bridging normalization suites provide built-in tools; Luminex demands more custom normalization efforts |
| Cost per sample / reagent budget | For many projects, cost efficiency is a critical constraint | Luminex reagent costs per analyte are often lower in lower-plex panels; Olink's high multiplex efficiency may improve cost-per-data-point for large panels |
| Panel customization flexibility | Some studies demand bespoke cytokine panels or combining with other analytes | Luminex allows extensive customization; Olink panels are preconfigured, though custom panels may be possible with service providers |
| Project risk tolerance | In early R&D, robustness may outweigh maximal sensitivity; in late-stage biomarker work, data consistency is critical | Evaluate whether missing values or variability risk is acceptable vs. the need for high resolution |
Recommended Use Cases
Here are scenario-based suggestions:
- Large-cohort biomarker discovery / population studies
Choose Olink, especially when you must profile dozens to hundreds of cytokines across hundreds of samples with minimal sample volume and need strong cross-batch normalization. - Mid-scale immunology or preclinical studies
Luminex may suffice when you profile 10–50 cytokines, samples are abundant, and budget constraints favor lower reagent cost per analyte. - Pilot / hypothesis screening studies
Luminex offers flexibility and lower setup cost, allowing you to screen candidate cytokines before scaling. - Longitudinal or multisite trials
The more you depend on consistency across time and location, the more valuable Olink's bridging workflows and QC mechanisms become. - Custom multiplex panels involving cytokines + other biomolecules
Luminex's flexibility to combine analytes can be advantageous in hybrid panels (e.g. cytokines + growth factors).
Practical Checklist Before Choosing
Run a pilot comparison
Test a subset of your samples on both platforms to gauge detectability, dynamic range, and CVs in your matrix.
Design bridging controls
If you will merge data (even within a single platform), always include shared QC/bridge samples across plates or runs.
Assess your matrix effects
Test spike recovery, dilution linearity, and parallelism in your actual matrix (serum, plasma, CSF) for the specific cytokines.
Plan for QC and longitudinal drift
Establish reference controls, calibrator samples, and monitoring of plate-to-plate variability.
Evaluate reagent and sample budgets
For large panels, cost per data point and sample consumption can tip the balance.
Ensure automation compatibility
Confirm that your lab's liquid handling, plate handling, and software pipelines can integrate with the platform's requirements.
Forecast missing-data risk and down-stream impact
If missing or censored cytokine values severely degrade your statistical power, favor the platform with higher sensitivity and fewer non-detects.
Conclusion
The comparison between Olink vs Luminex reveals a clear trade-off space—but for many translational immunology and biomarker programs, Olink's PEA-based platform offers decisive advantages in sensitivity, reproducibility, and data consistency. From fewer missing values to robust inter-plate normalization and automation compatibility, Olink supports more confident downstream biological inference and cohort-level discovery.
However, this is not to say that Luminex has no place. In contexts where sample volumes are generous, target panels are modest (e.g. < 30 cytokines), and budget constraints dominate, Luminex remains a flexible, proven technology. The optimal choice depends on your project scale, matrix complexity, and tolerance for missing or noisy data.
Key Takeaways
- Sensitivity & detectability — Olink often quantifies more low-abundance cytokines, reducing sample dropout
- Reproducibility & cross-reactivity — Dual-antibody + DNA barcoding in Olink helps suppress off-target signal; Luminex requires rigorous panel validation
- Throughput & automation — Olink's HT/Explore offerings integrate with liquid handling systems to scale reliably
- Data interpretation & normalization — Olink's NPX format and bridging workflows simplify merging multi-plate data
- Use-case alignment — Choose Luminex for cost-effective moderate panels; choose Olink for high-plex, low-volume, cross-study consistency
How to Move Forward: Your Next Steps
Run a small pilot test
Submit a subset of your samples (e.g. 10–20) to both platforms. Compare detectability, dynamic range, and CVs in your specific biological matrix.
Design bridging controls early
Allocate replicate or overlapping QC samples across plates or runs to enable normalization and error correction.
Validate your matrix behavior
Perform spike recovery, dilution linearity, and parallelism experiments in your sample matrix (plasma, serum, CSF, cell media).
Plan your workflow & automation
Evaluate your lab's liquid handling and plate handling capacity, and choose a platform you can scale with confidence.
Engage with experts early
Discuss your biomarker targets, cohort size, and desired outcomes with a proteomics service provider to optimize panel selection and workflow.
How We Can Help You
If you're evaluating cytokine multiplex assays or planning an Olink proteomics study, we'd be glad to support you at every step. At our CRO/proteomics lab, we offer:
- Consultation to tailor the right Olink panel or multiplex strategy
- Sample processing, assay execution, and QC-driven data delivery
- Bridging normalization and bioinformatics pipelines
- Cross-platform benchmarking (e.g. Olink vs Luminex)
- Project planning for scalability, reproducibility, and downstream interpretation
Let us help you design a biomarker workflow you can trust. Contact us today to discuss your project requirements or request a quote.
Related Reading: Explore More Olink Comparative Insights
To better understand how Olink performs against other proteomic platforms, we recommend exploring the following related guides:
Olink Cytokine Panel vs Other Detection Methods: Sensitivity, Specificity, and Throughput Compared — our hub article providing an overview of Olink's advantages over ELISA, Luminex, and aptamer-based assays.
Olink vs SomaScan: Sensitivity, Coverage, and Data Quality — a focused comparison of PEA and bead-based immunoassays used in translational cytokine research.
References
- Multiplex high-throughput proteomics with exceptional analytical specificity
- Rountree W, Lynch HE, Denny TN, Sempowski GD, Macintyre AN. Sources of variability in Luminex bead-based cytokine assays: Evidence from twelve years of multi-site proficiency testing. J Immunol Methods. 2024 Aug;531:113699. doi: 10.1016/j.jim.2024.113699. Epub 2024 May 31. PMID: 38823575; PMCID: PMC11246216.
- Elizabeth Breen, Sandra Reynolds, Christopher Cox, Lisa Jacobson, Larry Magpantay, Candice Mulder, Oliver Dibben, Joseph Margolick, Jay Bream, Elise Sambrano, Otoniel Martínez-Maza, Elizabeth Sinclair, Persephone Borrow, Alan Landay, Charles Rinaldo, Phillip Norris, Performance of Luminex and MSD high-sensitivity multiplex cytokine assays across multiple lots and laboratories (65.6), The Journal of Immunology, Volume 186, Issue 1_Supplement, April 2011, Page 65.6
- Tim Erkens, Nick Goeminne, Ann Kegels, Martine Byloos, Petra Vinken. Analytical performance of a commercial multiplex Luminex-based cytokine panel in the rat. Journal of Pharmacological and Toxicological Methods.2018
- Tang H, Panemangalore R, Yarde M, Zhang L, Cvijic ME. 384-Well Multiplexed Luminex Cytokine Assays for Lead Optimization. J Biomol Screen. 2016 Jul;21(6):548-55. doi: 10.1177/1087057116644164. Epub 2016 Apr 19. PMID: 27095819.
- Abe K, Beer JC, Nguyen T, Ariyapala IS, Holmes TH, Feng W, Zhang B, Kuo D, Luo Y, Ma XJ, Maecker HT. Cross-Platform Comparison of Highly Sensitive Immunoassays for Inflammatory Markers in a COVID-19 Cohort. J Immunol. 2024 Apr 1;212(7):1244-1253. doi: 10.4049/jimmunol.2300729. PMID: 38334457; PMCID: PMC10948291.