
- Overview
- Panels List
- Applications
- Workflow
- Why Creative Proteomics
- Demo
- Sample Requirements
- FAQ
- Sample Submission Pack
Why Integrate Olink Proteomics with Mass Spectrometry?
We provide the complete biomarker solution, not just isolated data points.
We provide the complete biomarker solution—from discovery to verification—bridging the critical gaps between Olink’s relative screening data and definitive, functional insight.
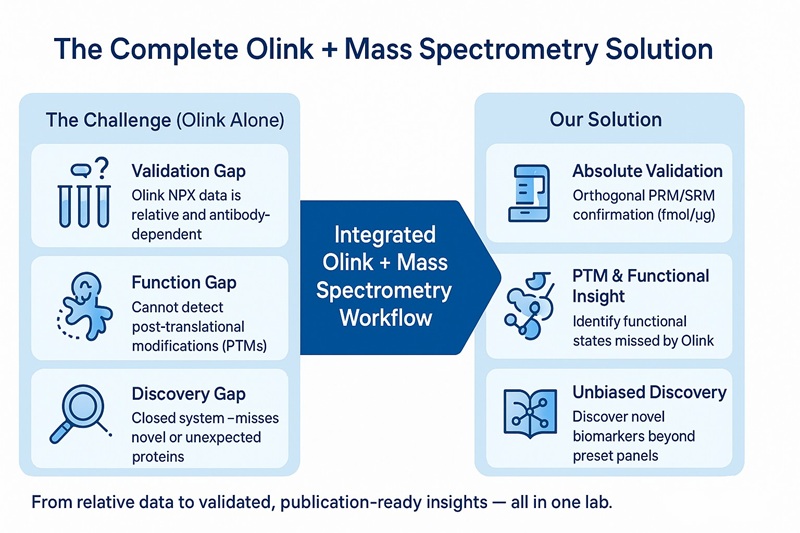
After the Olink Screen: The Three Gaps from “Candidate” to “Conclusion”
1. The Validation Gap:
Olink NPX data are relative and antibody-dependent. Leading journals and regulatory bodies often require orthogonal confirmation. Mass spectrometry provides absolute quantification (e.g., fmol/µg) independent of antibody reactivity, ensuring confidence in your biomarker hits.
2. The Function Gap:
Olink indicates protein abundance but not activity. Functional states such as phosphorylation or glycosylation determine biological relevance—information only LC-MS can reveal.
3. The Discovery Gap:
Olink panels are predefined. Novel proteins, isoforms, or unexpected PTMs remain invisible. Unbiased mass spectrometry expands discovery beyond any fixed panel.
Advantages
- Unparalleled Sensitivity: Olink detects fg/mL proteins inaccessible to mass spectrometry.
- Enhanced Proteome Depth: Olink can detect additional proteins low-abundance missed by MS.
- Optimized Sample and Cost Efficiency: Olink requires only 1 μL of plasma versus MS' s 5–240 μL.
- Bolstered Data Robustness: Olink' s low interplate CV and a broad dynamic range enable simultaneous quantification of high- and low-abundance proteins.
Olink & MS Platform: Selecting the Right Panel
Recommended Panels for Integrated Analysis
Olink Panels suitable for integration with MS primarily include high-density, broad-coverage Explore HT panels, specific Explore 384 panels under the Explore platform and Customized Olink Flex panels tailored to project needs. The Olink Explore platform, based on Proximity Extension Assay (PEA) technology, is designed for Discovery Science. It enables simultaneous detection of ~3,000 proteins (3072-plex), ~1,500 proteins (via 4× 384-plex panels), or ~400 proteins (single 384-plex panel). This high-throughput, broad coverage makes it ideal for the biomarker discovery phase. Integrating such large-scale proteomic data with MS-derived data through multi-omics integration analysis allows researchers to:
- Cross-validate key findings across platforms.
- Expand total protein coverage due to complementary protein detection between two technologies.
- Enhance robustness and reliability of biological conclusions via technical triangulation.
- Distinguish platform-specific signals or interference by comparing concordance/discordance.
Here is a list of recommended panels we offer:
Table. List of Olink Panels
Additional Options
In addition to the panels above, we also offer:
- Target 96 / Target 48
- Olink Target 96 Immune Response
- Olink Target 96 Inflammatory
- Olink Target 96 Cardiometabolic
- Olink Target 96 Metabolism
- Olink Target 96 Neuro Exploratory
- Olink Target 96 Neurology
- Olink Target 96 Immuno-Oncology
- Olink Target 96 Development Panel
- Olink Target 96 Organ Damage Panel
- Olink Target 96 Cell Regulation Panel
- Olink Target 96 Oncology II Panel
- Olink Target 96 Oncology III Panel
- Olink Target 96 Cardiovascular II Panel
- Olink Target 96 Cardiovascular III Panel
- Olink Target 96 Mouse Exploratory Panel
- Olink Target 48 Mouse Cytokine Panel
- Olink Target 48 Cytokine
Our team can assist in designing an integrated Olink–MS strategy tailored to your project goals.
Applications
This service excels in mechanistic disease research and therapeutic development:
Biomarker Discovery and Validation
- Cross-platform verification enhances the reliability of biomarker candidates.
- Advantage: Olink' s high sensitivity (fg/mL) captures low-abundance proteins, while MS provides broad coverage and post-translational modification (PTM) data.
Neurodegenerative Disease Studies
- Multi-omics integration: Olink + MS + genomics identified pQTLs (protein quantitative trait loci) linking genetic variants to protein dysregulation.
- Immune-endocrine crosstalk: Olink' s inflammation panels combined with MS-based exosome proteomics exposed endothelial dysfunction mechanisms.
Cancer Biology
- Tumor microenvironment: Integration of single-cell RNA-seq + Olink/MS profiled immune checkpoint proteins in melanoma, stratifying responders to immunotherapy.
- Therapeutic resistance: In bladder cancer, MS phosphoproteomics + Olink revealed RBPMS-mediated AP-1 activation as a driver of metastasis.
Target Identification
- Deconvolution of drug effects: Olink tracked dynamic changes in cytotoxic proteins in bladder cancer patients post-chemotherapy, predicting complete response.
- Mechanistic validation: MS confirmed Olink-identified targets via TCGA data integration, supporting its role as a minimally invasive diagnostic marker.
Patient Stratification Research
- Inflammatory bowel disease (IBD): Olink' s inflammation panels + MS metabolomics uncovered Th17 pathway dysregulation, guiding subtype-specific therapies.
- Obesity-linked inflammation: Olink/MS exposed TH17-skewed signatures in adipose tissue, informing targeted immunomodulatory trials.
Workflow of Olink & MS
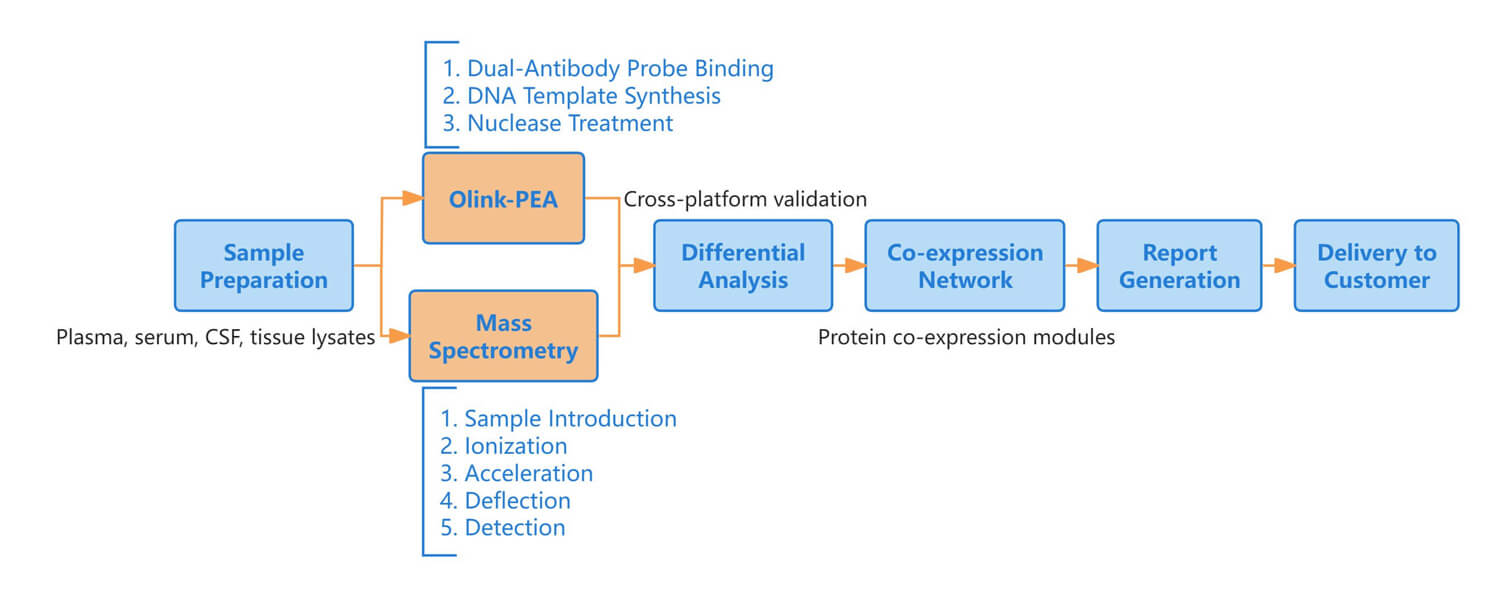 Figure 1: Workflow of integrated Olink proteomics and mass spectrometry.
Why Choose Creative Proteomics for Your Olink & Mass Spec Workflow?
You need more than Olink data—you need validated, interpretable results. Creative Proteomics is among the few CROs with integrated in-house expertise in both Olink and LC-MS technologies, transforming your screening hits into verified conclusions.
1. The Integrated Advantage — A Unified Workflow
We operate both platforms internally, eliminating the delays and inconsistencies that occur when samples move between different vendors. Our streamlined process ensures seamless transition from Olink screening to LC-MS validation.
2. Absolute Quantification — Solving the Validation Gap
Mass spectrometry remains the gold standard for protein quantification. Using targeted PRM/SRM methods, we deliver absolute values and orthogonal verification required for publication or regulatory submission.
3. Functional & PTM Analysis — Solving the Function Gap
Our advanced PTM profiling identifies phosphorylation, glycosylation, acetylation, and other key modifications—providing functional insight that Olink alone cannot achieve.
4. Unbiased Discovery — Solving the Discovery Gap
Our unbiased LC-MS workflows (shotgun proteomics, data-independent acquisition, etc.) detect novel proteins, isoforms, and even non-human peptides that extend far beyond panel limitations.
5. Platform-Agnostic Expertise — The Honest Approach
We specialize in multiple proteomic technologies, including Olink, TMT, PRM, and PTM analysis. This allows us to recommend the most suitable strategy for your project, not just the one we sell.
Demo Results
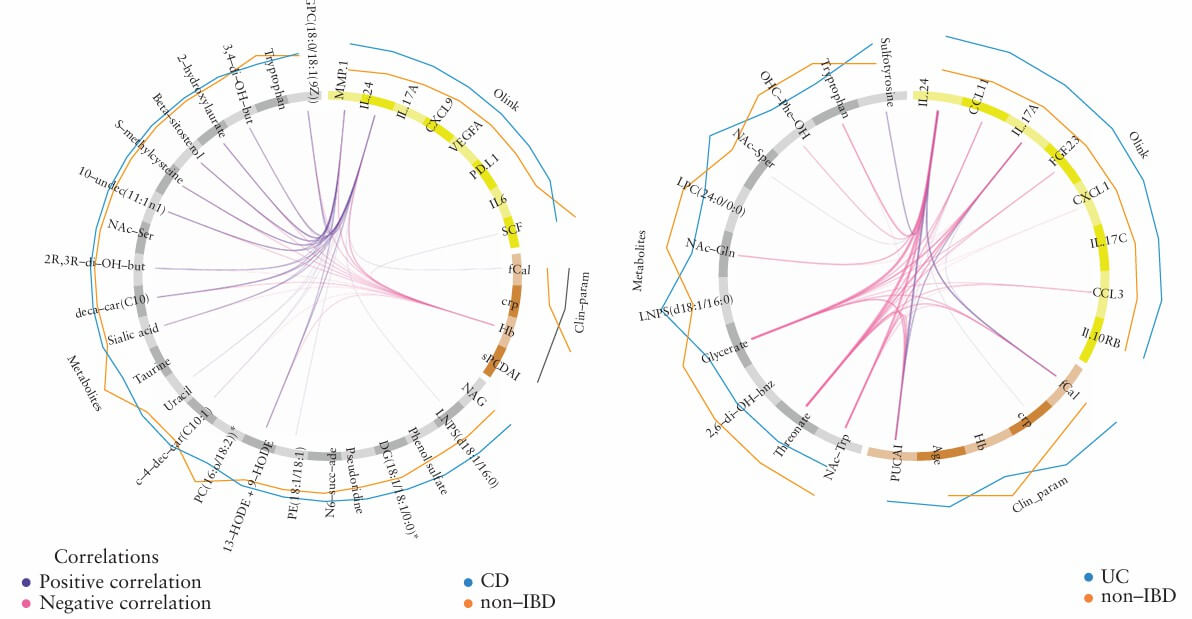 Figure 2: Only in UC was it significantly negatively correlated with PUCAI score, fecal calprotectin, and plasma glyceric acid/threonic acid, suggesting its potential as an activity marker for UC. (Nyström, N., et al. 2022)
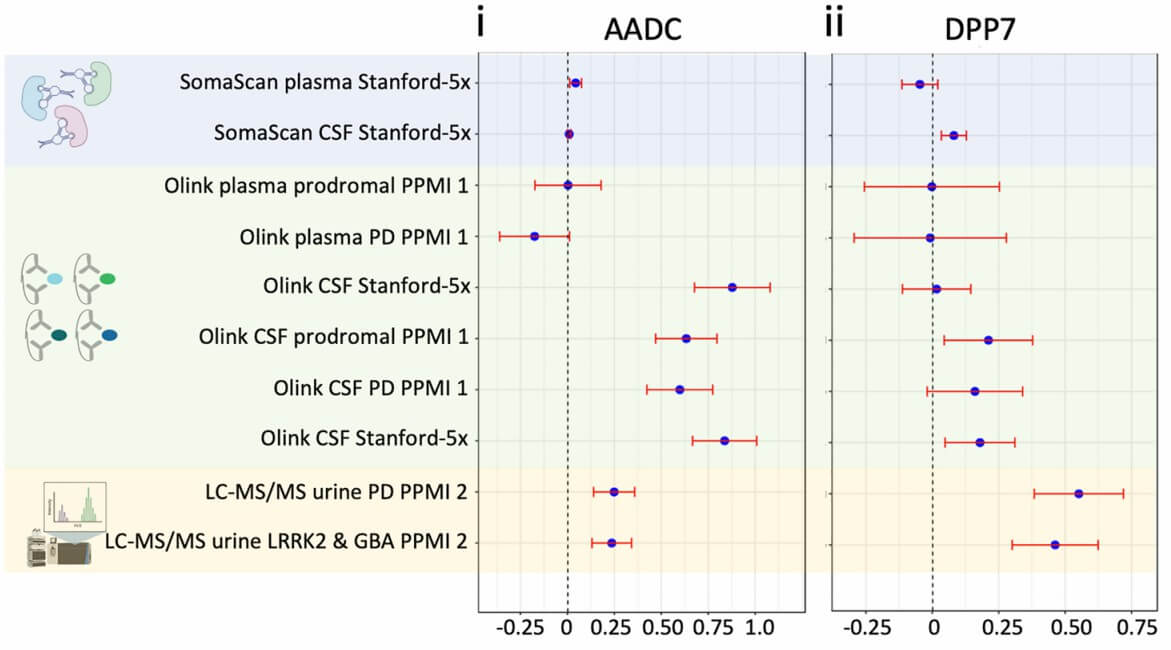 Figure 3: Summary of differential expression effect sizes across all cohorts and measurement technologies for DDC and DPP7. (Rutledge, J., et al. 2024)
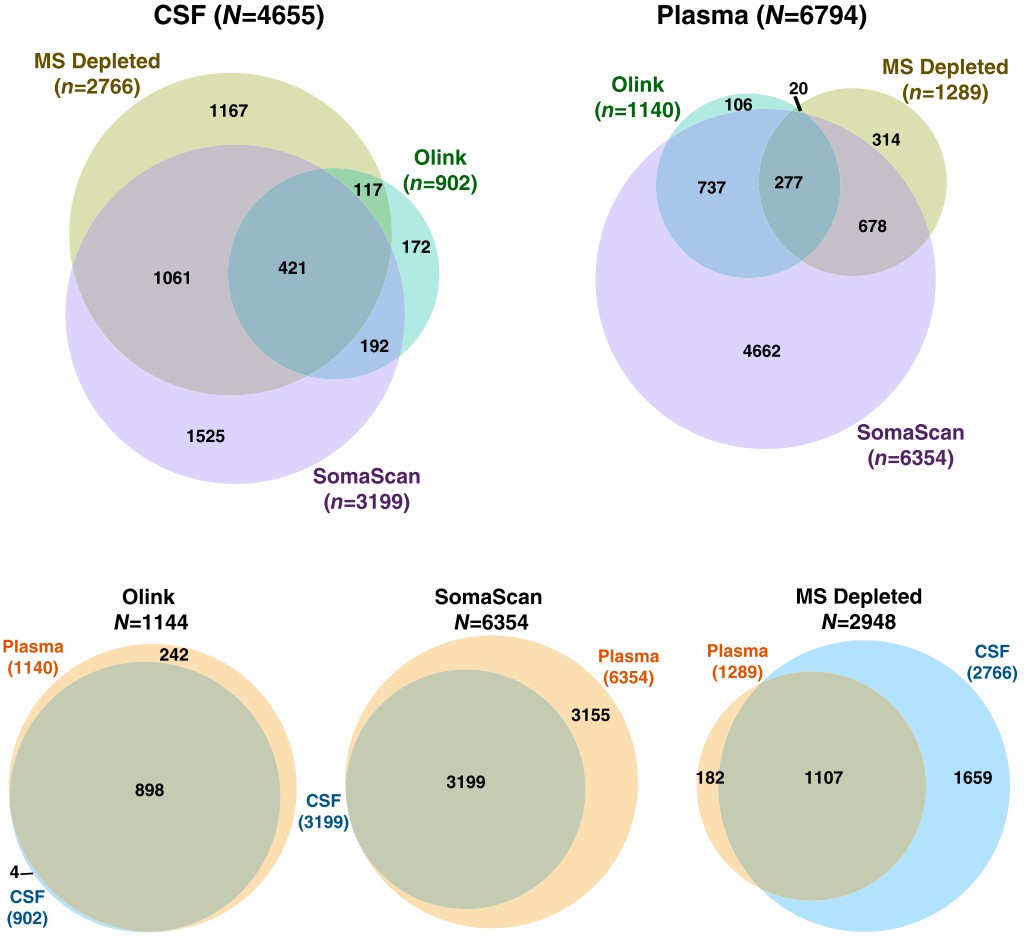 Figure 4: Depth and overlap of proteomic coverage by three platforms in CSF and plasma. (Dammer, E.B., et al. 2022)
Sample Requirements
For Olink Analysis
- Sample Type: Plasma, serum, body fluid, tissue, cells, exosomes.
- Sample size: 40 µL/sample at least. Only 1 µL of plasma/serum suffices to quantify 92-3,000+ proteins.
- Protein concentration: 0.5mg/ml ~ 1mg/ml.
- Long-term Storage: –80°C without freeze-thaw cycles.
- Avoid detergents: e.g., SDS >0.1%, Triton >1%.
For MS Analysis
- Sample Type: Plasma/serum. Tissues/cells require digestion.
- Protein concentration: 0.5mg/ml ~ 1mg/ml.
- Long-term Storage: –80°C without freeze-thaw cycles.
- Avoid: Lipophilic solvents, strong acids/bases, high salts, or reducing agents.
FAQs
What research scenarios are suitable for integrating Olink and MS technologies?
The integrated technology is applicable to:
- Disease mechanism studies: Detecting low-abundance biomarkers.
- Precision drug development: Joint analysis of drug target expression (Olink) and protein modification dynamics (MS) optimizes therapeutic efficacy assessment.
- Early screening model construction.
How should samples be prepared and allocated?
Plasma, serum, cerebrospinal fluid (CSF), and other biofluids are compatible but require standardized preprocessing. In general, Olink analysis needs 1–3 µL per sample (Target panels) or 1–6 µL (Explore HT panels). While MS analysis requires ≥50 µL for DDA mode or 20 µL for DIA mode.
Aliquot samples should avoid freeze-thaw cycles. Residual samples after Olink detection can be used for MS analysis
How to select Olink panels and MS detection platforms?
Olink panel selection: Target 48/96 (92 proteins) is optimal for validating known biomarkers. Explore 3072 covers multiple pathways for comprehensive profiling.
MS mode selection: DDA is suitable for unknown protein discovery but with lower reproducibility. DIA/SWATH have high reproducibility and are ideal for large cohort validation.
How to resolve cross-platform data inconsistencies?
The data inconsistencies are primarily caused by inherent methodological differences. Mass spectrometry frequently fails to detect low-abundance proteins that are readily measurable by Olink due to sensitivity limitations. Furthermore, inherent differences in antibody binding specificity (for Olink) and peptide fragmentation behavior (for MS) contribute to cross-platform variations in protein identification.
To address these challenges, we recommend that critical biomarkers identified across platforms should undergo priority verification through orthogonal methods like Western Blot or ELISA. While during computational analysis, machine learning models should assign greater statistical weights to proteins demonstrating consistent cross-platform results to enhance overall reliability.
What is the key difference between Olink and mass spectrometry (LC-MS)?
Olink is ideal for high-throughput, antibody-based screening of known proteins in large cohorts. Mass spectrometry is the gold standard for unbiased discovery, PTM analysis, and absolute quantification. The most powerful studies use both in combination.
Can Olink detect post-translational modifications (PTMs)?
No. The Olink PEA platform measures relative protein abundance but cannot assess PTMs such as phosphorylation or glycosylation. LC-MS fills this gap by directly detecting and quantifying modified peptides.
How do you validate Olink NPX data?
Olink NPX data are relative. We validate selected hits through targeted mass spectrometry (PRM/SRM), providing absolute concentration values (e.g., fmol/µg) and confirming protein identity and modification state.
Why choose Creative Proteomics for Olink services?
Unlike most providers, we integrate Olink screening with internal LC-MS validation and PTM analysis, offering a single, seamless solution from discovery to functional interpretation—all within one expert lab.
References
- Nyström N, Prast-Nielsen S, Correia M et al (2023) Mucosal and plasma metabolomes in new-onset paediatric inflammatory bowel disease: correlations with disease characteristics and plasma inflammation protein markers. Journal of Crohn's and Colitis 17(3):418-432. https://doi.org/10.1093/ecco-jcc/jjac149
- Rutledge J, Lehallier B, Zarifkar P et al (2024) Comprehensive proteomics of csf, plasma, and urine identify ddc and other biomarkers of early parkinson's disease. Acta Neuropathol 147(1):52. https://doi.org/10.1007/s00401-024-02706-0
- Dammer EB, Ping L, Duong DM et al (2022) Multi-platform proteomic analysis of alzheimer's disease cerebrospinal fluid and plasma reveals network biomarkers associated with proteostasis and the matrisome. Alzheimer's Research & Therapy 14(1):174. https://doi.org/10.1186/s13195-022-01113-5