
- Overview
- Panels List
- Applications
- Workflow
- Why Creative Proteomics
- Demo
- Sample Requirements
- FAQ
- Sample Submission Pack
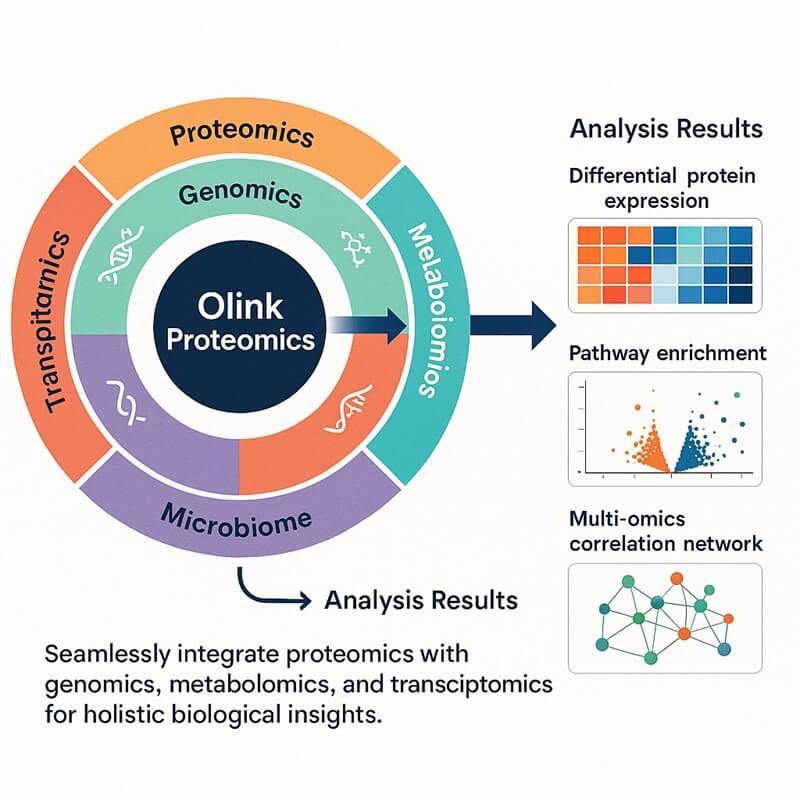
Why Integrate Olink Proteomics with Microbiome?
The Olink-Microbiome integrated approach combines high-sensitivity proteomics (Olink) with microbiome profiling to unravel host-microbe interactions at a systems biology level. Olink leverages PEA technology to quantify thousands of low-abundance proteins in minute biological samples. While microbiome analysis deciphers microbial composition, function, and metabolic activity via genomic sequencing. Together, the Olink-Microbiome platform offers transformative advantages for multi-omics research. It accelerates biomarker discovery for diseases, deconvolutes drug mechanisms, and empowering medical researches through unified data layers. Meanwhile this approach reduces sample input, processing time, and technical variability compared to conventional multi-omic approaches.
Olink Technology
Proximity Extension Assay (PEA)
1) Antibody pairs conjugate to DNA oligonucleotides.
2) Antibody pairs bind to target protein.
3) Upon co-localization, the DNA strands hybridize and extend into amplifiable templates.
4) Quantifiable DNA signals via qPCR or NGS.
Microbiome
1) Sample Collection: Collect samples in a sterile manner.
2) DNA Extraction: Extract genomic DNA from the samples using specialized kits for microbial cells.
3) Library Preparation: Amplicon sequencing, shotgun metagenomics and quality control.
4) Sequencing.
5) Bioinformatics Analysis: Preprocessing, taxonomic profiling, functional analysis, diversity analysis and advanced analyses.
6) Visualization and Interpretation.
Advantages
- Unparalleled Sensitivity: Olink detects fg/mL proteins, critical for scarce samples.
- High-Plex Capacity: Simultaneously quantifies 5,400+ proteins (Olink Explore HT) and thousands of microbial taxa/functions.
- Specificity and Reproducibility: PEA' s dual-antibody/DNA-barcode design minimizes cross-reactivity. Standardized microbiome reagents reduce batch effects.
- Workflow Compatibility: Olink runs on mainstream NGS platforms (Illumina NovaSeq/NextSeq), aligning with microbiome sequencing workflows.
Olink & microbiome Platform: Selecting the Right Panel
Recommended Panels for Integrated Analysis
Olink Panels are selected based on their ability to robustly quantify the core biological pathways most dynamically influenced by and interacting with the microbiome. Key selection criteria are:
- Immune/Inflammatory Focus: Microbiome interactions primarily manifest through modulation of the host immune system and inflammatory state. Panels measuring cytokines, chemokines, immune receptors, and inflammatory mediators are paramount.
- Metabolic Pathways: The microbiome acts as a metabolic organ. Panels assessing metabolic hormones, enzymes, and regulators capture this key interaction axis.
- Disease Relevance: Panels associated with diseases known to have strong microbiome links are highly relevant.
- Specific Immune Pathways: Panels targeting defined immune pathways (Th1/Th2/Th17, IFN response, Cytokine storm) allow focused investigation of microbiome effects on specific immune axes.
- Model System: The Mouse Exploratory Panel is crucial for translational research using murine models.
Here is a list of recommended panels we offer:
Table. List of Olink Panels
| Platforms | Recommended Olink Panels |
| Explore 384 | Olink Explore 384 Inflammation |
| Olink Explore 384 / Inflammation Ⅱ | |
| Target 96 | Olink Target 96 Mouse Exploratory Panel |
| Olink Target 96 Immuno-Oncology | |
| Olink Target 96 Metabolism | |
| Olink Target 96 Inflammatory | |
| Custom Olink Flex systems | Inflammation Panel |
| Pro-inflammatory response Panel | |
| IFN stimulation Panel | |
| Th1/Th2/Th17 response Panel | |
| Immuno-Oncology Panel | |
| Cytokine storm Panel |
Additional Options
In addition to the panels above, we also offer:
- Explore HT
- Explore 3072 (3072 proteins)
- Explore 1536 (1536 proteins)
- Explore 384
- Target 96 / Target 48
- Olink Target 96 Immune Response
- Olink Target 96 Cardiometabolic
- Olink Target 96 Neuro Exploratory
- Olink Target 96 Neurology
- Olink Target 96 Organ Damage Panel
- Olink Target 96 Cell Regulation Panel
- Olink Target 96 Oncology II Panel
- Olink Target 96 Oncology III Panel
- Olink Target 96 Cardiovascular II Panel
- Olink Target 96 Cardiovascular III Panel
- Olink Target 96 Development Panel
- Olink Target 48 Mouse Cytokine Panel
- Olink Target 48 Cytokine
- Custom Olink Flex systems
Our team can assist in designing an integrated Olink–Microbiome strategy tailored to your project goals.
Applications
This service excels in mechanistic disease research and therapeutic development:
Host-Microbe Interaction Mechanisms
- Diet-Microbiome-Immune Axis: Fermented foods increased microbial alpha diversity and downregulated 19 inflammation-related proteins, while high-fiber diets induced individualized inflammatory responses linked to microbial CAZyme expression.
- Genetic-Microbial-Proteomic Interplay: Studies reveal additive genetic and microbial effects on host proteomics.
Microbial-Diet Interaction Studies
- Fermentation-Driven Microbial Restructuring: Longitudinal diet interventions showed fermented foods increased Prevotella-driven diversity and reduced host inflammatory markers. Whereas high-fiber diets upregulated Bacteroides-associated carbohydrate metabolism but triggered host-specific proteo-inflammatory responses.
- Microbial Metabolite-Protein Links: Multi-omic correlation analyses linked microbial bile acid metabolism to Olink-detected reductions in host proteins, illustrating diet-induced host-microbe metabolic coordination.
Protein Interaction Network Mapping
- Inflammation Pathway Topology: In ocular research, Olink identified IL-7, IL-33, and EN-RAGE as hub proteins in traumatic proliferative vitreoretinopathy.
- Low-Abundance Protein Complexes: PEA' s fg/mL sensitivity detected matrix metalloproteinases (MMPs) and growth factors in lung cancer plasma, revealing tumor-stroma crosstalk networks.
Specialized Sample Research Applications
- Ocular Fluid Proteomics: Using 1-2 µL tear/fluid samples, Olink quantified 31 inflammation markers in dupilumab-treated subjects, enabling mechanistic studies of ocular surface disease.
- Microbiome-Targeted Therapeutic Monitoring: Fecal microbiota transplantation (FMT) studies tracked host proteome shifts alongside microbial engraftment, validating host-protein dynamics as integration success indicators.
Workflow of Olink & Microbiome
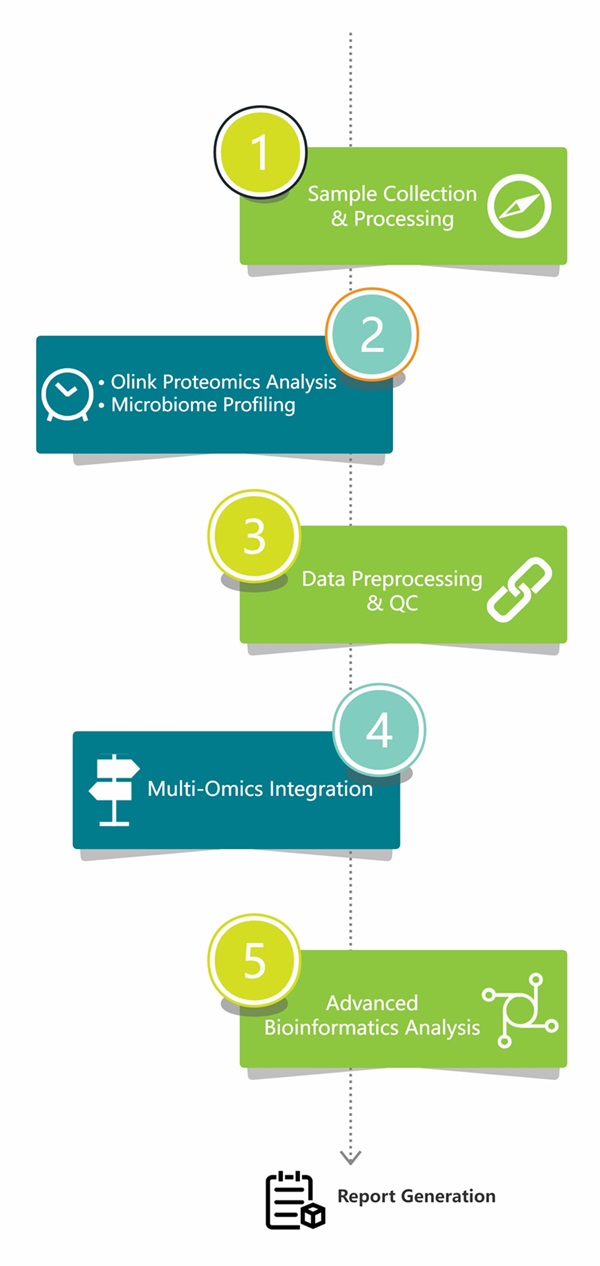 Figure 1: Workflow of integrated Olink proteomics and microbiome.
Why Creativ Proteomics
Ultra-Sensitive Multi-Omics Detection
- Olink' s PEA-NGS Technology: Detect >1,000 proteins with sensitivity down to 30 fg/mL using minimal sample volume. Dual-antibody recognition ensures very high specificity in distinguishing homologous proteins.
- Synergy with Microbiome Analysis: Identify microbial biomarkers while simultaneously quantifying host inflammatory/immune proteins linked to microbiome-host interactions.
Standardized Workflows
- End-to-end standardized pipelines from sample preparation to data analysis ensure cross-platform data comparability.
Cost-Effective Deployment
- Reduced Operational Costs: Olink leverages existing NGS ecosystems, avoiding new hardware investments. Free bioinformatics tools for QC, statistical analysis, and visualizatio.
- Microbiome Data Democratization: Public genomic databases (e.g., NCBI, global metagenomes) enable low-cost AMP discovery.
Scalability for Large Cohort Studies
- Olink' s High-Throughput Design: Support 86–100 samples per kit with unified library prep, compatible with mid/high-throughput sequencers.
- Microbiome Cohort Integration: Validated in large-scale studies linking microbiome data to host proteomics.
Demo Results
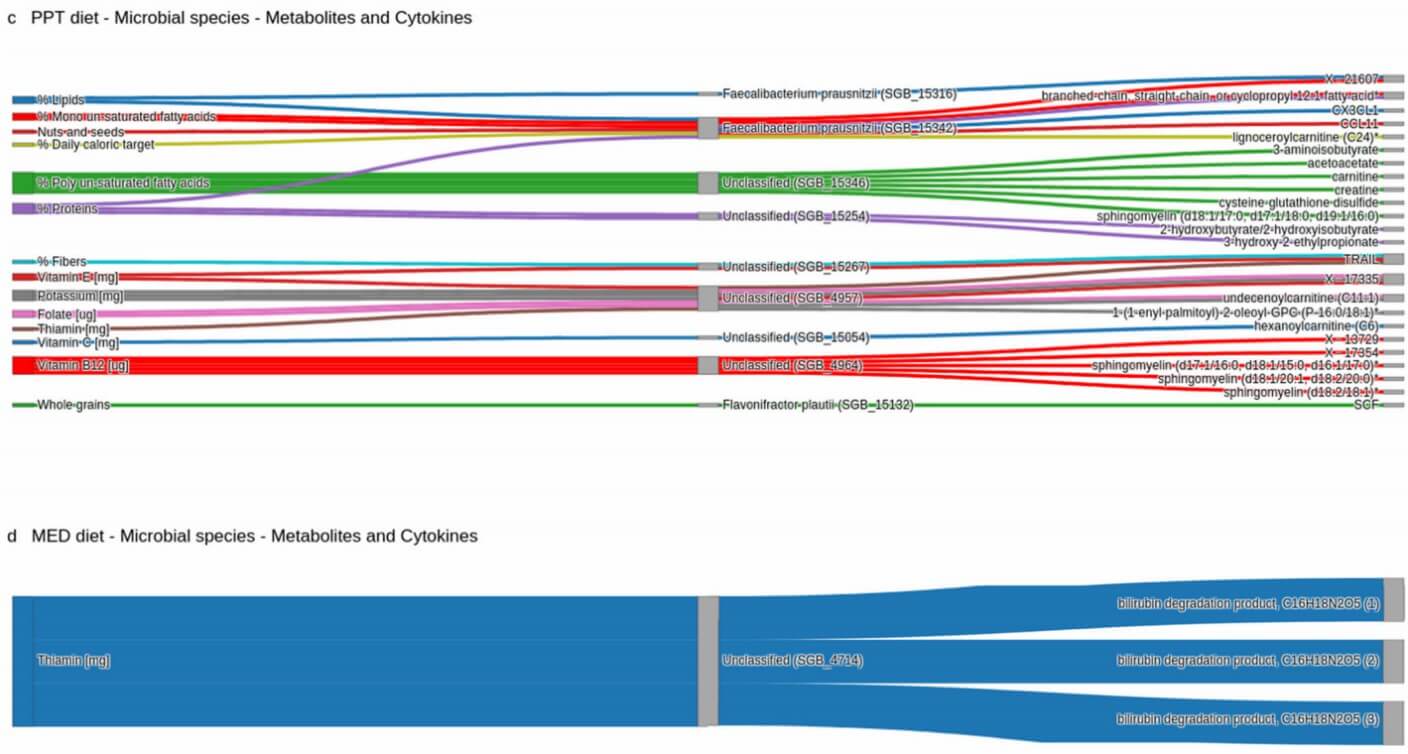 Figure 2: The microbiome mediates the diet' s effect. (Shoer, S., et al. 2023)
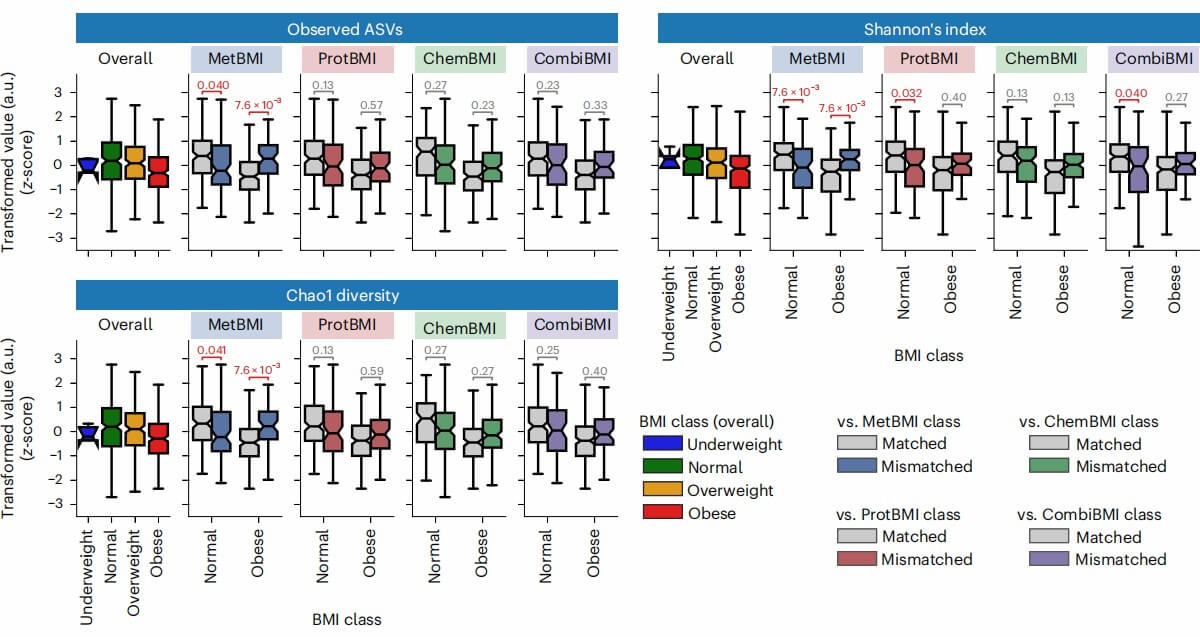 Figure 3: Difference in gut microbiome α-diversity between the matched and mismatched groups within the normal or obese BMI class. (Watanabe, K., et al. 2023)
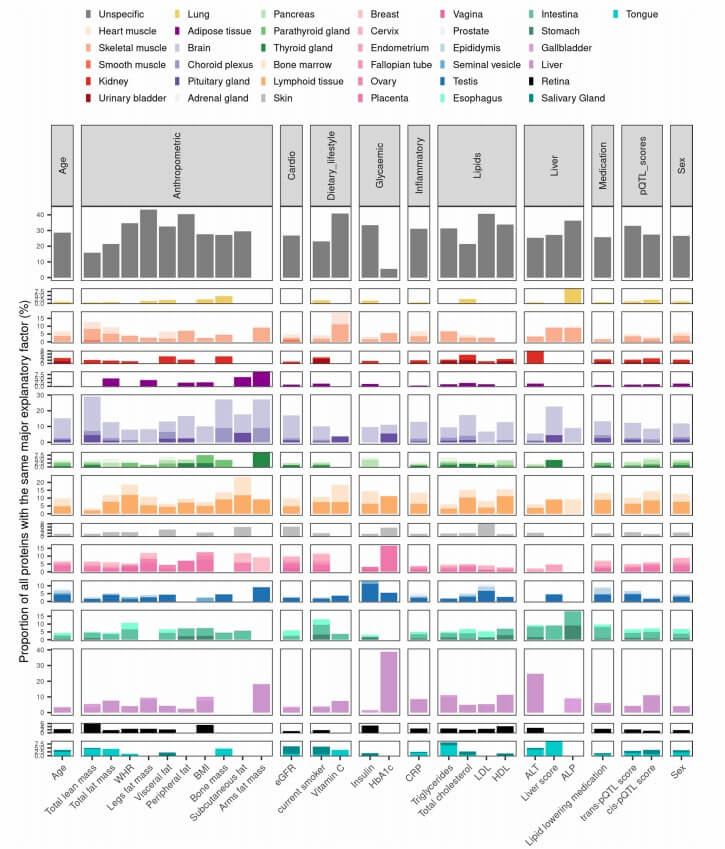 Figure 4: Proteins co-influenced by a major biological variable exhibit tissue-specific or tissue-enhanced expression patterns. (Carrasco-Zanini, J., et al. 2024)
Sample Requirements
| Step | Olink Requirement | Metabolomics Requirement |
| Volume | Ultra-low input (1-6 µL for plasma/serum; 2 µL for CSF) | ≥50 ng DNA post-extraction |
| Sample Types |
|
Stool (for gut microbiota, stored in DNA/RNA stabilization buffers to prevent nucleic acid degradation), mucosal swabs (oral/vaginal), environmental samples. |
| Storage Temperature | -80°C (for long term), avoid freeze-thaw cycles | -80°C (for long term); -20°C</a for short term) |
| Transport | Dry ice shipment; ≤-60°C | Cold chain (dry ice or ice packs) |
Notes
- Volume Optimization: For paired samples (e.g., plasma + stool from same donor), prioritize Olink' s low-volume advantage (2 µL plasma) to reserve microbiome aliquots.
- Use identical extraction buffers for microbiome DNA and Olink-compatible lysis buffers for tissue/cell pellets.
FAQs
Which Olink panels are best suited for microbiome studies?
Panel choice depends on the biological focus. Inflammation Panel is ideal for immune-microbiome interactions. Immune Response Panel tracks adaptive immunity markers in autoimmune/microbiome studies. Cardiometabolic or Organ Damage Panels are for metabolic diseases where microbiome dysbiosis affects liver fat metabolism. Multi-panel approaches (e.g., Inflammation + Immune Response) are common in complex diseases like IBD.
How do you address noise in multi-omics data integration for Olink-microbiome studies?
Integrating Olink proteomics with microbiome analysis introduces challenges from technical variability and biological complexity, which are mitigated through a multi-tiered approach:
- Low-variance features are filtered to retain only biologically relevant signals
- Statistical replication is prioritized using independent cohorts or longitudinal sampling to validate findings.
- Olink' s PEA technology minimizes false positives via dual-antibody binding and DNA barcode amplification, ensuring >90% specificity for low-abundance proteins. For microbiome data, contamination is controlled via spike-in standards, while batch effects are corrected computationally.
- Machine learning prioritizes high-confidence protein-microbe interactions by weighting features like microbial pathway abundance against Olink protein clusters.
What sample types and volumes are required?
For Olink analysis, serum/plasma (1- 6 µL per panel), CSF, or tissue blister fluid are required. For microbiome analysis, stool (for 16S/metagenomics), mucosal biopsies, or intestinal lavage fluid are required.
References
- Shoer, S., Shilo, S., Godneva, A. et al. Impact of dietary interventions on pre-diabetic oral and gut microbiome, metabolites and cytokines. Nat Commun 14, 5384 (2023). https://doi.org/10.1038/s41467-023-41042-x
- Watanabe, K., Wilmanski, T., Diener, C. et al. Multiomic signatures of body mass index identify heterogeneous health phenotypes and responses to a lifestyle intervention. Nat Med 29, 996–1008 (2023). https://doi.org/10.1038/s41591-023-02248-0
- Carrasco-Zanini, J., Wheeler, E., Uluvar, B. et al. Mapping biological influences on the human plasma proteome beyond the genome. Nat Metab 6, 2010–2023 (2024). https://doi.org/10.1038/s42255-024-01133-5