
Introduction — Why your cytokine method choice changes the story
Olink panel workflows sit alongside ELISA, Luminex, MSD, and newer ultra-sensitive platforms. Many teams compare Olink proteomics or an Olink cytokine panel to these alternatives and see different answers on the same samples. That is not a trivial detail—it shapes conclusions, budgets, and follow-up assays. Cross-platform studies show real gaps in detectability, dynamic range, and agreement across overlapping cytokines. (Abe et al., 2024. DOI: https://doi.org/10.4049/jimmunol.2300729)
In one NIH cohort, Olink and an alternative proximity-ligation system agreed better with each other than with bead-based Luminex on shared targets, highlighting technology-driven bias. The study compared detectability, correlation, and differential expression across platforms—three metrics that directly affect discovery and validation plans. (Abe et al., 2024. DOI: https://doi.org/10.4049/jimmunol.2300729)
Why do methods diverge? The answer begins with assay physics. Olink's Proximity Extension Assay (PEA) uses dual antibody–oligo pairs plus nucleic-acid readout to boost specificity at low sample volumes, whereas bead-based and electrochemiluminescent assays trade different strengths in multiplexing and sensitivity. A methodological mini-review and foundational reports outline how PEA works and where it typically excels.
This article is a practical buyer's guide, not a cytokine primer. We will compare platforms on the factors that decide projects—sample volume, multiplex breadth, sensitivity at the low end, matrix tolerance, cost per answer, and scalability. Along the way, we will reference peer-reviewed comparisons and provide tables you can reuse in internal decision memos.
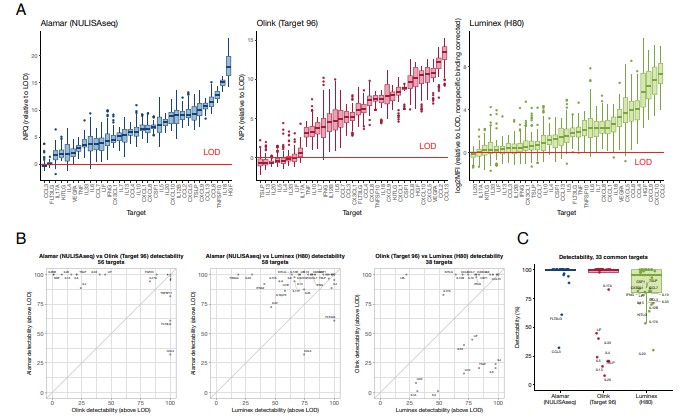 FIGURE 1. Cytokine Detection platforms.
Technology Options at a Glance — What Each Method Actually Measures
Below is a summary of how various cytokine/protein detection methods work, and what kinds of signals or measurements they provide. This helps compare what "being detected" really means across platforms.
| Method | How It Detects Protein / Key Steps | What the Measured Signal Represents (Units, Readout) | Strengths / What It Emphasises | Key Constraints / What It Might Miss |
| Olink PEA / Olink cytokine panel | Two antibodies each tagged with complementary DNA oligonucleotides bind the same target protein. When both bind, their DNA tags are brought close and hybridize, then extended by polymerase. After that, amplification (qPCR or sometimes NGS) yields a DNA barcode proportional to protein concentration. | Relative quantification units (often NPX: Normalized Protein eXpression) or other normalized readouts; low-pg/mL detection possible; small sample input (≈1 µL for many panels) | High specificity (dual-antibody + DNA proximity reduces background and cross-reactivity); small sample requirement; multiplex capability; excellent performance in overlapping analytes vs MSD and Luminex in many studies | For very low-abundance analytes below the detection limit or in very challenging matrices, sensitivity might lag that of ultra-sensitive single-molecule platforms; absolute quantification across platforms can vary due to different standard curves, antibodies, or readout chemistry. Requires careful normalization. |
| MSD (Meso Scale Discovery) | Uses sandwich immunoassay format: capture antibody + detection antibody labeled with an electrochemiluminescent tag (sulfo-tag). Carbon electrode or multi-spot plate is used. Upon applying voltage, the tag emits light; intensity is captured. Usually limited multiplex spots per well (e.g., 10-plex or so) in many panel formats. | Light signal (electrochemiluminescence) proportional to amount of target protein; with standard curves gives amount in pg/mL or lower; can have wide dynamic range; signals often above background at low analyte concentrations. | Very sensitive; good dynamic range; good in complex matrices; well known reagent sets; moderate multiplex; reliable for many cytokines, especially those of medium to low abundance. | Multiplex capacity is limited compared to high-plex options; sample volume tends to be higher than Olink for comparable multiplex levels; some assays require optimization for background in very low analyte levels. |
| Luminex / Bead-based multiplex immunoassay | Microspheres ("beads") are dyed to different spectral signatures, each bead type has a capture antibody. Sample binds; a detection antibody with reporter (often fluorescent) binds; the bead identity (spectral address) is read by lasers or optics to discriminate bead, and reporter intensity gives amount of analyte. | Fluorescent reporter intensity per bead, calibrated via standards, producing concentrations (often pg/mL). Multiplex up to tens of analytes per well (sometimes 20-80 depending on bead sets) in many platforms. | Good for profiling many cytokines at moderate sensitivity; well understood; relatively flexible in customizing panels; many labs have this capacity; decent throughput. | Background fluorescence / cross-reactivity can be higher; sample volume often higher vs Olink; some low-abundance targets may not be consistently above detection; quantification may vary more across runs / labs. |
| ELISA (Traditional single-analyte or multiplex-adapted formats) | Capture antibody immobilised on plate; sample incubated; detection antibody (enzyme-linked) binds; substrate added; enzymatic reaction produces colorimetric or chemiluminescent signal measured by plate reader. Multiplex ELISA exists but often separate wells per analyte or limited multiplex. | Signal intensity (absorbance, luminescence) converts via standard curve to concentration (pg/mL etc.). Single analyte per well (or small sets) gives high precision per analyte. | Very high specificity per analyte; well-validated kits; widely available; lower technical complexity; good for verification/follow-up of discovery findings. | Not efficient when many analytes are needed; higher sample volume; less efficient in cost/time per analyte for large panels; sometimes limited dynamic range; weaker multiplexed background control. |
| Ultra-sensitive single molecule or proximity ligation / novel assays (e.g. Simoa, NULISA / Alamar) | These often amplify signals at or near the single-molecule level. Example: Simoa isolates single immunocomplexes on beads in arrays; NULISA / proximity ligation or proximity extension variants may use DNA barcode counting or fluctuation analysis. They often push detection limits very low, and can detect analytes that are undetectable by more conventional platforms. | Very low pg/mL or even fg/mL detection; sometimes lower dynamic range at high ends; readouts may be digital counts or amplified signals mapped back to concentration. Correlation with other platforms may drop for low-abundance targets. | Excellent for rare, low-expressed cytokines; useful in early-response, biomarker discovery. But often higher cost per analyte/sample; limited multiplex (less analytes measured simultaneously compared to bead sets or Olink high-plex arrays); may require specialized equipment or strict sample handling. |
Comparison Highlights
In the Olink white paper comparing Olink Target 48 with MSD and Luminex over overlapping cytokines: Olink used ~1 µL sample volume, whereas Luminex needed ~12.5 µL and MSD ~20-40 µL per panel.
Assay overlap in that comparison: for 20 shared proteins, metrics like linearity, detectability, and precision were assessed. The platforms varied: sensitivity, detection rate, dynamic range and CV (coefficient of variation).
In the Cross-platform study of inflammatory markers in a COVID-19 cohort (Alamar NULISAseq vs Olink vs Luminex): Alamar had highest detectability overall; Olink generally better than Luminex in many shared targets; but for some cytokines Luminex outperformed depending on which antibodies were used.
Nasal epithelial lining fluid (NELF) from healthy subjects, comparing Olink, MSD, Luminex: most "medium-abundance" analytes (e.g. IL-1α, IL-6) correlated well (Spearman r ≥ 0.7-0.9), but low abundance ones (e.g. IL-2, IL-4, IL-10, IL-13) often fell below detection or had poor correlation.
Key Comparison Dimensions — Sensitivity, Dynamic Range, Sample Volume etc.
Here, we dive into the measurable metrics that often differ across cytokine detection technologies. Understanding these dimensions helps researchers choose the right platform for their specific project constraints.
Sensitivity & Detectability
What it means: The lowest concentration of a cytokine that an assay can reliably distinguish from background (often called LOD or LLOQ), and how often a given cytokine is actually detected in real samples (detectability).
What studies show:
- In the IMPACC COVID-19 cohort comparing Olink (PEA), Luminex, and Alamar NULISAseq, Alamar had the highest overall detectability; Olink was next, then Luminex. Some low-abundance cytokines were missed or underrepresented in Luminex.
- The Olink white-paper comparing Target 48 with MSD and Luminex across ~20 overlapping cytokines found that Olink often achieved similar or better sensitivity than Luminex, and comparable sensitivity to MSD for many analytes.
- In nasal epithelial lining fluid (NELF) from healthy subjects, some cytokines (IL-2, IL-4, IL-10, IL-13) were poorly correlated and frequently below detection limits for both Olink and Luminex; MSD showed higher sensitivity for several of those proteins.
Take-home:
If your project involves low-abundance cytokines (early markers, basal inflammation, rare cell types), you should prioritise platforms with proven high sensitivity. Olink performs well in many such cases, but in ultra-low abundance or difficult matrices, MSD S-plex or similar ultra-sensitive methods may outperform. Also, detectability correlates with how well you can observe differential expression (i.e., missing data = less statistical power).
Dynamic Range & Linearity
What it means: How many orders of magnitude between the lowest and highest reliably measurable concentrations; how well the assay responds linearly to changes (e.g. in a dilution series).
What studies tell us:
- In the Olink Target 48 vs MSD vs Luminex white paper, all platforms were tested for linearity and dilution parallelism in clinical samples. Olink showed robust performance over its dynamic range for overlapping proteins.
- MSD S-plex vs Olink vs Quanterix SP-X comparisons demonstrated that although all platforms had strong correlations, S-plex had superior sensitivity at the low end and maintained linearity across a broad concentration range.
Considerations:
Some assays saturate at higher concentrations; others lose precision at the low end. If your sample likely contains very high cytokine levels (e.g. after strong stimulation), ensure the assay's upper limit will accomodate without needing excessive dilutions, which introduce error. Also, verifying linearity via dilution series is critical.
Sample Volume & Matrix Constraints
What it means: How much sample is needed per run (per well, per panel), and whether certain sample types (plasma, serum, tissue lysate, NELF, CSF etc.) affect performance.
Findings from literature:
- The Olink white paper reports Olink Target 48 using ~1 µL of sample per panel; Luminex required ~12.5 µL per panel; MSD used ~20-40 µL per panel.
- From Stanford HIMC FAQ: Olink needs ~10 µL, NULISAseq ~35 µL, Luminex ~30-60 µL depending on matrix and dilution.
- In NELF sample comparisons, more analytes fell below detection for Luminex and Olink when sample matrix was low-volume fluid with dilute protein; MSD often detected more in those cases.
What to watch out for:
If your sample is precious (e.g. rare fluids, small animal models, multiple time-points), platforms that consume low volume (like Olink) are advantageous. But note: matrix (presence of interfering proteins, viscosity, dilution) can degrade low-level detectability, regardless of volume. Also, more sensitive platforms often require careful sample handling to avoid loss or degradation.
Precision, Reproducibility & Batch-to-Batch Variability
What it means: How consistent the measurements are within a run (intra-assay precision), between runs or plates (inter-assay precision), and between labs or operators.
Supported by studies:
- The Olink white paper and comparative studies include metrics of coefficient of variation (CV) across dilution series and replicate measurements; Olink generally shows <20% CV across many shared analytes.
- The COVID-19 cohort comparison found that for analytes with high detectability, platform correlations were good (low variance), but for low detectability analytes variability rises sharply.
Implication:
For experiments where small fold-changes matter (e.g. 1.2- to 2-fold), precision must be high. If your target analytes are low or borderline detectable, you may get noise that masks real biological differences unless the assay is validated in your sample matrix. Also plan for batch effects by including replicates, controls, and ideally randomizing sample groups across plates.
Cost, Economics, and When Each Method Makes Sense
Deciding on a cytokine detection platform isn't just about sensitivity or dynamic range; economics and context often drive the final choice. Here, we compare cost-factors for Olink vs alternatives, and recommend when each technology is most practical.
What Drives Cost
Several components contribute to the total cost of running a cytokine assay:
- Consumables & reagent costs — reagents, antibodies, labels, detection tags.
- Kit format fees — whether you must purchase a whole panel/array vs single-analyte kits.
- Sample preparation / matrix handling — more complex matrices cost more (dilution, cleanup).
- Labor / hands-on time — set-up, washes (if any), sample handling, replicates.
- Instrument / infrastructure costs — owning vs outsourcing; maintenance; licensing; readout equipment (qPCR, flow cytometer, ECL reader).
- Batch size / throughput economies — per-sample cost drops as total number of samples per run or array fills up.
Known Cost Examples & Price-Breakdowns In Olink
Vanderbilt University Medical Center Core Pricing for Olink panels:
- For the Olink Target 48 Human Cytokine panel (~45 assays plus internal controls, minimum 40 samples) including kit + service + shipping: ~$4,900 for internal academic users; non-affiliated academics ~$5,500; for-profit clients higher.
- For Target 96 larger panels (92 assays), similarly priced cores run $7,900-$9,000 depending on user affiliation.
White Paper Data (Olink vs MSD vs Luminex) also indirectly shows cost drivers:
Olink uses ~1 µL sample per panel vs Luminex (~12.5 µL) and MSD (~20-40 µL). Smaller sample volumes reduce reagent use and sample preparation cost. However, Olink panels are sold per array (fixed sample number + controls), so filling the panel matters.
Comparative Economics: Olink vs Luminex vs MSD & Single-Analyte
| Platform | Typical Batch Size / Kit Format | Approximate Cost Drivers / When Prices Drop | When Cost per Analyte or Sample Becomes Favorable |
| Olink (Target 48 / 96 / Flex etc.) | Kits/arrays have fixed sample slots (e.g., 88 + controls, or 40 + controls) | Cost per sample declines when you fill the array; shipping/core service fees are amortized. For few samples (< half array), per-sample cost is high due to fixed kit expense. | Good for studies with moderate-to-large sample numbers, where the fixed cost is shared. Also useful when high multiplexing is needed with limited sample volume. |
| Luminex / Bead-based multiplex | Kits often priced per sample; flexible batch size; more flexibility to run fewer samples without waste. | Cost per sample stays relatively constant; reagent and bead cost scale with number of analytes; large panels/beads sets more expensive. Also sample prep / dye/bead set costs. | Favorable when you need a lot of analytes per sample and have enough sample volume; or when you cannot fill arrays like Olink. Good balance for exploratory profiling. |
| MSD (V-Plex / S-Plex etc.) | Panels up to ~10 analytes per well; often with higher sensitivity (especially S-Plex) which can demand higher reagent cost per spot. | Cost per analyte/sample tends to be higher than bulk multiplex platforms; however, fewer analytes but high sensitivity may justify cost. When you buy large sets or contract service, per-unit cost may decrease. | Best when you need ultra-sensitive quantitation for a smaller set of targets; verification of hits; low-abundance or rare cytokines; or when you have complex matrices requiring cleaner detection. |
| ELISA / Single-analyte kits | Bought per target; small scale; reagents and plate reader costs are modest; labor or technician time can dominate. | Cost per analyte low if you only need 1-3 cytokines; cost escalates quickly with number of targets or samples; often inefficient for multiplex needs. | Makes sense in verification / validation stage, or when sample numbers are small, or you only care about a few cytokines. Also good when equipment/infrastructure for multiplex methods is unavailable. |
When Each Method Makes Sense (Fit-for-Purpose Scenarios)
To help you pick the right platform, here are scenarios matched to the most economical & technically appropriate choice.
| Situation / Project Need | Best Choice Platform(s) | Rationale |
| Large-scale discovery study (many samples, many cytokines) | Olink (Target 96 or high-plex), possibly NULISAseq if available; also high-plex Luminex if sample volume allows | High multiplexing and economies of scale reduce cost per analyte/sample; Olink's low sample input is beneficial; batch arrays help reduce waste. |
| Limited sample volume / precious matrix | Olink panels; MSD S-plex; ultra-sensitive single-molecule platforms | These platforms require minimal input and maintain sensitivity even with low sample amount. |
| Few targets, particularly very low abundance | MSD S-plex; ultra-sensitive ELISA; possibly single-molecule methods | Higher reagent cost but justified by needs; many multiplex platforms may not reliably detect these low-abundance cytokines. |
| Verification / follow-up of discovery hits | ELISA or small multiplex panel (MSD, Luminex) | Verification demands high precision per analyte, lower sample numbers, reproducibility; ELISA often sufficient. |
| Pilot / proof-of-concept with small sample size | Luminex or smaller Olink Flex / small panel; possibly outsourcing to core labs to reduce setup cost | Avoid committing to full production array; flexible platforms reduce initial financial risk. |
| Budget-restricted lab with basic equipment | ELISA; smaller bead-based multiplex; possibly shared core services offering Olink if accessible | Lower set-up costs; avoid purchasing expensive instruments; rely on service providers to amortize cost. |
Case Studies / Comparative Studies
Below are peer-reviewed comparisons that show how platform choice changes what you detect, how strong the signals are, and what conclusions you draw.
Case Study 1 — COVID-19 cohort: three platforms, three stories
Design. In the NIH IMPACC cohort, serum from 23 patients (78 longitudinal samples) and 8 controls was profiled on three platforms: Olink Target 96 (PEA), Luminex (three panels, 80 targets), and Alamar NULISAseq (PLA). Outcomes included detectability, cross-platform correlation, and differential expression over time. (Abe et al., 2024. DOI: https://doi.org/10.4049/jimmunol.2300729)
Key findings.
Overall detectability ranked: Alamar > Olink > Luminex. Olink outperformed Luminex for many shared proteins. Some low-abundance cytokines (e.g., IL-13, IL-20) were captured only by the most sensitive method.
Correlations were stronger between Alamar and Olink than with Luminex, indicating technology-driven bias.
Detectability differences often changed differential expression results. For instance, IL-5 changes were seen by Alamar and Luminex but not by Olink, aligning with each platform's detectability for that target.
What this means for selection. If your endpoints hinge on low-abundance cytokines, choose platforms with proven detectability in your matrix. For broader profiling with limited volume, Olink balances multiplexing and sample use; for the very lowest signals, consider ultra-sensitive options.
Case Study 2 — Healthy nasal epithelial lining fluid (NELF): matrix matters
Design. NELF from 20 healthy adults was analysed on Olink, MSD, and Luminex. The study compared detectability and cross-platform correlations for shared proteins in a low-protein, low-volume matrix. (Zelten et al., 2023. )
Key findings.
High-abundance markers (e.g., IL-1α, IL-6) correlated well across platforms (Spearman r ≥ 0.7–0.9). Low-abundance cytokines (e.g., IL-2, IL-4, IL-10, IL-13) showed poor correlation and frequent below-LOD values for Olink and Luminex; MSD more often detected those targets.
What this means for selection. In dilute or challenging matrices, platform sensitivity at the low end dominates outcomes. If you expect many values near LOD, MSD (especially S-PLEX) may provide more analyzable data; otherwise, Olink's low input volume and multiplexing are attractive for discovery.
Case Study 3 — Head-to-head "high-sensitivity" assays: sensitivity vs breadth
Design. A multi-platform comparison evaluated MSD S-PLEX, Olink Target 48, and Quanterix SP-X, using MSD V-PLEX as a widely used quantitative reference set. (Expert Review of Proteomics, 2024. DOI: https://doi.org/10.1080/17576180.2024.2442190)
Key findings.
All platforms showed strong overall correlations, but S-PLEX achieved the best sensitivity at the very low end, while Olink Target 48 provided high multiplexing with minimal volume and solid linearity across many cytokines.
What this means for selection. When your question is "How low can we go?", S-PLEX often wins. When your question is "How many can we profile with tiny volumes?", Olink is compelling.
Case Study 4 — Olink vs MSD vs Luminex, same specimens, same targets
Design. Olink's Target 48 Cytokine panel was compared head-to-head with MSD and Luminex on overlapping analytes; metrics included detectability, linearity, precision, and required sample volume. (Olink White Paper, 2022)
Key findings.
Sample input: Olink used ~1 µL per panel vs ~12.5 µL (Luminex) and 20–40 µL (MSD). Detectability and dilution linearity were strong for many shared targets.
What this means for selection. If your constraint is precious volume or plate capacity, Olink's input requirements and panel workflow can be decisive. Use MSD/Luminex when you need custom analyte sets or aim to push sensitivity for a few targets.
Quick chooser — Mapping findings to use-cases
Low-abundance signals in tricky matrices → MSD S-PLEX or similar ultra-sensitive assays.
Broad profiling with minimal volume → Olink Target 96/48 panels.
Need correlation to an ultra-sensitive reference → Expect stronger alignment between ultra-sensitive platforms and Olink than with bead-based assays for many markers.
When planning immune studies: Using Olink's Cytokine Panels for Immune System Research.
For benefits and use-cases: Olink's Cytokine Assays: Key Benefits and Applications in Research.
For format trade-offs: Exploring the Olink 96 and 48-Plex Panels: Key Differences.
Practical Decision Guide
Here's a consolidated summary you can use to quickly compare platforms, plus a decision guide to pick the right one for your project.
Summary Comparison Table
| Key Metric | Olink PEA (Target 48 / 96) | MSD (V-Plex / S-Plex etc.) | Luminex Bead-based | ELISA / Single-Analyte |
| Sample volume | ~1 µL per panel (overlap study) for many analytes. | ~20-40 µL per panel for high multiplex or spots. | ~12.5-50 µL depending on panel size and matrix. | Typically ≥ 50-100 µL per analyte/well; inefficient when many analytes needed. |
| Detectability / Sensitivity for low-abundance cytokines | High: often low-pg/mL; good detectability across many shared targets. | Very high, especially with S-Plex; often picks up targets below Olink's limit in some matrices. | Moderate to good for many targets; some low-abundance analytes tend to fall below detection. | Depends heavily on kit and antibody; often best for verification rather than broad discovery of low-expressed proteins. |
| Dynamic range & linearity | Strong linearity over several log units in dilution series; reliable over many analytes in white-paper comparisons. | Good dynamic range; especially in higher sensitivity panels; retains linearity if high and low levels are covered. | Good across moderate dynamic ranges; may suffer at extremes (very low or very high) depending on panel and matrix. | Narrower range usually; at very high analyte levels may saturate; sometimes limited dynamic range in low end. |
| Multiplexing capability | High: panels of 48 or 96 (or more depending on configuration) allowing many analytes per sample. | Moderate: typically up to ~10 per well in standard multiplex panels; more with advanced formats but with trade-offs. | High: up to 20-80 analytes depending on kit; flexible combinations. | Low: usually 1 analyte per well; multiplex (if available) is more expensive and less common. |
| Matrix compatibility & background / cross-reactivity | Good specificity using PEA; relatively low background; dual antibody + DNA proximity helps reduce cross-reactivity. | Strong in challenging matrices; ECL detection helps reduce some background; advanced panels improve background suppression. | More risk of background / cross-reactivity; bead sets may have non-specific binding especially in complex matrices. | Variable; kit quality matters; interfering substances in sample (e.g. high protein content, lipids, viscosity) can influence results; usually robust in simpler matrices. |
| Cost per analyte / cost per sample | Higher fixed cost for full panel; best value when you fill array/sample #; low sample volume reduces reagent waste. | Moderate-to-high, depending on panel; sensitive panels cost more; but for small numbers of analytes, cost may be justified. | Moderate; more flexible per-sample cost; scaling is easier for variable sample numbers. | Lowest for single analytes; cost rises steeply if many targets or many samples. |
| Best use-case types | Broad profiling when sample size limited; discovery studies with many analytes; high multiplex with good sensitivity. | Projects focused on rare/low-abundance cytokines; validation or follow-up of discovery hits; when sensitivity for few analytes is critical. | Pilot studies; moderate multiplex; labs that already have bead-based infrastructure; exploratory biomarker screening. | Verification; simple cytokine panels; labs with limited infrastructure; when only a few targets matter. |
Practical Decision Guide
Use this step-by-step checklist to decide which platform matches your project needs:
Define your analytic priority
- Do you need many cytokines measured at once, or just a few?
- Are you looking for low-abundance / weak signals, or working with strong cytokine expression?
Check sample volume and matrix constraints
- Is the sample fluid limited (e.g. precious clinical samples, small animals, rare fluids)?
- What matrix is used (plasma, serum, tissue lysate, NELF, etc.)? Does it have interfering components?
Evaluate cost and throughput expectations
- How many samples do you have? If many, fixed-format arrays (Olink) may be more economical.
- Are you running once, or multiple batches / time-points? Batch effects and array fill matter.
Consider sensitivity and detectability in similar contexts
- Look at literature or pre-studies in similar matrices. For example, in NELF, some cytokines (IL-10, IL-13 etc.) were often below detection for Olink and Luminex but detectable with MSD.
- If low expression targets matter, plan for ultra-sensitive platforms.
Think about consistency, reproducibility, and panel overlap
- Do you need to compare across studies / labs later? Consistency is easier when methods have strong correlation across platforms (e.g. Olink vs MSD for many targets).
- Are you using shared targets with prior work? If so, matching platform or including overlap targets helps.
Decide on sample fill / batch strategy
- For full-array panels (Olink, NULISA etc.), cost per sample drops when the array is nearly full. If you have few samples, consider whether the fixed cost is justified.
- For bead-based or smaller multiplex, more flexible batch sizes may reduce waste.
Pilot test or validate
- Run test samples to check detectability, linearity, reproducibility in your lab matrix.
- Use dilution series, run shared controls, estimate coefficient of variation (CV), examine how many analytes fall below the LOD.
Example Decision Scenarios
| Your Situation | Best Platform Choice | Why It Fits |
| You have 25 serum samples from vaccinated animals; you want to profile ~50 cytokines, sample volume limited (~5 µL per time-point) | Olink Target 48 or 96 | High multiplex with low input; more cost-efficient than buying many single-analyte ELISAs; detectability likely acceptable for many analytes. |
| You want to track very low expression cytokines (e.g., IL-33, IL-13) in nasal lining fluid from healthy volunteers | MSD S-Plex or ultra-sensitive panels | Based on comparative data (NELF study), MSD had higher sensitivity for low-abundance ones; better detectability in challenging matrix. |
| Early screening (pilot) with few samples to decide which targets are changing under treatment | Luminex + ELISA verification | Luminex gives broader coverage; then validate specific hits with ELISA for better precision. |
| You have hundreds of samples for an inflammatory marker panel, minimal remaining sample volumes, and need data comparable to other published work using Olink | Olink + careful batch design | Olink's arrays can leverage low volumes and yield data that align well with published Olink / MSD work. Filling arrays / good controls will help reproducibility. |
Conclusion
Key Take-Home Messages
The quality of your cytokine data often hinges less on brand prestige and more on matching platform features to your project constraints. Key dimensions like sensitivity for low-abundance targets, sample volume, matrix compatibility, cost structure, and multiplex breadth determine whether your experiment succeeds.
Olink PEA-based panels (e.g., Target 48, Target 96, Explore) offer a strong balance: very low sample input (~1 µL), excellent specificity (dual antibody + DNA barcodes), good dynamic range, and high multiplexing. For many research groups doing discovery, immune profiling, or longitudinal studies, Olink tends to minimize sample waste while maximizing usable data.
That said, no platform is universally best. If you need extremely low detection limits in difficult matrices (e.g. nasal fluids, exosomes), ultra-sensitive or spot-based platforms like MSD S-Plex or similar may yield higher detectability for specific targets.
For many projects, pairing Olink with a pilot run or verification by simpler assays (ELISA or bead-based) improves robustness and strengthens findings. Also combining PEA panels with mass spectrometry can extend coverage or validate novel protein candidates.
Why Olink Makes Sense for Non-Clinical Research
Flexible sample types: serum, plasma, tissue/cell lysates, perhaps exosomes or small fluids. Olink has shown compatibility with a broad range of matrices, which reduces overhead in sample prep and avoids repeated pilot optimization.
Scalable study designs: you can begin with a mid-plex panel, then escalate to high-plex or custom panels, without rewriting assay workflows. The consistency of Olink's QC controls helps preserve reproducibility across batches.
Supporting services & infrastructure: Olink offers service laboratories (Uppsala, Boston etc.), prevalidated panels, data normalization pipelines, and strong technical support. All this reduces risk, especially for academic or biotech labs venturing into proteomics.
Breadth of adoption: PEA technology is now cited in thousands of peer-reviewed papers. That level of community usage builds trust, replicability, and often comparison benchmarks.
When to Choose Alternatives or Complementary Techniques
Ultra-sensitive detection of rare biomarkers or post-translational modifications often remains the domain of LC-MS or specialized immunoassays. When you need that type of information, combining methods can be powerful.
If your grants / budget limit sample numbers, or if fixed-panel cost per sample is high for small batches, bead-based multiplex or ELISA may remain cost-efficient for limited targets.
Next Steps
If you're planning a study using cytokine profiling or immuno-biomarker discovery, here's how to move forward:
Reach out for a consultation. Tell us your sample type (volume, matrix), number of samples, number of cytokines of interest, budget. We'll help set up a pilot or full-panel design using Olink proteomics that's fit-for-purpose.
Book our service laboratories. If you prefer to outsource analysis, we offer full-service sample processing, data normalization, and reporting through Olink's qualified centers.
References
- Koji Abe, Joanne C Beer, Tran Nguyen, Ishara S Ariyapala, Tyson H Holmes, Wei Feng, Bingqing Zhang, Dwight Kuo, Yuling Luo, Xiao-Jun Ma, Holden T Maecker, Cross-Platform Comparison of Highly Sensitive Immunoassays for Inflammatory Markers in a COVID-19 Cohort, The Journal of Immunology, Volume 212, Issue 7, April 2024, Pages 1244–1253,
- Cui M, Cheng C, Zhang L. High-throughput proteomics: a methodological mini-review. Lab Invest. 2022 Nov;102(11):1170-1181. doi: 10.1038/s41374-022-00830-7. Epub 2022 Aug 3. PMID: 35922478; PMCID: PMC9362039.
- Multiplex analysis of inflammatory proteins: A comparative study across multiple platforms
- Zetlen HL, Cao KT, Schichlein KD, et al. Comparison of multiplexed protein analysis platforms for the detection of biomarkers in the nasal epithelial lining fluid of healthy subjects. Journal of Immunological Methods. 2023 Jun;517:113473. DOI: 10.1016/j.jim.2023.113473. PMID: 37059295.


