
- Panel Features
- Panels List
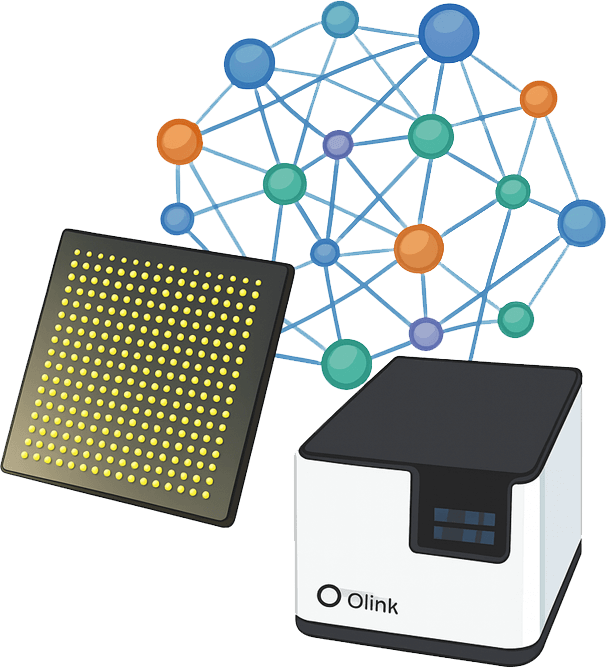
- Workflow
- Demo
- Case
- FAQ
- Why Creative Proteomics
- Sample Requirements
- Sample Submission Pack
What is the Olink Target 96 Oncology II Panel
Customized panel for human
The Olink Target 96 OncologyⅡ Panel measures up to 92 proteins concurrently across 88 samples, using only 1 μL of sample per analysis. This OLINK platform employs a focused proteomics methodology utilizing multiplexed DNA-coupled antibody assays, where each protein is identified by a distinct pair of oligonucleotide-tagged antibodies. Upon binding to their targets, these probes generate a unique DNA sequence quantified via RT-PCR. Following Olink's proprietary quality control and normalization protocols, sequence counts are translated into standardized log2-scaled arbitrary units (NPX), where higher values indicate elevated protein levels. Data underwent normalization and quality adjustments using internal extended and inter-plate controls to minimize intra- and inter-batch variability.
Features of the pane
- Species : Primarily validated for human proteins; cross-reactivity with other species is not guaranteed.
- Proteins : Simultaneously analyze 92 protein biomarkers.
- Sample : Requires only 1µL of plasma, serum & more
- Readout : Data are delivered in normalized protein expression (NPX) units, offering precise insights into relative protein abundance.
- Platform : The panel is designed to run on the Olink Signature Q100 system.
List of 92 human derived biomarkers
Protein category
The Olink Target 96 Oncology II Panel includes 92 proteins categorized into eight main groups: the enzymes (12), Receptors (15), Cytokines/Chemokines (7), Structural/Adhesion (10), Signaling Proteins (12), Immune-Related Proteins (14), Growth Factors/Binding (8), and other functional proteins (14). Each protein was carefully selected by experts in the field and involved in angiogenesis, cell signaling, cell cycle control and inflammation. Each of the low-abundance protein analytes of interest has been evaluated in terms of sample material, specificity, precision, sensitivity, dynamic range, matrix effects, and interference.
Table. List of Olink Target 96 Oncology II panel
| Protein Category | UniProt ID | Gene | Protein Name |
| Enzymes | P16870 | CPE | Carboxypeptidase E |
| P09958 | FURIN | Furin | |
| P50579 | METAP2 | Methionine aminopeptidase 2 | |
| O43895 | XPNPEP2 | Xaa-Pro aminopeptidase 2 | |
| O60911 | CTSV | Cathepsin L2 | |
| Q9P0G3 | KLK14 | Kallikrein-14 | |
| Q9UBX7 | KLK11 | Kallikrein-11 | |
| O60259 | KLK8 | Kallikrein-8 | |
| Q9UKR3 | KLK13 | Kallikrein-13 | |
| P06731 | CEACAM5 | Carcinoembryonic antigen-related cell adhesion molecule 5 | |
| P01298 | PPY | Pancreatic prohormone | |
| P21589 | NT5E | 5'-nucleotidase | |
| Receptors | P04626 | ERBB2 | Receptor tyrosine-protein kinase erbB-2 |
| P21860 | ERBB3 | Receptor tyrosine-protein kinase erbB-3 | |
| P29317 | EPHA2 | Ephrin type-A receptor 2 | |
| P08069 | IGF1R | Insulin-like growth factor 1 receptor | |
| P35968 | KDR | Vascular endothelial growth factor receptor 2 | |
| P35916 | FLT4 | Vascular endothelial growth factor receptor 3 | |
| P15260 | IFNGR1 | Interferon gamma receptor 1 | |
| P15328 | FOLR1 | Folate receptor alpha | |
| P41439 | FOLR3 | Folate receptor gamma | |
| P43489 | TNFRSF4 | Tumor necrosis factor receptor superfamily member 4 | |
| O95407 | TNFRSF6B | Tumor necrosis factor receptor superfamily member 6B | |
| Q15303 | ERBB4 | Receptor tyrosine-protein kinase erbB-4 | |
| O15455 | TLR3 | Toll-like receptor 3 | |
| Q9NS68 | TNFRSF19 | Tumor necrosis factor receptor superfamily member 19 | |
| P37173 | TGFBR2 | TGF-beta receptor type-2 | |
| Cytokines/Chemokines | P15692 | VEGFA | Vascular endothelial growth factor A |
| P01133 | EGF | Pro-epidermal growth factor | |
| P01135 | TGFA | Protransforming growth factor alpha | |
| P14210 | HGF | Hepatocyte growth factor | |
| O43927 | CXCL13 | C-X-C motif chemokine 13 | |
| Q6UXB2 | CXCL17 | C-X-C motif chemokine 17 | |
| O75888 | TNFSF13 | Tumor necrosis factor ligand superfamily member 13 | |
| Structural/Adhesion | P18084 | ITGB5 | Integrin beta-5 |
| P06756 | ITGAV | Integrin alpha-V | |
| P13688 | CEACAM1 | Carcinoembryonic antigen-related cell adhesion molecule 1 | |
| Q96NY8 | NECTIN4 | Nectin-4 | |
| P09382 | LGALS1 | Galectin-1 | |
| P18827 | SDC1 | Syndecan-1 | |
| O00592 | PODXL | Podocalyxin | |
| P08670 | VIM | Vimentin | |
| P35052 | GPC1 | Glypican-1 | |
| Q8WXI7 | MUC16 | Mucin-16 | |
| Signaling Proteins | P38936 | CDKN1A | Cyclin-dependent kinase inhibitor 1 |
| P07949 | RET | Proto-oncogene tyrosine-protein kinase receptor Ret | |
| P07948 | LYN | Tyrosine-protein kinase Lyn | |
| P00519 | ABL1 | Tyrosine-protein kinase ABL1 | |
| P56279 | TCL1A | T-cell leukemia/lymphoma protein 1A | |
| Q13158 | FADD | FAS-associated death domain protein | |
| Q99717 | SMAD5 | Mothers against decapentaplegic homolog 5 | |
| Q9BXY4 | RSPO3 | R-spondin-3 | |
| Q9Y5W5 | WIF1 | Wnt inhibitory factor 1 | |
| O00622 | CCN1 | CCN family member 1 | |
| O95388 | CCN4 | CCN family member 4 | |
| P21741 | MDK | Midkine | |
| Immune-Related Proteins | P26842 | CD27 | CD27 antigen |
| P09326 | CD48 | CD48 antigen | |
| P32970 | CD70 | CD70 antigen | |
| O95971 | CD160 | CD160 antigen | |
| Q9HBG7 | LY9 | T-lymphocyte surface antigen Ly-9 | |
| P20718 | GZMH | Granzyme H | |
| P10144 | GZMB | Granzyme B | |
| P48023 | FASLG | Tumor necrosis factor ligand superfamily member 6 | |
| P50591 | TNFSF10 | Tumor necrosis factor ligand superfamily member 10 | |
| Q6BAA4 | FCRLB | Fc receptor-like B | |
| Q9UJ71 | CD207 | C-type lectin domain family 4 member K | |
| Q9NQ30 | ESM1 | Endothelial cell-specific molecule 1 | |
| Q29983_Q29980 | MICA_MICB | MHC class I polypeptide-related sequence A/B | |
| O75144 | ICOSLG | ICOS ligand | |
| Growth Factors/Binding | P21583 | KITLG | Kit ligand |
| P15514 | AREG | Amphiregulin | |
| Q14512 | FGFBP1 | Fibroblast growth factor-binding protein 1 | |
| P09486 | SPARC | SPARC | |
| Q16790 | CA9 | Carbonic anhydrase 9 | |
| Q16674 | MIA | Melanoma-derived growth regulatory protein | |
| Q14956 | GPNMB | Transmembrane glycoprotein NMB | |
| Q14508 | WFDC2 | WAP four-disulfide core domain protein 2 | |
| Other Functional Proteins | P26447 | S100A4 | Protein S100-A4 |
| P31949 | S100A11 | Protein S100-A11 | |
| P04083 | ANXA1 | Annexin A1 | |
| Q9BYH1 | SEZ6L | Seizure 6-like protein | |
| O14828 | SCAMP3 | Secretory carrier-associated membrane protein 3 | |
| P40222 | TXLNA | Alpha-taxilin | |
| Q9UBG3 | CRNN | Cornulin | |
| O95274 | LYPD3 | Ly6/PLAUR domain-containing protein 3 | |
| P78325 | ADAM8 | Disintegrin and metalloproteinase domain-containing protein 8 | |
| Q8TE58 | ADAMTS15 | A disintegrin and metalloproteinase with thrombospondin motifs 15 | |
| O00548 | DLL1 | Delta-like protein 1 | |
| P48307 | TFPI2 | Tissue factor pathway inhibitor 2 | |
| P05231 | IL6 | Interleukin-6 | |
| Q13421 | MSLN | Mesothelin |
Protein Functions
Biological process
Primarily associated with cancer,imuune, matabolic,carsiovascular, and infection.

Disease area
Primarily associated with immune systerm diseases, signal transduction,

Workflow of Olink Proteomics

Demo Results of Olink Data
(Figures come from Ding, R., et al. 2024)

The bar chart displayed the number of proteins.

Volcano plots of differentially expressed proteins.

Heatmap of differentially expressed proteins.
Case Study

Olink Profiling of Intestinal Tissue Identifies Novel Biomarkers ForColorectal Cancer
Journal: Journal of proteome research
Year: 2025
- Background
- Results
Colorectal cancer (CRC) ranks as the third most common cancer and the second leading cause of cancer-related deaths globally. Its development involves cumulative metabolic and immune-related alterations driven by various risk factors, which transform normal mucosa into malignant tissue. Understanding these changes in both normal mucosa and cancerous tissue is critical to unraveling the complex mechanisms underlying CRC pathogenesis and identifying potential therapeutic targets.
Using Olink analysis, we compared the expression levels of 92 tumour-related proteins in primary tumour tissues (CT), adjacent tissues (PT), and distal normal mucosa (NT) in 52 patients with CRC. Figure 1A shows a heat map of the abundance of the overall expression levels of these proteins in the three groups. The proteomic profile of NT is similar to that of PT, but it is significantly different from CT. In addition, PCA showed a significant difference between CT and NT (Figure 1B). A total of 67 oncology-relevant DEPs were identified by CT, PT, and NT. Figure 1C shows the number of oncology-related DEPs between each of the two groups. A total of 68 DEPs were detected between CT and NT groups, 54 DEPs were detected between CT and PT groups, and 14 DEPs were detected between PT and NT groups, of which 12 DEPs were shared among the three groups. Notably, 16 DEPs were specific to the comparison between CT and NT, 2 were specific to the comparison between CT and PT, and none were specific to the comparison between PT and NT, as shown in Figure 1D. Advanced Mfuzz analysis revealed the dynamic trend of 92 protein expression profiles between the three groups. Notably, 4 main patterns emerged, indicating that the expression levels of 77.17% of the protein (71/92) gradually increased or decreased as the distance of the test sample from the primary tumour increased (Figure 1E).
 Figure 1. Oncology-associated proteomic alterations observed in CT, PT, and NT. (Chong Xiao, et al. 2025)
FAQs
What is the composition of the Interplate Control (IPC) of Olink Target 96 and how can it be used in data analysis?
The interplate control (IPC) contains two complementary DNA-tag-conjugated antibodies in the panel for each assay, so they are already in close proximity. IPC is included in triplicate on each plate to standardise and compensate for potential sequence deviations and batch/plate-to-plate variations.
Data normalisation for Olink Target 96 and Olink Explore?
To reduce technical differences between plates and studies, Olink recommends randomising the samples and performing intensity normalisation prior to statistical analysis. For randomly sampled items, Olink recommends using the median number of wells as a normalisation factor for intensity normalisation. Intensity normalisation adjusts the data so that the median value is equal for each assay across plates.
Why Creative Proteomics
Advanced Bioinformatics Expertise
We deliver expert bioinformatics support, utilizing advanced tools to analyze complex data, decode metabolic pathways, and generate actionable insights for research goals.
Versatile Research Applications
Our solutions address diverse scientific challenges, enabling disease modeling, translational studies, and biomarker discovery across immunology, oncology, neurology, and infectious diseases.
Streamlined Workflow and Precision
We employ advanced platforms for efficient, high-quality sample analysis, ensuring standardized processes, strict quality control, and consistent, reproducible results.
Exceptional Customer Support
We offer end-to-end support, from experimental design to data interpretation, providing expert guidance and resources to ensure seamless research progress.
Sample Requirements
| Sample Type | Recommended Sample Size | Sample Quality | Pre-treatment and Storage | Sample Transport |
| Plasma/Serum/Body Fluid | 40µL/sample | Protein concentration: 0.5mg/ml ~ 1mg/ml | Transfer to a clean tube, aliquot into EP tubes or 96-well plates, store at -80℃ | Seal with foil, ship with dry ice |
| Tissue | ||||
| Cells | ||||
| Exosomes | ||||
| Other |
References
- Bai, H., Zhu, X., Gao, L., Feng, S., Li, H., Gu, X., Xu, J., Zong, C., Hou, X., Yang, X., Jiang, J., Zhao, Q., Wei, L., Zhang, L., Han, Z., Liu, W., & Qian, J. (2025). ERG mediates the differentiation of hepatic progenitor cells towards immunosuppressive PDGFRα+ cancer-associated fibroblasts during hepatocarcinogenesis. Cell death & disease, 16(1), 26. https://doi.org/10.1038/s41419-024-07270-9
- Xiao, C., Wu, H., Long, J., You, F., & Li, X. (2025). Olink Profiling of Intestinal Tissue Identifies Novel Biomarkers For Colorectal Cancer. Journal of proteome research, 24(2), 599–611. https://doi.org/10.1021/acs.jproteome.4c00728
- Ding, R., Wu, L., Wei, S.,et.al. (2024). Multi-targeted olink proteomics analyses of cerebrospinal fluid from patients with aneurysmal subarachnoid hemorrhage. Proteome science, 22(1), 11. https://doi.org/10.1186/s12953-024-00236-x