
Introduction: The Race for Comprehensive Proteome Profiling
In the past decade, demand for large-scale, high-throughput proteomic profiling has surged across pharmaceutical discovery and translational R&D. Platforms such as Olink (antibody-based PEA) and SomaScan (aptamer-based) now power many major population and biomarker studies.
But when you're planning your next proteomics experiment, the choice between Olink and SomaScan matters deeply. Which platform yields more reliable quantitative data? Which uncovers the biology you care about — signaling proteins, secreted biomarkers, or broader proteome coverage? In this guide, we compare Olink vs SomaScan, focusing on molecular recognition (antibody vs aptamer), quantification precision, and target coverage. Along the way, we reference real-world studies so you understand the trade-offs—not just theory.
By the end, you should be able to decide which approach is best suited for your translational or biomarker-focused projects — and see where complementarity might help.
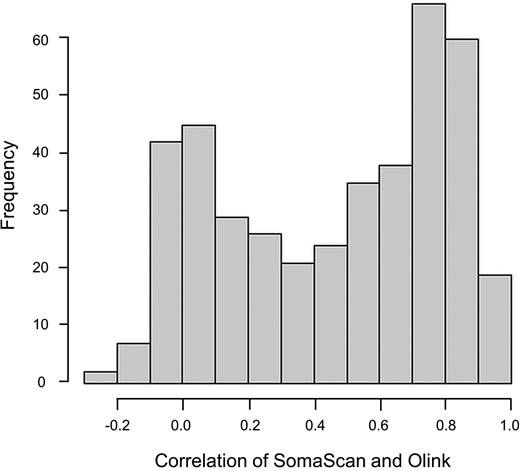 Fig. 1. Histogram of Spearman correlations between the 417 overlapping protein assay comparisons for the Olink and SomaScan platforms with outliers removed.
Technology Foundations: Antibody vs. Aptamer Recognition
In comparing Olink vs SomaScan, the fundamental distinction lies in how each technology recognizes protein molecules. Below I explain both approaches, the biochemical logic behind each, and their strengths / limitations.
Olink's PEA: Dual-Antibody Proximity Extension
Olink's Proximity Extension Assay (PEA) uses pairs of antibodies, each conjugated to short complementary DNA oligonucleotides.
When both antibodies bind the same target protein in solution, the DNA tags are brought into proximity and hybridize. A DNA polymerase then extends one strand using the other as template, forming a unique DNA "barcode."
That DNA barcode is amplified via qPCR (for smaller panels) or next-generation sequencing (NGS) (for high-plex Explore panels).
Because signal is only generated when both antibodies bind and their DNA tags hybridize, the method achieves very low background and high specificity.
This dual-recognition design effectively suppresses cross-reactivity: mismatched antibody binding doesn't produce a valid DNA extension event.
PEA reactions are homogeneous (no solid-phase capture), which helps preserve native protein conformation and reduces washing artifacts.
Strengths of PEA / Olink approach:
- Excellent specificity due to dual-antibody gating
- Low sample consumption (often just 1 µL plasma/serum)
- Scalable multiplexing (from focused panels up to several thousand proteins)
- Quantitative readout (via DNA amplification) allowing precise relative quantification
Potential limitations / challenges:
- Antibody availability / validation: not every protein has well-behaved antibody pairs
- Epitope constraints: both antibodies must bind non-overlapping epitopes accessible in native conformation
- Highly multiplexed assays may require careful optimization to avoid probe interference
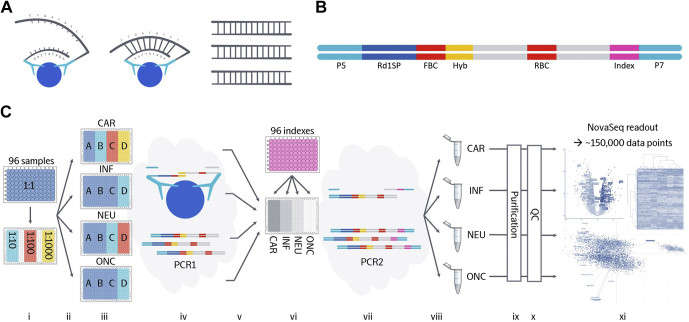 Fig. 2. Schematic overview of Olink Explore.
SomaScan: Aptamer-Based Detection with SOMAmers
SomaScan uses SOMAmer® reagents (Slow Off-Rate Modified Aptamers) — synthetic single-stranded DNA (or RNA) molecules engineered to bind proteins with strong affinity and specificity.
SOMAmers are selected via iterative SELEX (Systematic Evolution of Ligands by Exponential Enrichment) under conditions that favour slow dissociation rates (low off-rate), which helps maintain binding through washing steps.
Each SOMAmer is chemically modified (e.g. with modified nucleotides) to improve binding affinity, stability, and reduce cross-binding.
In the assay, a pool of SOMAmers binds the protein targets in solution. Unbound or weakly bound aptamers are washed off, and the bound ones are isolated and read out by hybridisation to complementary DNA microarray or sequencing formats.
Because the readout is nucleic acid–based, SomaScan converts protein abundance into DNA signal strength, analogous to how PEA does but via aptamer binding rather than antibody pairing.
Strengths of the aptamer approach:
- High throughput: current versions measure tens of thousands of proteins (e.g. the 11K version measures ~10,776 proteins)
- Broad dynamic range: SOMAmers are partitioned into dilution groups to cover low to high abundance proteins (femto to micromolar)
- Aptamers are synthetically manufactured, offering lot-to-lot consistency and ease of modification
- No need for antibody development, which may reduce timelines in some cases
Challenges or caveats:
- Cross-reactivity / non-specific binding risk: despite selection, aptamers may bind off-target proteins, especially in high-plex settings
- Normalization complexity: the raw DNA signals require careful normalization and QC pipelines to correct for biases (e.g. hybridisation effects)
- Some proteins (especially those with low or transient abundance) may have weaker aptamer binding and reduced sensitivity
Head-to-Head Biochemical Comparison
| Feature | Antibody (Olink / PEA) | Aptamer (SomaScan) |
| Recognition mode | Two independent antibodies binding distinct epitopes | Single nucleic acid ligand (SOMAmer) |
| Signal gating | Requires dual binding → DNA extension | Single binding with washing and DNA readout |
| Specificity control | High – mispaired antibody binding yields no signal | Medium to high – depends on aptamer specificity and stringency |
| Multiplex capability | High (with DNA barcoding) | Very high (large aptamer pools) |
| Normalization | Relatively straightforward NPX pipelines | Requires complex normalization (dilution bins, hybridisation correction) |
| Stability & manufacturing | Antibodies require expression, purification, validation | Aptamers are chemically synthesizable, scalable |
| Suitability for de novo targets | Needs validated antibodies | Potentially faster for novel targets (if aptamers can be selected) |
Sensitivity and Dynamic Range: Detecting Low-Abundance Proteins
One of the most critical performance metrics when comparing Olink vs SomaScan is how well each platform detects proteins present at very low concentrations, and how broadly it spans concentration levels across the proteome. In practical biomarker or translational studies, many promising proteins lie near the limits of detection, so sensitivity and dynamic range matter a great deal.
SomaScan's Dynamic-Range Strategy
SomaScan uses a serial dilution scheme to extend its measurable range. Samples are partitioned into multiple dilutions so that both low-abundance and high-abundance proteins can be quantified.
According to manufacturer documentation, the platform achieves an approximate 10-log dynamic range (femtomolar to micromolar) across its full SOMAmer repertoire in human plasma/serum.
This wide dynamic range helps the platform avoid sample pre-treatment or depletion steps, which can introduce bias or loss of molecules.
In benchmarking studies, SomaScan has shown strong data completeness: for instance, in a 78-sample plasma benchmarking experiment, it detected ~9,645 proteins with ~96.2% of analytes present above detection threshold (i.e. in all samples).
Limitations to note:
- Even with wide dynamic range, binding affinity and specificity of individual SOMAmers can limit sensitivity for very low-concentration targets, especially if binding kinetics are less favorable.
- As multiplexing increases, competition or cross-reactivity effects may manifest more strongly in the extremes of the range.
Olink's Sensitivity Achievements and Constraints
- Olink's PEA technology is built to detect low-abundance proteins by translating proximity binding events into DNA signals, which can be amplified.
- In practice, Olink panels often achieve detection of cytokines, chemokines, and signaling molecules at picomolar to sub-picomolar levels (depending on panel and protein).
- However, high multiplexing tends to introduce variability: as panel size increases, the effective sensitivity and precision for the lower-end analytes can degrade.
- In recent comparisons, the newest Olink Explore HT panels exhibited median coefficient of variation (CV) around 35.7% across assays in duplicate measurements, which is substantially higher variability than earlier versions or competing methods.
- Interestingly, Olink's precision is inversely correlated with protein detectability: proteins detected in a smaller fraction of samples tend to show worse reproducibility (higher CV).
Head-to-Head Observations in Cohort Studies
In the ARIC Study (n ≈ 427 participants), comparisons between SomaScan v4 and Olink Proseek™ v5003 revealed an average Spearman correlation r = 0.46 across 417 protein comparisons (range from –0.21 to 0.97). Only ~19% (79 proteins) achieved r ≥ 0.8.
In a more recent study of 102 plasma samples measured by SomaScan 11k vs Olink Explore HT, SomaScan gave a median CV of ~6.8%, while Olink assays showed median CV near 35.7% for duplicate measurements.
For the 4,443 overlapping proteins (in that same study), cross-platform correlations were bimodal, with peaks near r ≈ 0 and near r ≈ 0.8. Only ~10% of proteins showed cross-platform correlation ≥ 0.8.
A large population comparison of 3,976 Chinese adults measuring 2,168 proteins by both Olink and SomaScan reported that higher-abundance proteins were more consistently measured by both platforms; lower-abundance ones less so.
These findings underscore that, in practice, sensitivity is not uniform across all proteins; each platform will perform better on some proteins than others.
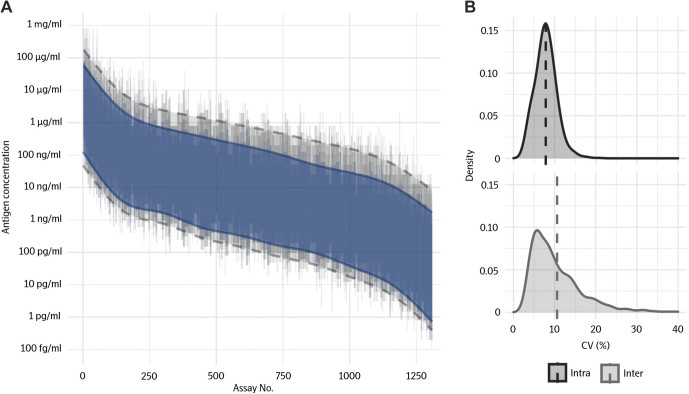 Fig. 3. Validation of range and precision for Olink Explore assays.
Practical Implications for Researchers
- If your research focuses on very low-abundance biomarkers (e.g. cytokines, hormone fragments) in plasma or serum, Olink may offer stronger sensitivity in restricted panels, but at high multiplex capacity this benefit might weaken.
- If you aim to maximize proteome breadth and capture a wide dynamic concentration range, SomaScan's serial dilution approach gives it a significant edge in overall coverage and detection completeness.
- However, broad coverage doesn't ensure per-protein accuracy—some low-abundance targets may still fall below robust detection thresholds even on SomaScan.
- In cohort studies or cross-platform meta-analyses, always check per-protein detectability and reproducibility metrics (e.g. percent of samples above LOD, CV) before drawing conclusions or performing downstream statistics.
Target Coverage and Biological Relevance
When comparing Olink vs SomaScan, one of the most tangible differentiators is which proteins each platform can (and does) measure — and how that selection aligns with biological insight. Below, I break down the coverage scope of each, discuss which types of proteins tend to be included or excluded, and highlight real-world examples where coverage choice matters.
Olink's Coverage: Focused, Validated, and Biologically Meaningful
Olink's Explore HT platform currently covers ≈ 5,400+ proteins using PEA chemistry and NGS readout.
The predecessor Explore 3072 panel targets ~2,900+ proteins (organized into 8 modular "Explore 384" panels) across functional domains such as immune, neurology, metabolism, and oncology.
Olink deliberately curates its panels to emphasize actionable, druggable, circulating, or secreted proteins rather than blanket proteome coverage.
In its marketing and technical documentation, Olink claims ~99.5% specificity (i.e., low spurious cross-reactivity) and "coverage of top-level pathways" (i.e., nearly all high-level biological pathways have at least some protein measured) in its Explore HT design.
In comparative work, when Olink and in-depth MS (mass spectrometry) were aligned, Olink often measured more low-abundance signaling proteins (e.g. cytokines) than MS, while MS better captured abundant plasma proteins.
Importantly, in cases where Olink and SomaScan diverged in measured levels, Olink's results sometimes correlated more closely with MS data than did SomaScan's, suggesting Olink's targeted set retains strong biological fidelity.
Implication: Olink's design favors high-confidence measurement of biologically prioritized proteins, even at the cost of omitting highly abundant or "housekeeping" proteins not deemed central to biomarker discovery.
SomaScan's Coverage: Breadth Designed for Discovery
The SomaScan 11K (v5.0) assay is reported to measure ~10,776 human proteins, covering many key molecular functions (e.g. receptors, kinases, growth factors) and spanning secreted, intracellular, and extracellular domains.
Earlier versions (e.g. SomaScan 7K, ~7,000+ proteins) have also been widely used; in technical evaluations, many of the 7K assays showed high reproducibility and consistency across plates.
SomaScan uses dilution bins in measurement (grouping SOMAmer probes into low-, mid-, and high-abundance ranges) to broaden dynamic coverage without saturating signals.
Independent assessments suggest that the platform achieves very high data completeness — up to ~96.2% of analytes above detection threshold in healthy plasma (for 11K version).
Some recent variability studies (e.g. comparing 7K and 11K technical replicates) have called attention to modest increases in assay noise in the highest-plex versions, but overall, SomaScan retains broad coverage with acceptable reproducibility across many proteins.
Implication: SomaScan's broad coverage is ideal for hypothesis-free, discovery proteomics — enabling detection of many proteins that might otherwise not be measured at all in a more targeted panel.
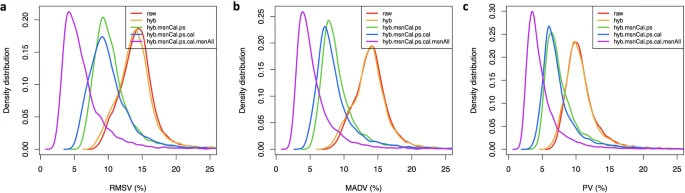 Fig. 4. Assessment of SOMAmer variability.
Overlap, Gaps, and Biological Biases
The overlap between Olink and SomaScan is modest: although they share many proteins, in practice correlation is variable. In studies, only a subset of overlapping proteins reach high cross-platform concordance (e.g., r ≥ 0.8).
Proteins detected widely on one platform but poorly (or not at all) on another often tend to be those of extreme abundance (very high or very low) or those with structural complexity or post-translational modifications that compromise binding characteristics.
In plasma proteomic benchmarking (e.g. "Plasma proteomic comparisons change as coverage expands"), proteins with lower detectability on Olink showed weaker correlation with SomaScan; conversely, proteins robust on Olink (many above LOD across samples) tended to correlate better.
Some of the measured differences reflect biological pathway bias: Olink's panels are enriched for signaling, immune, and biomarker-relevant proteins, while SomaScan includes more metabolic, structural, or less-studied proteins. Thus, discoveries may diverge based on platform design philosophy.
Because Olink has more stringent quality control per assay, some weak-binding proteins or proteins lacking validated antibody pairs will simply not be included, whereas SomaScan might attempt measurement even when binding is marginal.
Case Examples Highlighting Coverage Impacts
In a recent comparative proteomic profiling in adults with single-ventricle Fontan circulation, cross-platform comparisons showed divergence in certain functional protein classes. The authors noted that measurement discrepancies often fell into categories of proteins with lower detectability or platform-specific assay designs.
In the comparative evaluation of Olink Explore 3072 vs MS, Sissala et al. (2025) found that Olink better captured low-abundance signaling proteins, while MS had stronger representation of core plasma proteins like complement, hemostasis, and coagulation. Notably, in many instances where SomaScan and Olink disagreed, Olink aligned better with MS than SomaScan did.
Take-Home Insights for Translational Researchers
If your study revolves around known biomarker candidates (e.g. cytokines, receptor ligands, signaling proteins), Olink's curated panels will likely capture them with high confidence.
If your research goal is discovery (finding novel protein associations without preconceived targets), SomaScan's greater breadth gives you more "wiggle room" to detect previously unmeasured proteins.
In comparative or cross-cohort analyses, always inspect which proteins are well measured on both platforms and whether inconsistent proteins lie near the detection limits.
A hybrid or orthogonal approach (e.g. validating SomaScan-discovered proteins using Olink panels or mass spectrometry) often yields the best balance of breadth and quantification fidelity.
Quantification Precision and Reproducibility
Ensuring reliable, reproducible measurements is essential in translational proteomics. In this section, we compare how Olink and SomaScan perform in terms of precision (intra-/inter-assay variation) and reproducibility (across batches, sites, time). We also highlight caveats and best practices for users.
Olink: Precision Characteristics and Across-Study Reproducibility
Intra- and Inter-Assay Precision (Within Plate, Between Runs)
In validation of the Olink Metabolism panel (91 analytes), the average intra-assay CV (within-run replicates) was ~ 6.6%, and the inter-assay CV (same samples across runs) was ~ 10.9% in linear scale.
In the Olink "white paper," the company claims that for their Target panels, intra-plate CVs are typically below 10%, and inter-plate (between-run) CVs below 20% under controlled conditions.
In the Clinical Proteomics study on temporal reproducibility (92-plex Olink I-O panel), the authors used bridging samples spanning ~2.5 years; intra-study inter-assay CV ranged from 11.3% to 26.1%, while inter-study CV (before normalization) reached ~42%, but was reduced to ~26.2% after normalization (bridging adjustments).
In the Frontiers Neurology technical performance evaluation, Olink PEA assays were judged "technically robust," with most assay variation attributable to biological differences rather than technical noise.
Reproducibility Across Time, Sites, Versions
Because Olink uses Normalized Protein eXpression (NPX) values, bridging samples or reference controls are often needed to harmonize measurements across plates, versions, or labs. In the tinkering across versions of the same panel, results were well correlated (r ≥ 0.93), especially when bridge samples were used.
In serum vs EDTA plasma comparisons for 80 evaluable proteins, the ratio of measured values ranged widely (0.41 to 3.01), and for ~36 proteins the ratios were not stable. Thus, reproducibility across sample matrices must be carefully validated.
In multi-plate, multi-year projects, careful normalization and consistent QC practices are essential to maintain reproducibility.
SomaScan: Precision Benchmarks and Cross-Site Reproducibility
Intra-/Inter-Assay Precision
In the technical note "Evaluation of SomaScan Data Reproducibility at Various Sites," SomaScan reports a median total CV (across sites) below ~5%, indicating low technical noise in well-controlled hands. ~82% of analytes had inter-site correlation ≥ 0.8, and 97% had correlation > 0.5.
In the recent paper "Variability of 7K and 11K SomaScan Plasma Proteomics Assays", the authors expanded technical replicates in both 7K and 11K versions. The 11K version showed robust performance, with CVs typically in acceptable ranges. (Exact medians depend on analyte subsets)
The authors note that the addition of assays from 7K to 11K did not meaningfully compromise precision, indicating that scaling up multiplexity has been carefully engineered.
In the assessment of the 7K assay (in Scientific Reports), the authors analyzed replicate samples to quantify technical variation, and noted that for very low-abundance signals, the effective dynamic range may shrink, because low-level signals approach background noise.
Cross-Site / Cross-Lab Reproducibility
The SomaLogic technical note reports that across two laboratories using the same samples, the assay replicates were highly concordant, validating the ability to deploy SomaScan in multiple geographic sites with consistent performance.
SomaScan's QC pipeline and normalization strategy (including hybridization correction, calibration controls, and batch adjustments) are designed to support cross-site harmonization.
Head-to-Head Observations and Considerations
In some comparative analyses, SomaScan is claimed to have lower CVs (i.e. better precision) than high-plex antibody assays. In marketing materials, SomaLogic cites a median CV of 6.8% for their 11K assay versus ~35.7% for a competing high-plex antibody platform (presumably Olink Explore) in one technical comparison.
However, such claims should be interpreted cautiously: performance depends heavily on the specific subset of proteins, sample types, assay versions, and normalization strategies.
For proteins measured near the limit of detection, both platforms may exhibit higher CVs—i.e., precision tends to degrade as signal approaches noise.
Because Olink's NPX is relative quantification, comparisons across plates or studies require bridging or internal controls; ignoring this may artificially inflate apparent variability.
Practical Tips to Optimize Precision in Your Experiments
Include technical replicates and bridging samples
Replicates across plates and "bridge samples" (same sample run in multiple batches) help to detect and adjust for batch effects.
Filter by detectability and CV thresholds
Exclude proteins with high CV or those that fail QC in many samples — unless validated by orthogonal methods.
Avoid matrix mismatches
Do not mix plasma types (e.g. EDTA vs heparin vs serum) without validating inter-matrix reproducibility.
Use consistent lab protocols and operators
Operator variation, sample handling, storage—and freeze/thaw cycles—can all inflate noise if not controlled.
Normalize with care
Leverage NPX normalization (for Olink) or hybridization/batch correction (for SomaScan) carefully. Poor normalization causes systematic drift.
Interpret low-signal proteins cautiously
For proteins near the lower detection limit, expect higher measurement uncertainty; consider validating these with targeted assays (e.g. ELISA, MS).
Data Integration and Downstream Analysis
Beyond raw quantification, the real value of proteomics lies in the ability to integrate data into biological models, correlate with other omics layers, and drive hypothesis generation. In this section, I compare how Olink and SomaScan accommodate downstream integration, and offer best practices for translational researchers.
Olink: NPX, QC, and Integration Workflows
Olink reports normalized protein abundances as NPX (Normalized Protein eXpression) values, which are on a log2 scale and internally adjusted for plate and extension/detection controls.
The Olink Analyze R package supports importing NPX data, QC visualizations (e.g. distribution plots, outlier detection), and statistical tests (e.g. t-tests, mixed models).
When combining multiple NPX datasets (e.g. separate batches, different panel versions), bridge normalization (also called overlapping reference normalization) is required. It aligns datasets using shared samples (bridge samples) to compute assay-specific adjustment factors.
The UK Biobank proteomics pipeline includes metadata fields (batch number, lot, limit-of-detection per plate) to allow QC filtering and batch correction.
For integration with other omics (transcriptomics, metabolomics), NPX's log2 scale and relative quantification make it compatible with standard multi-omics pipelines (e.g. correlation networks, principal component analysis). Tools such as Omics Playground already support Olink NPX for downstream analyses.
Strengths & considerations:
- NPX format is relatively simple to merge with clinical/omics metadata without extreme transformation.
- Bridge normalization is effective if sufficient overlapping samples are present; without overlaps, cross-dataset harmonization is risky.
- Because NPX is relative, comparisons across very different study populations must consider batch and normalization effects.
- QC flags in Olink output (e.g. "QC Warning," samples failing control criteria) must be heeded to prevent spurious correlations.
SomaScan: Normalization, QC, and Data Integration
The SomaScan assay implements a multi-step normalization pipeline (often five sequential normalization steps) to reduce array, hybridization, plate, and sample variabilities.
- Hybridization Control Normalization: corrects array readout variation using control SOMAmers.
- Intraplate Median Signal Normalization: adjusts within-plate signal differences across samples.
- Plate Scaling / Calibration: aligns total signal across plates and assay runs.
- Adaptive Normalization (ANML): iterative median fold change normalization referenced to a control set, to reduce sample-to-sample technical noise without distorting biological signals.
- Final Quality Control Checks: replicate QC samples, calibrators, blanks, and flagging of outlier assays.
The SomaScan Bioinformatics chapter (Methods in Molecular Biology) is a go-to reference for normalization, QC, and evaluating pre-analytical variation.
SomaScan v4/v4.1 data standardization documents detail how systematic biases (pipetting, hybridization, scanner variation) are removed.
In its reproducibility technical note, SomaLogic reports high inter-site concordance when the pipeline is strictly followed, enabling multi-lab data integration.
Strengths & challenges:
- The normalization pipeline is robust and designed to adjust for many layers of technical variation, enabling cleaner downstream association analysis.
- However, complex normalization introduces risk of overfitting or removing subtle biological signals if not carefully monitored.
- Because the final output is also relative, cross-study harmonization still requires caution, especially if different versions or calibration standards are used.
Multi-Omics Integration: Strategies and Cautions
Many translational projects combine proteomics with transcriptomics, metabolomics, or epigenomics. Standard techniques for integration include correlation networks, canonical correlation analysis (CCA), partial least squares (PLS), and more recently deep learning / variational autoencoders.
A key challenge is heterogeneous scaling and missingness: proteomic data often has missing values (below detection), which must be handled (e.g. via imputation or filtering) before integration.
Batch effects in proteomics layers may dominate biological signals unless aggressively corrected — always include batch covariates or bridge normalization.
Use joint embedding or dimension-reduction approaches (e.g. MOFA, DIABLO, multiview canonical correlation) to find latent axes shared across omics layers while preserving modality-specific variation.
Be cautious about overinterpreting small fold-changes in proteins with high CV or low detectability — always cross-check with QC metrics and orthogonal validation (e.g. targeted MS, immunoassays).
Visualizations (heatmaps, network plots, circos plots) should cluster samples/variables in a way consistent with metadata (e.g. treatment groups, timepoints) to highlight biologically meaningful patterns.
Best Practices for Researchers Doing Integration
- Filter early — remove proteins with poor QC or high missingness before integration.
- Use bridging or reference normalization — to harmonize datasets run at different times or on different panels.
- Include technical covariates — batch ID, run date, plate, operator, etc. in regression models.
- Retain metadata alignment — ensure consistent sample IDs, timepoints, and matching across omics types.
- Validate key findings orthogonally — use targeted methods to confirm top candidate proteins.
- Document all normalization steps — for reproducibility and transparency in publications or CRO proposals.
- Prefer integrative frameworks — e.g. MOFA, DIABLO, multiview methods, rather than naive concatenation of features.
Practical Scenarios: Choosing the Right Platform for Your Study
Below are realistic experimental contexts in translational research. For each, I compare how Olink vs SomaScan typically perform, and what factors you should weigh when choosing.
Scenario A: Targeted Biomarker Validation in a Clinical Trial Cohort
Context: You already have a candidate biomarker (e.g. cytokine, growth factor) from prior discovery or literature. You plan to quantify this biomarker (and perhaps several others) across 200 patient samples to test correlation with treatment response.
What to prefer: Olink
- Because Olink panels (Target, Focus, Explore subsets) include well-validated antibody pairs for many known biomarkers, they often yield higher specificity and lower background noise.
- NPX normalization and robust QC pipelines make it easier to integrate clinical covariates and perform regression or longitudinal modeling.
- The smaller panel cost is lower, and data handling is simpler.
- Caveat: If your biomarker is not yet included on Olink panels, you may need to custom-validate or consider orthogonal methods.
Best practice: Use bridging controls and technical replicates across plates to adjust for plate-to-plate variation. Filter out proteins with high CV before modeling.
Scenario B: Hypothesis-Free Discovery in a Population Cohort
Context: You have access to biofluid samples (e.g. plasma) from a large cohort (n = 1,000+). You seek to discover novel protein associations with phenotypes (e.g. metabolic traits, aging markers).
What to prefer: SomaScan (or in hybrid mode)
- SomaScan's broader coverage offers greater chance of detecting uncharacterized proteins, potentially generating new leads.
- Its serial dilution and normalization approach tend to provide more complete data across many analytes.
- However, not all proteins will have reliable measurements—so post-hoc filtering is essential.
Best practice: Pre-filter proteins by detectability rate (e.g. >80% non-missing), remove high-CV proteins, and validate top hits via Olink or targeted assays.
Scenario C: Cross-Cohort or Meta-Analysis Across Existing Proteomic Datasets
Context: You wish to integrate or meta-analyze proteomic data from different studies—some measured by Olink, some by SomaScan, perhaps even mass spectrometry.
Considerations:
- Only proteins measured reliably and with good reproducibility on both platforms should be included in meta-analysis.
- Be aware of measurement biases: for example, in UK Biobank vs Icelandic comparisons, the proportion of cis-pQTLs supported by proteomics was higher for Olink than for SomaScan (72% vs 43%) in one study.
- Differences in protein detectability between platforms may bias which proteins are available for cross-study comparison.
- Use bridging normalization, batch correction, and covariate adjustment in your models.
Best practice: Construct an "overlap set" of proteins that pass QC on all platforms. Focus analysis on that set, while treating platform-specific hits as hypothesis-generating.
Scenario D: Biomarker Panel for Low-Abundance Signaling Molecules
Context: You're studying low-abundance cytokines, chemokines, or secreted growth factors in a limited-sample (e.g. < 50 µL) setting.
What to prefer: Olink (targeted panels)
- Olink PEA's dual-antibody gating plus signal amplification often yield better sensitivity for low-level proteins (especially in smaller panels).
- Many signaling protein panels exist on Olink already, with well-validated assays.
- In high-plex modes, sensitivity for very low-abundance proteins may suffer; always check per-protein detectability and CV metrics.
Best practice: Reserve the lowest-variance, highest-confidence proteins for analysis. Impute missing low-end values carefully (e.g. using half LOD), and validate key proteins using orthogonal methods.
Scenario E: Dealing with Pre-Analytical Variation (Hemolysis, Freeze-Thaw, Matrix Effects)
Context: Your samples may have undergone variable handling, freeze-thaw cycles, or hemolysis risk (e.g. from field collection).
Considerations:
- A recent study examined the effects of in vitro hemolysis and repeated freeze-thaw cycles on protein quantification by SomaScan and Olink (SomaScan 11K, Olink Explore 1472 subset). The authors observed that both platforms show altered abundance measurements under hemolysis or repeated thaw cycles for some proteins.
- Some proteins are more susceptible to pre-analytic damage or degradation; such proteins may lose detectability on one platform but not the other.
- Be especially cautious when interpreting low-abundance signals post freeze-thaw; they may reflect technical artifact rather than biology.
Best practice: Use consistent sample handling protocols, include sample-handling QC samples, and flag proteins with known sensitivity to pre-analytic stress. Exclude or interpret cautiously those proteins in comparative analyses.
Summary Table / Comparison at a Glance
Below is a side-by-side comparison of Olink (PEA / antibody-based) vs SomaScan (aptamer / SOMAmer-based) across key utility axes. Use this as a rapid reference when designing your proteomics strategy.
| Feature | Olink (PEA / Antibody-based) | SomaScan (Aptamer / SOMAmer-based) |
| Recognition Chemistry | Dual antibody binding, DNA barcode extension | Single aptamer (SOMAmer) binding with signal readout via DNA hybridization |
| Typical Panel / Coverage | Explore HT ~5,400+ validated proteins (99.5% specificity) Explore 3072 covers ~3,000+ proteins |
SomaScan 11K ~11,000 proteins, broad proteome coverage |
| Dynamic Range / Sensitivity | Claims ~10-log dynamic range (fg–mg/mL) at optimal panels | Designed with serial dilution and aptamer pooling to cover wide dynamic range (fM to μM) |
| Precision / Reproducibility (CVs) | Earlier Olink panels: intra-/inter-assay CVs often <10–20% in optimal setups. In split-sample comparison: Olink Explore HT median CV ~35.7% (vs SomaScan ~6.8%) |
Independent study: SomaScan 11K median CV ~5.3%, 7K ~5.8% (<6%) SomaLogic notes ~5% median CV across versions |
| Data Completeness / Detectability | In some benchmarking, Olink panels show lower % of analytes above detection thresholds (e.g. 35.9% in one test) | High completeness: e.g. 96.2% of analytes above LOD in SomaScan 11K study |
| Specificity & Cross-Reactivity Control | Dual-antibody gating suppresses off-target signal; high assay validation required | SOMAmer design includes counter-selection steps, but cross-reactivity risk in high-plex settings still possible (some reagents bind homologous proteins) |
| Normalization & Data Integration | NPX values (log2 scale) with bridging/overlap normalization for cross-batch consistency | Multi-step normalization (hybridization control, intraplate median, plate scaling, adaptive normalization) to correct technical biases |
| Best Use Cases | Targeted biomarker panels, signaling / cytokine profiling, smaller-scale studies needing high specificity | Discovery proteomics, large-cohort exploratory profiling, capturing novel or under-characterized proteins |
| Caveats / Risks | Sensitivity and precision may degrade in very high-plex setups; missing assays for proteins without good antibody pairs | Some measured proteins may have weaker binding or higher variability; normalization may mask subtle biology |
| Hybrid Strategy Potential | Use Olink to validate top hits from broader screens | Use SomaScan to discover candidates, then validate with Olink or targeted assays |
Conclusion & Recommendations
When choosing between Olink vs SomaScan for your proteomics study, there's no universal "best"— rather, the optimal platform depends on your scientific goals, project scale, and validation plans. Below I synthesize the key takeaways and suggest how to proceed with confidence.
Key Takeaways: Strengths, Trade-offs, and Recommendations
Recognition modality drives differences
Olink's dual-antibody PEA approach generally ensures high specificity and low background noise, while SomaScan's SOMAmer aptamers support very broad target breadth and dynamic range. The choice of "antibody vs aptamer proteomics" fundamentally shapes which proteins are reliably measured.
Sensitivity vs breadth trade-off
Olink tends to excel in measuring low-abundance signaling proteins in focused panels, with strong quantification precision when assays are well validated. SomaScan shines at large-scale discovery, offering broad proteome coverage and high data completeness across many analytes.
Precision and variability vary with version and multiplex level
In a recent head-to-head comparison using Olink Explore HT and SomaScan 11K, SomaScan achieved a median CV of ~6.8% and median inter-sample correlation ~0.85, whereas Olink's 5,420 assays exhibited median CV ~35.7% and correlation ~0.65. (Rooney et al., 2025).
That said, Olink's precision improves when filtering out proteins below detection thresholds or applying proper bridging normalization.
Cross-platform concordance is protein-dependent
In the Atherosclerosis Risk in Communities (ARIC) cohort, ~19% of proteins measured by both platforms achieved cross‐platform correlation r ≥ 0.8; overall average correlation across ~417 proteins was ~0.46. (Rooney et al., 2023).
Thus, cross‐study comparability should focus on the subset of proteins with robust reproducibility across platforms.
Pre-analytical handling matters
Both platforms show sensitivity to sample handling, storage time, and freeze/thaw cycles. In epidemiological settings, Olink and SomaScan showed differing stability for subsets of proteins, with overall good reproducibility but high variability in some assays (e.g. only ~55% of Olink and ~44% of SOMAscan assays had ICC or r ≥ 0.75 under delayed processing).
Rigorous sample protocols and QC controls are essential regardless of platform.
Strategic Recommendations for Your Projects
Define your primary goal up front
- If you are validating known biomarkers in a moderate-sized cohort, Olink's targeted panels often deliver cleaner results.
- If your aim is hypothesis generation in a large population context, SomaScan's broad coverage is advantageous.
Use a hybrid or orthogonal strategy when possible
A discovery run using SomaScan followed by targeted validation via Olink (or even mass spectrometry) leverages the strengths of both. It ensures breadth and then confirmation with higher confidence.
Filter and QC rigorously
Always filter out proteins with high CV, low detectability, or failing QC flags. Use bridging samples and normalization strategies (NPX bridge for Olink, hybridization / adaptive normalization for SomaScan).
Limit downstream analyses to overlapping, high-quality proteins for cross-platform comparisons.
Design with reproducibility in mind
Include technical replicates, process controls, and sample randomization. Document and report normalization steps transparently.
Interpret low-abundance proteins cautiously
Proteins near the limit of detection inherently carry higher uncertainty. Use orthogonal validation for key findings, especially if they will inform follow-on experiments.
Monitor the evolving platforms
Versions change: newer Olink Explore HT panels, SomaScan 11K/12K, or future chemistry refinements may shift performance balances. Stay current with technical papers and benchmarking studies.
Final Thoughts & Next Steps
The comparison Olink vs SomaScan is not merely technical—it shapes what biology you can observe, interpret, and ultimately trust.
- If you need precision, specificity, and ease of downstream integration for biomarker validation, Olink remains a compelling option.
- If your priority is discovery and broad proteomic coverage, SomaScan provides unique reach into the proteome.
- The intersection of their measured proteins often yields the most robust signals for translational insight.
Related Reading: Explore More Olink Comparative Insights
To better understand how Olink performs against other proteomic platforms, we recommend exploring the following related guides:
Olink Cytokine Panel vs Other Detection Methods: Sensitivity, Specificity, and Throughput Compared — our hub article providing an overview of Olink's advantages over ELISA, Luminex, and aptamer-based assays.
Olink vs Luminex: Comparing Multiplex Cytokine Detection Accuracy and Reproducibility — a focused comparison of PEA and bead-based immunoassays used in translational cytokine research.
FAQs — Olink vs SomaScan
Q: Which platform is more sensitive, Olink or SomaScan?
Sensitivity depends on the specific protein and assay design: in one head-to-head comparison, SomaScan applied to shared plasma samples achieved a median coefficient of variation (CV) of ~6.8%, while Olink's Explore HT assays yielded a median CV of ~35.7% (on all assays) and cross-platform concordance varied widely (some proteins reached r ≥ 0.8, many did not) (Rooney et al., 2024). However, for certain low-abundance signaling molecules or cytokines, Olink panels may offer better capture because of antibody specificity and lower background—practical performance will depend on your sample, protein target, and QC filtering.
Q: How many proteins can each platform measure (coverage)?
SomaScan 11K can assay ~10,000+ proteins, offering some of the broadest affinity-based coverage in plasma proteomics. Olink's Explore HT panels currently target 5,000+ proteins with high specificity, and earlier panels such as Explore 3072 cover ~3,000 proteins. Because Olink panels are curated for biologically meaningful or drug-relevant proteins, its coverage is narrower but focused; SomaScan's broader reach enables discovery across more uncharacterized proteins.
Q: Can I directly merge Olink and SomaScan data?
You cannot safely merge raw data from both platforms due to fundamental differences in normalization approaches (Olink's NPX vs SomaScan's multi-step correction), assay biases, and detection limits. Instead, identify the overlapping proteins that pass QC on both platforms, apply bridging or normalization strategies, and restrict meta-analysis to that high-confidence intersection. In large multi-platform studies, only a minority of proteins show high cross-platform correlation (e.g. r > 0.75).
Q: Does sample handling—freezing, delays, hemolysis—affect Olink or SomaScan results?
Yes. Both platforms are sensitive to pre-analytic variation. In a stability study comparing delayed processing and freeze-thaw effects, ~55 % of Olink proteins and ~44 % of SomaScan proteins retained intraclass correlation (ICC) or r ≥ 0.75 after 24–48 h delay; after prolonged storage, >90 % of proteins still showed r ≥ 0.40. Thus, consistent sample handling, inclusion of QC samples, and careful monitoring of proteins known to degrade are critical.
Q: If I have candidate biomarker proteins, which platform is safer for validation?
For targeted validation of known biomarker candidates (e.g. cytokines, growth factors, receptors), Olink's panels often provide more robust specificity and lower background noise, thanks to dual-antibody gating and stringent QC. But this only works if your proteins of interest are included in the panel. If not, a hybrid strategy is recommended: use SomaScan to discover broadly, then validate top hits with Olink or orthogonal assays for greater confidence.
References
- Candia J. SomaScan Bioinformatics: Normalization, Quality Control, and Assessment of Pre-Analytical Variation. Methods Mol Biol. 2025;2929:107-127. doi: 10.1007/978-1-0716-4595-6_9. PMID: 40601147.
- Wik L, Nordberg N, Broberg J, Björkesten J, Assarsson E, Henriksson S, Grundberg I, Pettersson E, Westerberg C, Liljeroth E, Falck A, Lundberg M. Proximity Extension Assay in Combination with Next-Generation Sequencing for High-throughput Proteome-wide Analysis. Mol Cell Proteomics. 2021;20:100168. doi: 10.1016/j.mcpro.2021.100168. Epub 2021 Oct 27. PMID: 34715355; PMCID: PMC8633680.
- Mary R Rooney, Jingsha Chen, Christie M Ballantyne, Ron C Hoogeveen, Olive Tang, Morgan E Grams, Adrienne Tin, Chiadi E Ndumele, Faiez Zannad, David J Couper, Weihong Tang, Elizabeth Selvin, Josef Coresh, Comparison of Proteomic Measurements Across Platforms in the Atherosclerosis Risk in Communities (ARIC) Study, Clinical Chemistry, Volume 69, Issue 1, January 2023, Pages 68–79
- Candia, J., Daya, G.N., Tanaka, T. et al. Assessment of variability in the plasma 7k SomaScan proteomics assay. Sci Rep 12, 17147 (2022).
- Christensen, T.D., Maag, E., Madsen, K. et al. Determination of temporal reproducibility and variability of cancer biomarkers in serum and EDTA plasma samples using a proximity extension assay. Clin Proteom 19, 39 (2022).