
Why Olink Reveal Matters for Modern Research
Proteomics has moved beyond being a "nice-to-have" toward being essential for many non-clinical research projects. Yet, labs often face barriers: high cost, complex workflows, or need for specialized equipment. Olink Reveal addresses these issues head-on, offering a high-plex proteomics solution that's simpler, faster, and more accessible than many alternatives.
Here are the key values of Olink Reveal:
Broad proteome coverage with actionability: Reveal includes over 1,000 carefully selected human proteins, with strong representation of immune and inflammation pathways. This gives researchers both a broad view of biological systems and the ability to zoom in on immune responses.
Minimal sample and time requirements: Just 4 μL of plasma or serum suffices. Library preparation takes ~1.5 days, with about 2–2.5 hours of hands-on work. That means greater throughput without stretching staff time.
Compatibility with existing workflows: Reveal uses NGS (next-generation sequencing) read-outs. Many labs already have Illumina platforms like NextSeq or NovaSeq. No need for entirely new instrumentation.
Cost efficiency: For projects scaling across many samples or timepoints, Reveal offers savings vs more intensive proteomics platforms.
Case Study: Analytical Performance in Benchmark Plasma Standard
- A recent preprint evaluated Olink Reveal using the standard NIST SRM-1950 plasma and a set of spike-in proteins (IL-10, VEGF-D). It found:
- Strong linearity of measurement for these spike-ins (R² ≈ 0.92-0.95) across tested concentrations
- High precision and accuracy suitable for relative quantitation in large-scale studies
Why These Advantages Matter
For academic labs, CROs, and biotech groups, Reveal helps in these common scenarios:
- Pilot studies where sample volume is limited
- Multi-omics projects, where proteomics is added onto existing transcriptomics/genomics datasets
- Longitudinal or cohort studies with many samples/timepoints, where per-sample cost and throughput are critical
To understand more about how Reveal's data gets processed into actionable insights, check our article "Understanding Olink's Data Analysis Process: From Raw Data to Insights".
Also useful: "Exploring the Olink 96 and 48-Plex Panels: Key Differences", to see how Reveal fits relative to older/more complex panels.
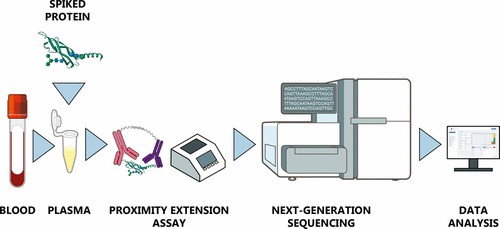
How Olink Reveal Technology Works
Understanding the workflow of Olink Reveal is essential for labs considering adopting it. Below is a step-by-step view of how Reveal moves from sample to data.
Sample Input and Incubation
Sample type & volume: Reveal works with plasma, serum, and other biofluids. You need just 4 µL per sample.
Plate layout & controls: In a standard setup, you process 86 experimental samples plus controls in a 96-well plate. Controls include internal (assay) and negative / buffer blanks. Randomization of sample placement across wells helps reduce plate-position bias.
Antibody Binding and Proximity Extension Assay (PEA)
- Reveal builds on Olink's PEA technology. Two antibodies, each linked to unique DNA oligonucleotides, bind adjacent sites on a target protein.
- When both probes bind, their DNA tags come into proximity. That allows hybridization and enzymatic extension, forming a DNA "barcode" specific to that protein. This dual-recognition step ensures high specificity and minimizes cross-reactivity.
Library Preparation and Amplification
- After incubation, the barcoded DNA is amplified via PCR. A master mix is added to each well; the PCR step converts the proximity probes' extended products into amplifiable DNA molecules.
- Samples are pooled after PCR. Purification (e.g., magnetic beads) removes unwanted by-products, primers, etc. A quality control (QC) check follows to ensure library size and concentration are acceptable.
Sequencing Read-Out
Reveal libraries are designed for NGS platforms. Common instruments used include Illumina NextSeq, NovaSeq, etc.
One sequencing run can handle ~86 samples per plate, with ~1 billion reads for those 86 samples.
Data Processing & Output
Raw count → Normalized Protein Expression (NPX): The raw sequencing counts are fed into proprietary/software pipelines that apply normalization steps, inter- and intra-assay quality control, and convert counts to NPX units. NPX is a relative quantification metric.
Quality Control involves controls built into the assay: performance of control wells, assay-level reproducibility, signal deviations, handling of missing values (below limit of detection), etc.
Timing, Hands-On Time, and Throughput
Total prep time: Around 1.5 days for library prep, including sample incubation, PCRs, pooling, purification, QC.
Hands-on time: Approximately 2 to 2.5 hours of active work by lab personnel. The rest is incubation / automated steps.
Sample throughput: One plate handles 86 samples + controls. Labs can run multiples of that based on resources and sequencer capacity.
Core Technical Strengths & Specificity
The dual antibody / dual oligo approach ensures that off-target binding is minimized. Only when both antibodies bind does the hybridization + extension proceed.
Library reagents are "pre-dried, pre-mixed" in many cases, reducing pipetting steps (and thus potential error) and helping reproducibility.
Key Advantages of Reveal vs. Standard Olink Panels
Olink Reveal introduces several improvements over standard Olink panels (Target 48/96, Explore) for many non-clinical proteomics workflows. Below are the main advantages, grounded in published specifications and use cases.
1. Higher Proteome Coverage with an "Intermediate-High" Scale
Reveal profiles over 1,000 proteins, whereas standard panels like Target 96 cover ~92 proteins per panel.
Many of these proteins are selected for robust detectability in serum or plasma, and with a strong focus on inflammation and immune response pathways.
Reveal also includes >700 proteins with documented cis-pQTLs, aiding in genetic linkage analyses.
2. Sample Volume vs Depth Trade-off
Standard panels (Target 48/96) often require 1 µL of plasma/serum and allow very focused measurement of ~45-92 proteins.
Reveal uses ~4 µL sample, enabling ~1,000 protein targets, giving much more system-level insight per sample. For labs with limited sample amounts but greater throughput needs, this trade-off is favorable.
3. Workflow Simplification & Compatibility
Reveal's library prep is designed to integrate into existing NGS workflows: many labs already have sequencers (e.g. Illumina NextSeq, NovaSeq). No need for entirely new hardware.
Hands-on time is ~2.5 hours; total prep around 1.5 days. Standard panels may have shorter assay times for smaller panels but require multiple separate assays to achieve similar depth, increasing labor, plate overhead, and handling.
4. Cost Efficiency for Mid-to-Large Studies
Reveal reagent cost is approximately US$98 per sample, which, when spread across ~1,000 proteins, gives lower cost per protein data point compared to running many separate 96- or 48-plex panels
For studies needing profiling of many proteins (e.g. large cohorts, longitudinal sampling), Reveal can reduce total cost by reducing the number of separate assays, minimizing duplicate QC overhead
5. Data Consistency, Quality & Biological Relevance
- High specificity is retained via the dual-antibody / proximity extension assay (PEA) approach. This minimizes cross-reactivity and background noise, similar to standard panels.
- Reveal covers a broad range of biological pathways (Reactome top-level pathways fully, many immune response pathways) which allows comparative and systems biology analyses.
- Strong genetic validation: many proteins measured have known cis-pQTLs. This helps in downstream analyses linking proteomics to genetics.
6. Situations Where Standard Panels Still Shine
While Reveal offers many benefits, the traditional panels (Target 48 / 96) still have advantages in some contexts:
When you need absolute quantification (some Target panels may provide this).
When you want very focused assay of a small set of proteins (e.g. cytokines, immune markers) with maximum sensitivity and lowest sample volume.
When budget or sample logistics favor many small panels rather than one large multiplexed assay.
Typical Applications of Olink Reveal
Olink Reveal's blend of high-plexity, moderate sample input, and NGS-based readout makes it well suited to a number of research scenarios. Below are common use-cases with real examples to help you see where Reveal may offer value in your project.
Pilot and Population-Scale Biomarker Discovery
When you want to survey a broad set of proteins to identify candidates linked to a trait or exposure, Reveal enables screening across ~1,000 proteins in cohorts or population studies.
Case study: The Białystok PLUS Cohort in Poland used Olink Reveal to examine ~1,000 circulating proteins in ~508 participants, comparing healthy, prediabetic, and newly diagnosed type 2 diabetes groups. They found that ~22 proteins were significantly associated with glucose tolerance tests, and ~37 associated with HbA1c levels, pointing to new candidate biomarkers of metabolic dysregulation.
Analytical Performance & Method Benchmarking
Whenever a lab needs to validate a proteomics method, establish precision, sensitivity, or ensure linear responses across concentration ranges, Reveal has been benchmarked and shown strong technical characteristics.
Case study: A preprint assessed Reveal using the NIST SRM-1950 plasma standard and spike-in proteins IL-10 and VEGF-D. Reveal showed excellent linearity (R² ≈ 0.92-0.95), good precision, and accuracy in relative quantitation.
Immune-Related / Inflammation Pathway Profiling
- Because Reveal includes a high number of inflammation and immune-response proteins (e.g. >530 inflammation markers, ~96% coverage of immune response pathways) and many cis-pQTL-validated proteins, it is useful for studies of immune signaling, inflammation, or stress responses.
- Profiling how immune markers change in response to environmental exposures, treatments, or perturbations.
- Evaluating correlates of immune variability in translational research.
Longitudinal & Time-Course Studies
Reveal's cost per sample and throughput make it feasible to run many timepoints per subject, which is especially valuable in non-clinical work where dynamics are as important as end-points.
Example: In the Białystok PLUS case, multiple glucose tolerance test (OGTT) timepoints (0, 60, 120 min) were compared against protein expression levels. This allowed detection of proteins whose levels change over the course of a glucose challenge.
Core / Genomics Labs Adopting Proteomics
Labs that have existing NGS infrastructure but limited proteomics experience often benefit from Reveal. Because it uses standard sequencing instruments, established pipelines, and relatively simple hands-on steps, such labs can scale into proteomics without heavy investment in new instrumentation.
At Gent (UGent, Belgium) / Functional Genomics Core Facilities, core labs mention adopting Reveal because it fits their existing genomics infrastructure, allowing them to offer proteomics in a streamlined way.
Integrative Omics / Proteogenomics
Because many proteins in the Reveal panel have known cis-pQTLs (genetic variants that influence protein levels), researchers can integrate Reveal proteomics with genomics and transcriptomics for proteogenomic association studies.
This supports variant → protein → phenotype chains (helpful for mechanistic biology, not for clinical claims).
Environmental, Lifestyle, and Exposure Studies
Studies of how lifestyle, diet, environmental toxins or exposures affect protein expression are excellent fits for Reveal. The broad protein coverage (including immune response, metabolism, etc.) makes it possible to detect signatures of exposure or stress.
Example: Though not yet all peer‐reviewed, Olink has published or made available case studies in Reveal looking at prediabetes and metabolic exposure in populations (e.g. Białystok PLUS) and profiling in standard reference plasma to benchmark exposure or perturbation responses.
Tissue / Matrix Flexibility
Reveal is validated for plasma and serum; some labs are exploring or validating other biofluids or matrices, where sample volume or background noise is an issue, but wanting high target count.
Because sample volume is small (4 μL), and because many proteins are robustly detectable, this broadens the types of experiments feasible (e.g. small volume clinical trial cohorts, animal models in research, etc.).
From Reveal Data to Insights: What You Can Expect
Once you receive data from an Olink Reveal run, there are several important steps before you can draw meaningful conclusions. This section walks through data output formats, quality control, normalization, and best practices for interpretation.
Data Output Formats & Key Metrics
Normalized Protein Expression (NPX): Reveal data are reported in NPX units — a relative abundance scale after multiple normalization steps. NPX is not an absolute concentration but is ideal for comparing protein levels across samples in the same project.
Raw counts: Before normalization, sequencing counts (or equivalent molecular counts) are generated per protein per sample. These raw counts are adjusted for extension control, plate or sample median control etc., during the pipeline.
Limit of Detection (LOD): Each protein assay has its LOD, derived from negative controls or fixed reference values. Values below LOD are flagged; treatment of below-LOD values matters in downstream analyses.
Quality Control & Normalization
To ensure data integrity and comparability, Reveal applies a standardized QC and normalization framework:
Internal / external controls:
- Extension control, Detection control, Plate/sampling controls are included to monitor assay performance, amplification efficiency, and inter-plate variation.
- Samples deviating significantly (e.g. from median control values) get QC warnings or might be excluded.
Normalization steps:
- Raw counts are normalized by internal control(s).
- Plate control or median of control samples may be used to adjust for batch / plate effects.
- For studies spanning multiple Reveal projects and/or timepoints, bridging normalization may be needed. That involves overlap samples ("bridge samples") run in both projects to align NPX scales.
Statistical & Exploratory Analysis Best Practices
Once NPX values are QC-passed and normalized, you can proceed with these analyses to extract biological insight:
Differential expression / fold changes: Compare NPX values across experimental groups or conditions. Because NPX is relative, use consistent samples and assume log2 differences approximate fold changes.
Multivariate analysis: PCA, clustering, UMAP, or heatmaps to identify major sources of variation, detect outliers, or group samples by protein expression pattern.
Pathway / enrichment analyses: Because Reveal covers ~1,000 proteins with representation across major Reactome / immune / inflammation pathways, it's suitable for pathway over-representation or gene set enrichment analyses (GSEA) after identifying significant proteins.
Handling missing or low signal data: Proteins below LOD or with many missing values need careful handling: imputation or filtering, depending on study design.
Performance & Reliability: What the Literature Shows
In benchmarking with the NIST SRM-1950 plasma standard plus spike-in proteins (IL-10, VEGF-D), Reveal showed strong linearity (R² ≈ 0.92–0.95). That confirms the platform's suitability for relative quantitation in large-scale projects.
In the Białystok PLUS cohort (508 samples), Reveal identified proteins associated with HbA1c levels, glucose tolerance categories, and timepoints in OGTT, illustrating its ability to detect biologically meaningful signals in population data.
Limitations & Things to Beware
NPX values are relative; absolute quantification requires different assay designs or corroboration.
Comparing NPX across different Reveal projects (or against other Olink products) requires bridging normalization; raw NPX scales may differ otherwise.
Proteins with values frequently below LOD or with low detectability across samples may lead to low statistical power; these may not be useful unless study size is large.
Biological interpretation must account for confounders: sample handling, batch effects, demographic or environmental variables.
Practical Insights: Turning NPX Values into Biologically Useful Findings
Here's how researchers typically move from NPX data to actionable outcomes:
Define experimental groups and contrasts (e.g. high vs low exposure, time 0 vs time 2h).
Filter proteins by detectability (e.g. present above LOD in at least X% of samples).
Normalize data & inspect QC plots (boxplots, PCA) to ensure no major batch effects or outliers.
Statistical testing (t-tests, ANOVA, linear models) adjusting for covariates as needed (age, sex, sample collection).
Multiple hypothesis correction since ~1,000 proteins → control false discovery (e.g. FDR).
Visualization & functional interpretation: Volcano plots, heatmaps, pathway enrichment to see which proteins or protein‐sets change, and whether they map to known biology.
Validation in independent samples or via orthogonal methods (e.g. ELISA) for top candidates when needed.
From Reveal Data to Insights: What You Can Expect
Once you obtain data from an Olink Reveal run, you'll move through a structured process before deriving reliable biological insight. Below are the output formats, QC & normalization steps, best practices for statistical analysis, and caveats to watch.
Data Output Formats & Key Metrics
NPX (Normalized Protein Expression): Reveal data are reported in NPX units, which are relative abundance measurements after multiple normalization steps. NPX is not an absolute concentration; it is best used for comparing the same protein across samples in a unified project.
Raw counts: Behind each NPX value are raw read or sequence counts (associated with each protein assay). These are processed (controlled for extension/detection controls and plate effects) to yield NPX.
Limit of Detection (LOD): Each assay has a threshold below which measurements are considered unreliable. Reveal flags values below LOD; handling these appropriately (e.g. filtering or imputation) is essential in downstream analyses.
Quality Control & Normalization
Control elements:
Internal controls (e.g., detection, extension, incubation) are included in every plate/run. These monitor assay performance and help adjust for technical variation.
External / plate / sample controls are also used to check consistency across wells, plates, and batches. Deviations from expected values trigger QC warnings.
Normalization paths:
Plate control normalization for single-plate projects or where variation is minimal.
Intensity normalization for multi-plate or batch projects; assumes sample randomization across plates.
When combining data from different projects/or different Olink NGS-based products (e.g., Reveal, Explore HT, Explore 3072), a bridging normalization is required. Shared (bridge) samples are run in both projects and used to align NPX scales via median-centering or quantile smoothing.
Statistical & Analytical Best Practices
Filtering by detectability / LOD: Remove or flag proteins with many values below LOD; many missing data points reduce statistical power.
Outlier / batch effect detection: Use PCA, clustering, or QC plots to spot anomalous samples or plate effects.
Differential analysis: Compare NPX values across defined groups (experimental vs control, timepoints, exposures etc.), using appropriate statistical tests (t-tests, ANOVA, linear mixed models). Always include covariates if relevant (e.g. sample collection batch, demographic factors).
Multiple testing correction: With ~1,000 proteins, control false positives (e.g. FDR) is a must.
Pathway / functional enrichment: Once you have a list of significantly changing proteins, map them to pathways (Reactome, GO, etc.) to see which biological processes are showing consistent signals.
Limitations & Things to Beware
NPX values are not absolute quantities. If you need concentrations, you will need orthogonal assays or standard curves.
NPX comparisons across projects or across different Olink products must use bridging with shared samples. Without bridging, comparisons can be misleading.
Assays with frequently low or undetectable values reduce statistical power; large sample sizes or technical replicates may be needed.
Confounding factors (such as batch effects, sample collection, storage conditions, demographic or environmental influences) must be accounted for.
Practical Insights: Turning Reveal NPX Data into Biological Insights
Here's a suggested workflow researchers often follow to ensure rigorous, interpretable results:
- Define experimental groups or contrasts (e.g. treatment vs control, time 0 vs time t).
- Filter out proteins not reliably detected (e.g. present above LOD in a defined % of samples).
- Normalize data and inspect QC plots (e.g. boxplots of NPX distributions, PCA, detection control vs median).
- Run statistical tests (proper models, adjust for covariates).
- Apply correction for multiple testing (e.g. false discovery rate).
- Visualize results: volcano plots, heat maps, clustering etc.
- Functional enrichment or pathway analysis to map proteins to biological meaning.
- (Optional) Validate top protein hits via orthogonal methods (ELISA, western blot etc.) if necessary.
Positioning Reveal in the Olink Ecosystem
To understand where Reveal sits among Olink's product portfolio, it helps to compare its capabilities, use-cases, and trade-offs relative to other key platforms (Target, Flex & Focus, Explore). This helps you choose the right tool for your research.
Key Olink Platforms at a Glance
| Platform | Protein Coverage / Panel-Scale | Sample Input / Throughput | Ideal Use-Case |
| Reveal | ~1,000 proteins, with strong immune/inflammation, disease-associated proteins, many with pQTL support. | Low sample input (~4 µL), designed to work with existing NGS workflows; more accessible than high-plex systems. | Mid-scale discovery, pilot projects, exposure studies, labs wanting broader coverage without investing in large panels. |
| Target / Flex / Focus | Smaller, more focused panels (e.g., Target 48, Target 96; Flex and Focus are customizable). Offer both relative quant and in some cases absolute quantification depending on panel. | Very low sample input; less throughput but simpler workflow. Ideal where only limited protein targets are needed. | Validation, hypothesis testing, highly focused biomarker assays. |
| Explore 384 / 3072 / HT | Very large coverage: Explore 3072 (~3,000 proteins) when combining 384-plex panels; Explore HT offers >5,400 protein biomarkers. | Higher throughput, very large scale cohorts; sample input smaller than some older panels (2 µL for Explore HT). | Population studies, full proteome biomarker discovery, projects where time and scale justify higher cost. |
How Reveal Complements Other Olink Platforms
Bridging Scale & Cost
Reveal sits in between smaller, highly focused panels (Target, Flex, Focus) and very large/high-throughput platforms (Explore). If your study needs broader proteomic coverage than a 48/96 panel but doesn't demand thousands of proteins or the most extreme throughput, Reveal offers a balance: many proteins for a moderate cost and moderate sample input.
Workflow Compatibility
Labs that already have NGS sequencers or infrastructure can adopt Reveal more easily than Explore HT or Explore 3072, which often require high scale and more complex logistics.
Reveal's hands-on time and sample preparation are less intense than a full Explore panel run, reducing labor bottlenecks.
Pathway & Immune Focus
Reveal emphasizes immune response / inflammation proteins as well as disease-associated proteins and many with known pQTLs. For research focused on immunology, exposure, or inflammation biology, Reveal offers disproportionately strong coverage among its ~1,000 proteins.
Scaling Up or Down
If a pilot using Reveal yields promising candidate proteins, one might follow up with custom Focus or Flex panels, or validate with Target panels.
Conversely, if you anticipate needing thousands of samples or full-proteome depth, Explore HT may make more sense from the start—but Reveal allows earlier, less costly entry.
Limitations Relative to Other Platforms
Reveal does not cover as many proteins (nor as deep a dynamic range) as Explore HT or Explore 3072 for projects demanding ultra-high coverage.
There may be some trade-offs in sensitivity for very low abundances compared to some focused panels.
For absolute quantification or clinical-grade validations, some of the focused panels or additional methods may be required.
Example Use Case Pairings
Pilot discovery: Use Reveal to cast a wide net in small cohort / multiple conditions; then validate top hits with Target or Focus panels.
Large-scale cohorts: Use Explore HT when you have many samples (hundreds to thousands), full proteome questions, and infrastructure.
Custom pathways or hypothesis testing: Use Target / Flex / Focus when only a known set of proteins are of interest.
Conclusion & Action Steps
Olink Reveal offers a compelling middle ground in proteomics, bridging the gap between focused small-panels and ultra-high plex exploratory platforms. With ~1,000 human proteins, excellent immune/inflammation pathway coverage, low sample input (≈ 4 µL), simplified workflow (≈ 1.5 days prep, ~2.5 hours hands-on), and a cost per sample around US$98, it empowers labs to generate biologically meaningful data without needing heavy investment in new instrumentation or massive budgets.
If your upcoming projects require broad proteome screening, pilot biomarker discovery, or integrating proteomics into existing NGS pipelines, Reveal is well suited. It scales well for longitudinal, cohort, or environmental exposure studies, and supports reproducibility via its QC and normalization frameworks.
Action Steps — What You Can Do Next
If you're convinced Reveal may be right for your research, here are suggested next steps:
Evaluate your sample needs & study design
Decide how many samples (and timepoints) you need. Think about sample matrix (plasma, serum etc.), sample volume, and timing. Also consider whether you will need bridging normalization (if comparing across projects).
Consult our panel of experts
Get in touch to discuss your project requirements—our team can help you determine whether Reveal or another Olink product (e.g. Target, Explore) fits best. For instance, you may want focused panels if you have a small number of target proteins.
Obtain a quote & timeline
Request pricing and a timeline for sample prep, processing, data delivery, and analysis. Since Reveal uses existing NGS infrastructure, turnaround is often faster and more predictable.
Plan your budget & resources
Make sure you have access to required lab equipment (sequencer or access to one), competent staff, and data analysis tools or support. Factor in sequencing costs, reagent kits, sample QC, and data handling.
Follow best practices for data QC and downstream analysis
Before launching full-scale projects:
- Run a pilot or small subset to test your QC pipeline.
- Check consistency, detectability, missing-data proportions.
- Decide how you will handle below-LOD values, normalization, and statistical modeling.
References
- van der Burgt YEM, de Meijer E, Palmblad M. Brief Evaluation of Olink Reveal Proximity Extension Assay for High-Throughput Proteomics: A Case Study Using NIST SRM 1950 and Two Spike-In Protein Standards. J Proteome Res. 2025 Sep 8. doi: 10.1021/acs.jproteome.5c00571. Epub ahead of print. PMID: 40922092.
- Proteomic profiling with Olink® Reveal identifies potential biomarkers of diabetes and prediabetes: A case study using the Białystok PLUS Cohort


