
Why Compare Olink Panels?
Proteomics research is advancing rapidly, offering scientists powerful tools to measure proteins with high sensitivity and scalability. Among these, Olink assays have become widely adopted for profiling proteins across different biological samples. However, one recurring challenge for many research teams is deciding which Olink panel format—96-Plex or 48-Plex—best fits their project needs.
Choosing between these panels is not just a technical preference. It directly impacts experimental design, sample throughput, budget allocation, and ultimately the reliability of results. For example, a pharmaceutical R&D team exploring broad biomarker signatures in cardiovascular disease may benefit from the wider protein coverage of the 96-Plex format. In contrast, an academic lab focusing on a small set of inflammation-related proteins could find the 48-Plex more practical and cost-effective.
Understanding the key differences helps researchers avoid mismatched study designs. It ensures that resources are spent efficiently and that data outputs align with project goals. In this article, we will explore the defining features of both formats, clarify how they differ in scope and application, and provide real-world insights into when each is most appropriate for use.
For those new to Olink technologies, it may also be useful to revisit the fundamentals of the platform and how it compares with other proteomics methods. Our Introduction to Olink Proteomics article offers a primer for readers who want to establish a broader foundation before diving into the technical comparison.
Overview of the Olink 96-Plex Panel
The Olink 96-Plex format is designed for high-throughput proteomic profiling, making it one of the most widely used options for large-scale research projects. Each panel allows measurement of up to 92 proteins plus internal controls across 96 samples in a single run. This balance of breadth and efficiency makes it highly attractive to teams conducting biomarker discovery or population-level studies.
A major advantage of the 96-Plex panel is its ability to deliver comprehensive coverage without compromising on sensitivity. By leveraging Olink's Proximity Extension Assay (PEA) technology, researchers can detect proteins present at very low concentrations, often in the picogram per milliliter range. This enables robust detection of both common and rare protein markers within the same experiment.
Another strength lies in scalability. The 96-sample throughput allows for statistically powerful designs, whether comparing case and control groups or monitoring protein changes across time points. For example, in a recent study investigating biomarkers of Alzheimer's disease, researchers applied a 96-Plex panel to evaluate longitudinal plasma samples, achieving reproducible data across hundreds of participants. Such studies illustrate how the format supports population-scale investigations where reproducibility and coverage are essential.
In addition, the 96-Plex is well suited for translational projects bridging discovery and preclinical research. Pharmaceutical and biotech groups often rely on this format when screening large sample cohorts for potential biomarkers before narrowing down targets for focused validation.
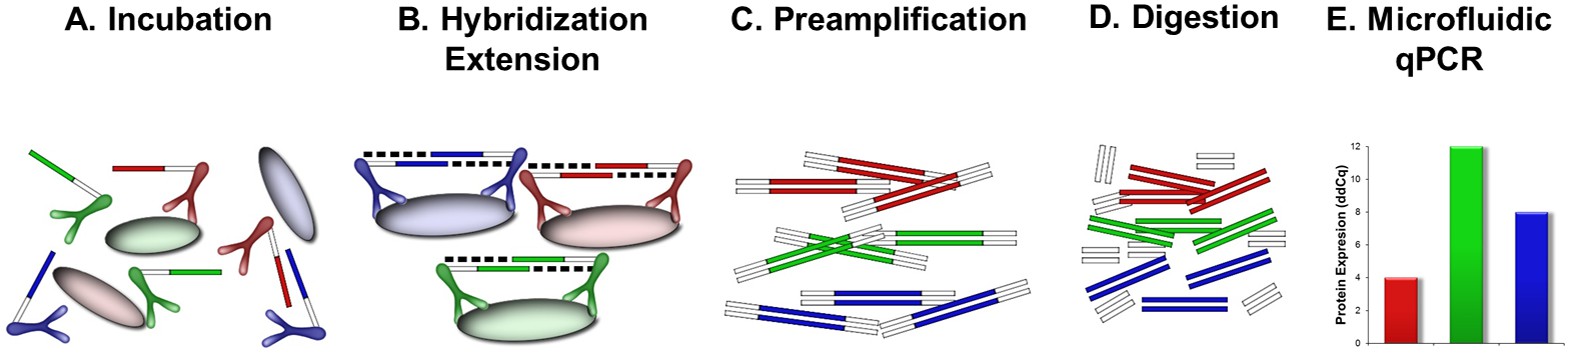 Figure 1. Design and description of 96-plex PEA.
Overview of the Olink 48-Plex Panel
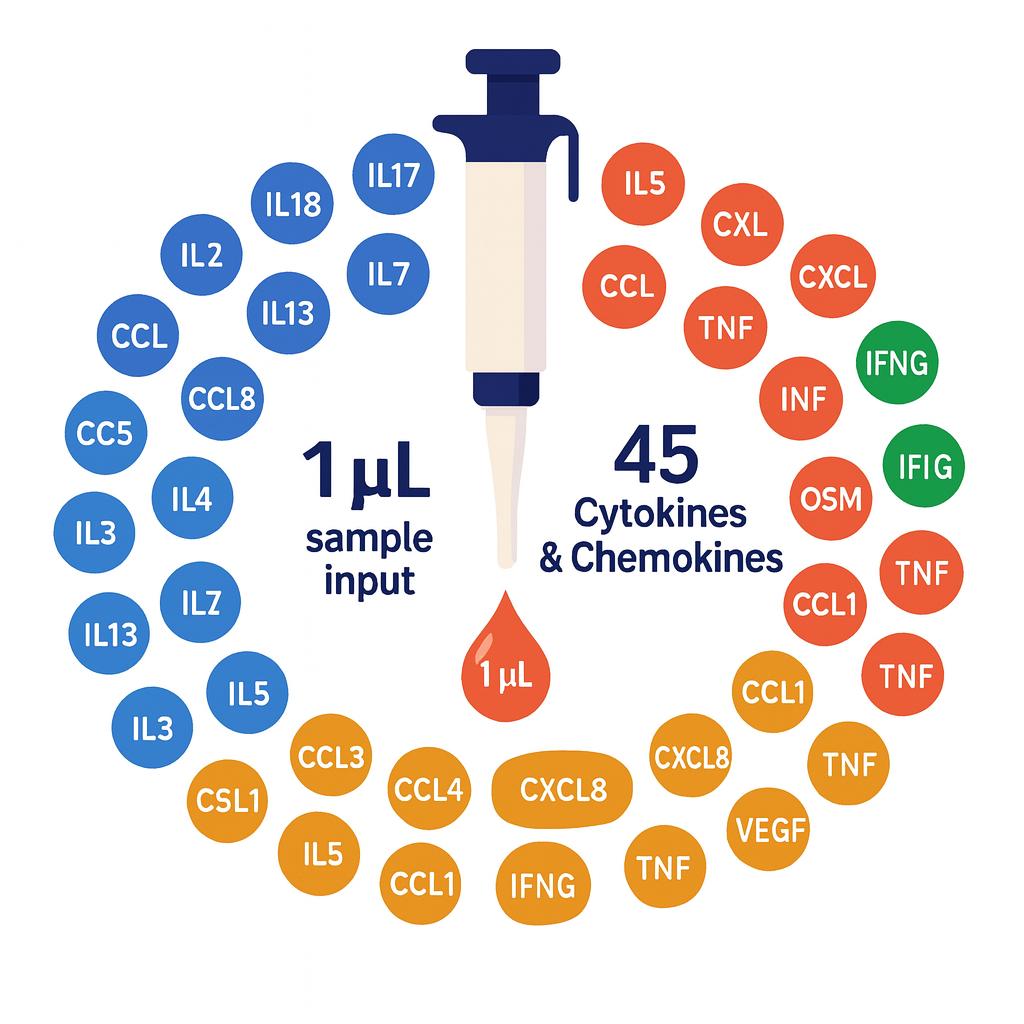
The Olink 48-Plex panel provides a streamlined alternative for projects that do not require the broad coverage of the 96-Plex format. It measures up to 45 proteins plus controls across 48 samples in a single run. This makes it an appealing choice for exploratory studies, pilot experiments, or targeted research where sample numbers or budgets are more limited.
While smaller in scale, the 48-Plex retains the same Proximity Extension Assay (PEA) technology that underpins the entire Olink platform. Researchers benefit from the same sensitivity, specificity, and reproducibility as the 96-Plex format, but in a configuration that is easier to apply to focused biological questions.
The panel is particularly valuable for validation studies. For instance, after initial biomarker discovery with a larger Olink panel, a research team might choose the 48-Plex to confirm findings in a smaller, independent cohort. A published example can be found in cardiovascular research, where investigators used the 48-Plex format to validate candidate biomarkers associated with heart failure risk in a secondary patient group. This illustrates how the smaller format supports stepwise research strategies that move from discovery to validation.
In addition, academic laboratories often use the 48-Plex format as a cost-effective entry point into proteomics. It allows them to generate high-quality protein data without committing to the scale and expense of 96-Plex projects. For CRO clients and pharma partners, the panel offers a flexible option for early-phase studies where rapid turnaround and clear pilot data are the primary goals.
Key Technical Differences Between 96- and 48-Plex Panels
Here we compare the two formats on technical features that matter most for experiment design. This section includes a side-by-side table summarising what to expect.
Proximity Extension Assay: Common Ground
- Both the 96-Plex and 48-Plex panels use Olink's Proximity Extension Assay (PEA). That means two antibodies per target, each tagged with complementary DNA oligonucleotides. When both bind the target, the DNA tags can hybridize, extend, then amplify. This dual recognition gives high specificity and limits background signal.
- Both formats require small sample volumes: approximately 1 µL of plasma or serum per sample for Target panels.
Comparison Table: 96-Plex vs 48-Plex
| Feature | Olink 96-Plex Panel | Olink 48-Plex Panel |
| Number of proteins + controls | ~ 92 target proteins + internal controls per run | ~ 45 target proteins + internal controls per run |
| Sample capacity | 96 samples per run | 48 samples per run |
| Best for study size | Discovery, large cohorts, comparative studies, broad profiling | Pilot studies, focused biomarker validation, when sample number or budget is limited |
| Breadth vs depth | Wider proteomic coverage, more targets per sample; broader pathway representation | More constrained target-set, but often sufficient for hypothesis-driven work |
| Cost per sample | Higher total cost but lower cost per protein measured when many proteins are used | Lower upfront cost; cost per protein may be higher as fewer proteins per run |
| Throughput & turnaround | Higher throughput; more work per run, possibly longer prep when many samples | Faster prep per run if fewer proteins/samples, less complexity |
| Dynamic range & sensitivity | Both formats maintain excellent sensitivity (low abundance proteins detectable), though performance may vary slightly depending on target proteins and abundance in sample matrix | Similar sensitivity; may offer marginal improvements for higher-abundance targets due to reduced multiplex competition |
| Use cases | Biomarker discovery, broad exploratory proteomics, large cohort studies | Confirmation/validation studies, focused panels, smaller labs or CROs doing early-stage work |
Additional Technical Considerations
Assay variability and precision
Intra-assay (within the same plate) and inter-assay (across different plates) reproducibility are important. For 96-Plex, the original "Homogenous 96-Plex PEA Immunoassay" paper reports strong intra- and inter-assay precision using 1 µL of sample.
The 48-Plex tends to show lower complexity in multiplexing, therefore somewhat simpler QC and normalization steps—but still maintains tight precision, especially for well-behaved proteins.
Multiplex competition
In highly multiplexed formats (like 96-Plex), antibody pairs compete for binding, which can lead to slight suppression for some targets. Selecting panels with known performance helps.
The 48-Plex, with fewer concurrent targets, typically suffers less from competition, sometimes giving more reliable readouts for mid-abundance proteins.
Normalization and controls
Both panels include internal and inter-plate controls to adjust for batch effects, reagent variability, and signal drift.
NPX (Normalized Protein eXpression) is the standard output unit; both formats use NPX for relative quantification.
Sample types and matrices
Plasma and serum are validated in both formats.
For unusual matrices (e.g., cerebrospinal fluid, cell lysates), performance may depend more on protein abundance and sample prep. Though studies with the broader Olink Explore platform show excellent results in low-protein matrices like CSF.
When to Choose Each Panel
Picking between the 96-Plex and 48-Plex formats should be guided by your project goals, sample constraints, and resource limits. Below are situations where each format tends to perform best.
Use the 96-Plex When You Need:
- Broad protein coverage across many biological pathways or processes. If your research question spans immunology and metabolism and neurology, the 96-Plex helps you capture those multiple dimensions without switching panels.
- Large sample numbers to ensure statistical power. For example, profiling many samples from multiple experimental groups (controls vs treatments) or multiple time points. The 96-Plex supports good throughput (almost 96 samples per run) which helps here.
- Discovery-driven projects, where you don't yet know which proteins will matter. For hypothesis generation, especially in "omics"-style or systems biology work, the wider protein target set is valuable.
- Maximising cost-efficiency per protein over large experiments. While the total cost is higher, the cost per protein measured (when many proteins are multiplexed) often becomes favourable.
- Using small sample volumes but wanting comprehensive data. The 96-Plex still uses ~1 µL of plasma or serum per sample.
Use the 48-Plex When You Need:
- Focused, hypothesis-driven validation. If prior work (e.g., discovery via a 96-Plex or other methods) has identified a smaller set of proteins of interest, the 48-Plex lets you home in on those with efficiency.
- Limited sample availability. Even though both panels require low volumes, for precious or rare samples (primary cells, small animal volumes), using fewer proteins (as in 48-Plex) reduces risk of missing data.
- Budget constraints or faster turnaround. Processing fewer targets can simplify workflows, reduce reagent use, and often speed up data analysis when fewer proteins are under investigation.
- Earlier-stage exploratory work or pilot studies. Before launching large cohort work, using the 48-Plex to test feasibility or sample handling can make sense.
- Targeted immune or cytokine profiling. Olink offers 48-Plex Cytokine and Immune Surveillance panels that are tailored for inflammation, signaling, or immune biomarkers. These are ideal when the research question is tightly aligned with immune biology.
Example Scenarios
An academic lab investigating neurodegeneration mechanisms might start with a 96-Plex Target 96 panel to identify candidate proteins, then validate top hits in a smaller independent cohort using a 48-Plex Cytokine panel.
A CRO working for pharma might need to monitor response to a treatment in many animals or samples. If budget allows and the protein targets are varied, 96-Plex gives broader insight; if the aim is just to monitor a few biomarkers of toxicity or immune activation, using a 48-Plex may be more efficient.
Decision Checklist
| Question | If "Yes" → Lean toward 96-Plex | If "Yes" → Lean toward 48-Plex |
| Do I expect many unknown biomarkers? | ✔️ | |
| Is sample number large or multiple conditions/time points required? | ✔️ | |
| Am I constrained by budget or timeline? | ✔️ | |
| Are sample volumes limited or precious? | ✔️ | |
| Is I need multiple proteins from specific pathways (e.g. immune signaling only)? | ✔️ if pathway small; possibly 96 if multiple pathways involved |
If you are unsure which format fits your objectives, see How to Choose the Right Olink Panel for Your Research.
Data Analysis Considerations
When you run either the 96-Plex or 48-Plex Olink panel, data handling is just as crucial as the experimental design. Proper QC, normalization, and batch correction ensure that your NPX values (Normalized Protein eXpression) reflect biology—not technical noise. Below are key points to keep in mind.
What Is NPX and How It's Calculated
- NPX is a relative quantification unit on a log₂ scale. It's the readout from Olink's Proximity Extension Assay (PEA) using qPCR.
- Several internal controls are used in each plate:
- Incubation Control(s) monitor variation during sample binding steps.
- Extension Control assesses the extension and amplification steps.
- Detection Control monitors signal detection consistency.
- External and synthetic controls are included to define the background, limit of detection (LOD), and inter-plate consistency.
Normalization, QC, and Handling Technical Variation
| Step | What Researchers Need to Do / Know |
| Plate Control / Intensity Normalization | Use plate control normalization for single-plate projects. For multi-plate or large cohort studies, intensity normalization (centering each assay to medians) helps harmonize data across plates. |
| Bridge Normalization (Bridging Samples) | When combining datasets (e.g. two runs, different plates, or batches), include overlapping or shared samples (bridge samples). These allow calculation of adjustment factors to align NPX distributions. |
| Batch Effects and Randomization | Randomize samples across plates when possible. If samples are grouped by condition, time point, or source in non-random order, technical variation may correlate with your experimental design. Use QC plots and normalization to detect and correct this. |
| Quality Control Metrics | Monitor control-deviation thresholds (e.g., how far internal control values deviate from plate median), % below LOD, and replicate CVs (coefficient of variation). Exclude or flag assays / samples failing QC. |
Differences in Data Analysis Between 96-Plex vs 48-Plex
- The volume of data from a 96-Plex panel (more proteins, more plates) often demands more rigorous QC and normalization workflows, especially in large cohort or multi-batch studies.
- 48-Plex panels, with fewer targets, may yield fewer missing data points (below LOD) but still require checks for between-plate consistency.
- In both formats, the detection limit for some low-abundance proteins may lead to missing or censored NPX data; handling such data (e.g. with substitute values, censored regression, or removing proteins with too many missing values) needs careful thought.
Best Practices and Common Pitfalls
- Include internal controls and bridge samples: Even for small 48-Plex runs, have controls in every plate and, when possible, shared reference samples if combining datasets.
- Check assay‐specific performance: Some proteins have more variable detection; review per-protein QC metrics to avoid misleading results.
- Avoid confounding technical and biological variables: For example, don't put all your treatment group samples on one plate and controls on another; randomize plate assignment.
- Document your normalization choices: Which method was used (plate control vs intensity), how bridge samples were selected, how missing values/LLOD (lower limit of detection) were treated. Transparent reporting helps reproducibility and builds confidence.
Applications Across Research Fields
Olink 96-Plex and 48-Plex panels are already well established in many non-clinical research areas. Below are several key fields showing how labs, academia, and CROs use these tools to generate new biological insights. Real-world examples illustrate what is possible—without making medical claims.
Immunology & Inflammation
Olink panels are heavily used to profile inflammation-related proteins, e.g. cytokines, chemokines, and immune mediators, in serum, plasma or cerebrospinal fluid (CSF). One recent study compared 92 inflammation-related proteins in CSF of Guillain-Barré Syndrome (GBS) vs non-inflammatory neurological disease controls, finding several differentially expressed proteins (e.g. TNF, IL-10RB) enriched in pathways such as IL-17 signalling.
Another comparative work evaluated the Olink 48 Cytokine panel against Luminex and MSD platforms for overlapping inflammatory targets. They found that Olink often required far less sample volume and maintained good precision for detectability and linearity of cytokine measurements.
Neuroscience & Neurology
CSF and plasma proteomics with Olink are used to investigate disease mechanisms such as neuroinflammation, neuronal damage, or synaptic dysfunction. For example, that GBS study used CSF proteomics to identify proteins associated with immune pathway activation.
Large-scale aging and neurodegeneration research also use Olink for discovering protein signatures that change with age or cognitive decline. Olink's disease-area resource notes many studies of Alzheimer's, dementia, and other neurological disorders using target panels.
Oncology & Translational Biology
Olink panels are used to search for circulating protein biomarkers ("liquid biopsy" style) that reflect tumor biology, monitor immune responses, or predict treatment outcomes in preclinical or translational settings.
Example: The "Empowering Oncology Research with Next-Generation Proteomics" white paper highlights usage of Olink panels in detecting proteomic changes before clinical manifestation, in distinguishing cancer subtypes, and in evaluating biomarker signatures for early detection or prognosis.
Cardiovascular & Metabolism Research
Olink Target 96 panels are used in cardiovascular physiopathology studies. For instance, the Olink-based work with UK Biobank integrates plasma proteomics and genetic variants to find associations with cardiovascular risk and other cardiometabolic traits.
Studies in population health also employ Olink panels to assess metabolic pathway proteins, markers of organ damage, or regulatory proteins that reflect physiological changes with exercise, obesity, or aging.
Sample Types & Model Organisms
Though many studies use human plasma or serum, Olink panels are compatible also with CSF, cell lysates, tissue extracts, and even mouse/other model organism samples for translational research. This expands their utility across basic biology as well as translational pipelines.
Small volume requirements (≈1 µL) allow researchers to work with limited or precious specimens (e.g., preclinical animal studies, primary cells).
Case Study Highlight
Guillain-Barré Syndrome (GBS) CSF Proteomic Profiling: Using Olink's 96-plex inflammation-related protein panel on CSF from GBS patients vs controls, investigators identified ~20 differentially expressed proteins including TNF, IL-10RB, CCL20, IL5. These correlated with disease severity.
Platform Comparison for Cytokine Panels: In the Stockholm-Uppsala region, a head-to-head comparison among Olink 48 Cytokine, MSD, and Luminex showed Olink's lower sample volume and competitive detection performance for overlapping targets.
Expert Insights and Case Examples
Here are several peer-reviewed or validated case studies and expert analyses. They illustrate how the technical differences between Olink panels have played out in real research settings. These stories help show what to expect—and how to choose wisely.
Case Study A: Validation & Reproducibility of the Olink Target 48-Cytokine Panel
A beta-site study evaluated the Olink Target 48 Cytokine panel across two labs (one in Uppsala, one in Boston), using two different reagent batches, with 15 individual samples per site. The findings showed:
- Intra-assay CV (coefficient of variation) ~ 7% in both labs.
- Inter-assay CVs of ~ 8-10%.
This confirms that the 48-Plex cytokine panel is reproducible both within and between sites. It's especially useful when comparing biomarker levels across labs or over time.
Case Study B: Head-to-Head Benchmarking vs Other Multiplex Methods
Researchers compared the Olink 48 Cytokine panel with two other popular multiplex platforms (MSD and Luminex), using overlapping protein targets and the same biological samples. They found that:
- Olink required far smaller sample volumes (≈ 1 µL) vs MSD or Luminex, which needed much more.
- Olink delivered comparable or better precision, dynamic range, and linearity for many overlapping targets.
This kind of benchmarking is especially relevant when you care about efficiency and sample conservation—for example, in pilot or validation studies.
Case Study C: Inflammation Proteomics in Guillain-Barré Syndrome
In a non-clinical research setting, scientists used an Olink 96 panel targeting inflammation-related proteins to compare cerebrospinal fluid (CSF) from patients with Guillain-Barré Syndrome (GBS, n=23) vs non-inflammatory neurological controls (n=14). Key findings included:
- Identification of ~20 differentially expressed proteins (DEPs), including TNF, IL-10RB, IL5, CCL20.
- Enrichment of specific immune signaling pathways (e.g. IL-17 signalling, cytokine-receptor interaction).
This study shows how the higher multiplex (96-Plex) format can reveal broader pathway signals, particularly in inflammatory research.
Case Study D: Biomarker Profiling in Population Research (Reveal Platform)
Using the Olink Reveal platform (~1,000 proteins) researchers examined plasma from a general population cohort (Białystok PLUS, Poland) to detect proteins associated with prediabetes and early type 2 diabetes. Highlights:
- Protein expression correlated with clinical glucose tolerance measures (HbA1c, OGTT) and glycaemic status.
- Identification of potential biomarkers for early metabolic dysregulation before overt disease.
Although this study goes beyond just 96-or 48-plex panels (Reveal is higher multiplex), it illustrates how technical robustness (precision, reproducibility) enables meaningful findings even in population scale studies.
Expert Insight: Balancing Multiplex Scope and Technical Noise
From these and other studies, several lessons emerge:
- Multiplexing increases risk of technical artifacts: As target number grows (96-plex, higher), batch effects, missing data, and target competition become more likely. Good lab practice, QC controls, and internal normalization are crucial.
- Pilot / validation work with smaller panels helps: Starting with a 48-Plex for validation or focused aims can help you test sample prep, reproducibility, and analytical pipelines before scaling up.
- Consistency across labs matters: Reproducibility metrics (intra/inter-assay CVs) from multi-site studies (as in Case Study A) show that trained labs following standard protocols can get consistent results.
FAQ – Olink 96 vs 48-Plex Panels
Q1. Can NPX data from 96-Plex and 48-Plex panels be compared directly?
A: Generally yes, for overlapping proteins—but with caution. NPX (Normalized Protein Expression) is a relative measure, so differences in sample batches, reagent lots, or panel design can introduce bias. If you plan to combine data, include bridge or overlapping control samples. Use standardized QC and normalization across runs. For detailed best practices, see Understanding Olink's Data Analysis Process: From Raw Data to Insights
Q2. How much sample volume is needed for 96-Plex vs 48-Plex panels?
A: Both panels are designed to use very small sample volumes—typically ~1 µL of plasma or serum per sample. The low volume requirement holds true for both 96-Plex and 48-Plex in Olink Target panels.
Q3. Are the quantification methods (relative vs absolute) different between 96- and 48-Plex panels?
A: Both panels primarily deliver relative quantification (NPX units). However, for certain 48-Plex panels (e.g. cytokine or immune panels), absolute quantification (e.g. pg/mL) may be provided, depending on the panel or custom/validated version. Always check the datasheet for the specific panel you plan to use.
Q4. What about sensitivity and detection limits—are there proteins only reliably detectable in the 96-Plex?
A: Both panels share the same PEA technology, which is highly sensitive. But in practice, a high-multiplex setting (like 96-Plex) means more competition, which can slightly reduce sensitivity for low-abundance targets. For some very rare proteins, a smaller panel (or targeted assay) might give fewer missing values (below limit of detection). QC with detection-limit filtering helps.
Q5. How do costs scale between 96-Plex and 48-Plex panels, especially per protein measured?
A: The 96-Plex tends to have higher total cost per run, but lower cost per protein if you use many or all of the proteins. The 48-Plex has lower upfront cost and is more economical for studies where fewer proteins are needed. If your study uses just a subset of proteins, the 48-Plex may be more budget-friendly
Q6. Should I expect more missing or unreliable data in 96-Plex vs 48-Plex?
A: Slightly higher risk with 96-Plex, especially for low-abundance targets. As multiplex increases, some protein assays may fall below detection limit more often. Rigorous QC and possible removal of proteins with many missing values (e.g. >50% below LOD) helps ensure robust downstream analysis. This is seen in large cohort or population-scale studies.
References
- Sattlecker, M., et al. (2023). "Blood-based proteomic profiling in preclinical and prodromal Alzheimer's disease." Nature Medicine, 29, 305–315.
- Lind, L., et al. (2022). "Circulating proteins and risk of heart failure: a proteomic approach in two community-based cohorts." European Heart Journal
- Multiplex analysis of inflammatory proteins: A comparative study across multiple platforms


