
Why cytokine profiling drives immune research now (Attention)
Olink proteomics analysis makes cytokine profiling practical at scale. With the Olink Cytokine Panel and the Olink assay, researchers quantify many low-abundance immune mediators from tiny volumes, reducing reruns and sample waste. These data clarify why individuals show different immune trajectories in infection, vaccination, autoimmunity, and model systems—without making clinical claims. (Assarsson et al., 2014. DOI: https://doi.org/10.1371/journal.pone.0095192)
What changes for your team is speed to interpretation:
- Broad, multiplex readouts reveal pathway-level shifts, not single markers.
- Normalized protein expression (NPX) stabilises comparisons across plates and projects.
- Minimal input (often ~1–3 µL) preserves biobanked samples for follow-up work.
A longitudinal eBioMedicine analysis used PEA-NGS to profile ~1,500 plasma proteins in mild-to-moderate infection and showed coordinated shifts in interferon-linked chemokines over time—evidence that high-plex cytokine panels capture evolving immune states rather than static snapshots. (Zhong et al., 2021. doi: 10.1016/j.ebiom.2021.103723)
Cross-study synthesis also matters. A meta-analysis across five independent cohorts identified a reproducible set of cytokine and chemokine changes—such as IL-6, IL-18, CXCL10, and CXCL11—demonstrating platform robustness for discovery and immune monitoring in research settings. (Suhre et al., 2022. DOI: https://doi.org/10.3389/fimmu.2021.781100)
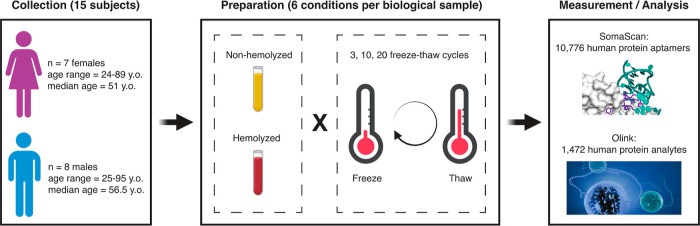 Fig. 1 cytokine profiling Study design.
If you're new to the platform, this short primer helps you level-set on terminology and outputs: Introduction to Olink Proteomics: What You Need to Know.
What Olink Cytokine Panels deliver in practice
Olink proteomics analysis with the Olink Cytokine Panel uses the Olink assay to measure many immune mediators from very small volumes. The platform combines dual-antibody recognition with DNA barcodes and NPX normalization for reliable, plate-to-plate comparison. These advantages shorten method development, conserve samples, and speed interpretation in research-use-only studies.
| Capability | What it delivers | Practical impact in the lab |
| Dual-antibody PEA chemistry | High specificity and low cross-reactivity in multiplex | Trust multiplex cytokine results without extensive cross-talk troubleshooting |
| Minimal input (≈1 µL per test) | Quantify low-abundance cytokines from scarce samples | Preserve biobanks; add timepoints without exhausting material |
| High plex with NGS readout | ~1,500 targets profiled with strong accuracy and sensitivity | Capture coordinated pathway shifts across cytokine networks |
| Cross-platform consistency | qPCR vs NGS median correlation ~0.985 across proteins | Compare historical data while upgrading throughput |
| NPX normalization with inter-plate controls | Improved inter-assay precision and plate-to-plate comparability | Confidently merge batches and control drift |
| Robust to complex matrices | Validated on plasma, serum, DBS, and model systems | Run diverse sample types under one workflow |
| Sensitive detection of low-abundance proteins | Wide dynamic range with DNA-mediated signal readout | Detect cytokines near LOD with fewer reruns |
When to pick Olink Cytokine vs other methods
Use Olink proteomics analysis when you need broad cytokine coverage from tiny volumes and consistent NPX values across plates and projects. The Olink Cytokine Panel and Olink assay excel for medium-to-high plex studies where relative quantification, throughput, and cross-batch comparability matter.
Choose Olink when:
- You have scarce plasma/serum and need many targets measured from ~1–3 µL.
- Your study spans batches/sites, and you need stable, normalized NPX for comparability.
- Pathway-level questions dominate, e.g., coordinated chemokine–interferon shifts rather than a single marker.
- You want rapid study setup using validated antibody pairs and a standardised workflow.
Pick another approach when:
- Single-analyte, absolute concentration is the endpoint for a small number of markers → ELISA remains simple and widely standardised.
- Ultra-high sensitivity for a few proteins is required (sub-pg/mL) → SIMOA is designed for single-molecule digital counting. (Rissin et al., 2010. DOI: https://doi.org/10.1038/nbt.1641)
- Moderate plex with absolute units and plate-based workflows is preferred → Electrochemiluminescence (ECL, e.g., MSD) or bead-based multiplex immunoassays (e.g., Luminex/xMAP) fit well.
- You need untargeted discovery beyond antibody-defined panels → Mass spectrometry or immuno-MS (e.g., SISCAPA) enables broader analyte coverage with targeted verification.
Decision tips to reduce rework
- Plex vs sensitivity: For 50–1,500 targets at research depth, Olink panels are efficient; for 1–5 ultralow targets, SIMOA/ELISA may be leaner.
- Relative vs absolute units: Olink reports NPX (relative, normalised). If absolute concentrations are mandatory for legacy comparability, plan an orthogonal assay.
- Sample volume: If you must bank material for downstream omics, Olink's low input is a strong fit.
- Scaling across cohorts: Olink's inter-plate controls support multi-batch harmonisation; still include bridging samples by design.
- Data integration: When combining with transcriptomics or metabolomics, align metadata, time points, and batch structure early.
Panel selection framework for immune questions
Olink proteomics analysis helps you map questions to the right Olink Cytokine Panel and Olink assay settings. Start with the biological objective, then match plex depth, expected abundance, sample volume, and downstream analysis needs. This framework keeps decisions fast and reproducible in research-use-only studies.
Step 1 — Define the biological question
- Are you profiling broad immune networks or a focused cytokine subset?
- Do you need longitudinal kinetics, cross-sectional comparison, or perturbation tracking?
Will results be integrated with other omics for mechanism discovery?
For a platform refresher before scoping, see Introduction to Olink Proteomics.
Step 2 — Match plex to signal and sample
- For wide immune coverage from microliters, favour higher-plex panels.
- For targeted verification or limited targets, consider mid-plex formats.
Assay miniaturisation enables ~1 µL input while retaining sensitivity in plasma/serum.
Step 3 — Plan comparability across batches and sites
- Use inter-plate controls and NPX normalisation to stabilise comparisons.
- Include bridging samples when scaling cohorts or timepoints.
Step 4 — Anticipate data integration
- If you will link cytokines with RNA or metabolites, align timepoints and metadata up front.
- High-plex PEA–NGS facilitates cross-omics interpretation at pathway level. (Nature Communications, 2021. DOI: https://doi.org/10.1038/s41467-021-22767-z)
Quick-selection matrix
| Research objective | Recommended panel/plex choice | Why this fit |
| Broad immune landscape across cohorts with limited volume | High-plex PEA–NGS cytokine/inflammation coverage | Captures coordinated cytokine–chemokine shifts from ~1–3 µL |
| Longitudinal kinetics in small biobanked aliquots | Mid- to high-plex cytokine panels | Low input preserves samples; NPX supports plate-to-plate comparison |
| Discovery screen before targeted verification | Start high-plex; downselect to focused panel | Efficiently narrows candidates; follow with orthogonal quantification if needed |
| Multi-site project requiring harmonised data | Any plex + strict IPC/bridging design | NPX normalisation plus bridging samples reduce batch effects |
| Mouse or xenograft model cytokine profiling | Species-matched cytokine panel or validated assays | Assays validated in complex matrices and xenografted mice |
Case study
A high-plex longitudinal proteomics study tracked evolving immune signatures across hundreds of participants, highlighting interferon-linked chemokines as temporal markers. Such designs benefit from higher plex and rigorous normalisation, then targeted follow-up.
For selecting a plex that matches sample volume and targets, see Exploring the Olink 96 and 48-Plex Panels: Key Differences.
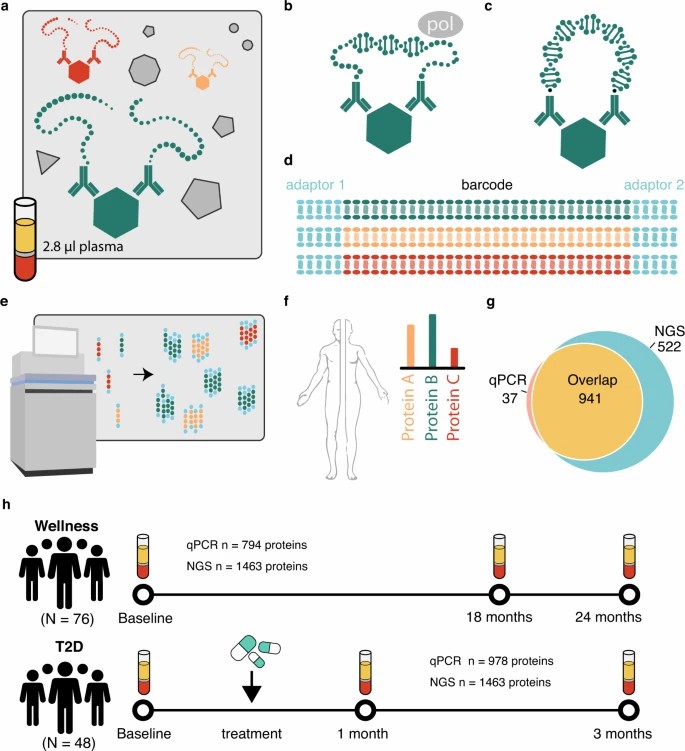 Fig. 2: Principle of the PEA-NGS method and description of cohorts.
Study design essentials for cytokine projects
Thoughtful design determines data quality. Olink proteomics analysis with the Olink Cytokine Panel and Olink assay benefits from clear cohorts, disciplined sampling, and planned controls. Start with the biological contrast, then engineer plate layouts and QC to protect NPX comparability across batches.
1) Cohorts, controls, and covariates
Define inclusion criteria and pre-specify comparison groups. Balance age, sex, and sampling windows where possible. Record pre-analytical metadata such as tube type, fasting status, and storage history. This context accelerates interpretation and reduces avoidable variance.
2) Time points and sampling cadence
Match collection times to the biology you expect to change. For longitudinal questions, anchor baseline draws and regular intervals to support mixed-effects models and pathway trends.
3) Plate layout, randomisation, and bridging
Randomise sample order and distribute groups evenly across plates. Add bridging samples to align batches; normalisation against shared references is a proven approach for multi-visit or multi-batch studies.
4) Controls you must plan up front
Olink uses internal and external controls to flag technical issues and stabilise NPX. Internal controls include Incubation, Extension, and Detection controls; external controls include negative control, sample control, and a calibrator or plate control. Many labs apply run-level and sample-level thresholds based on these controls to trigger "QC warning" review.
5) Replicates and reference material
Use a pooled reference in each plate to monitor drift. Reserve technical replicates for pilots, assay qualification, or suspected outliers; prioritise biological replicates for power. Keep a small aliquot banked for reruns or orthogonal checks.
6) Pre-analytical handling that protects cytokines
Minimise freeze–thaw cycles and document any deviations. Large-scale analyses report that a minority of Olink Explore 1536 assays are affected by repeated freeze–thaw, reinforcing good handling SOPs.
Processing delays can influence some inflammatory markers, but several studies show limited impact under controlled conditions. Always standardise your workflow and validate locally before scaling.
7) QC gates before analysis
Screen for assay performance, sample outliers, and detection relative to LOD. Confirm inter-plate control behaviour and verify normalisation choices. Document any removal rules and keep an audit trail for reproducibility.
Translational teams can map how NPX results fit into trial-adjacent research workflows in Olink Proteomics in Clinical Research: A Game Changer.
Pre-analytical handling and QC checkpoints
Good pre-analytics make Olink proteomics analysis more reliable. With the Olink Cytokine Panel and Olink assay, small mistakes can shift NPX values. Standardise tubes, timing, temperature, and controls, then document every deviation for transparent review.
1) Blood tubes and matrix choice
- EDTA plasma is a solid default for cytokines.
- Heparin, citrate, and serum show small assay-specific shifts versus EDTA.
- Pick one matrix and stick with it across cohorts and timepoints.
Evidence from an analytical validation shows generally small differences across EDTA, heparin, citrate plasma, and serum for Olink assays, supporting consistent performance across matrices. (NCI BRD, Olink Analytical Validation SOP. )
2) Time to processing and holding temperature
- If processing is delayed, cool whole blood at 4 °C when possible.
- Several cytokines remain stable for many hours; exceptions can occur.
A controlled study found no significant changes in IL-6, IL-10, IFN-γ, TNF, and multiple chemokines after up to 72 hours at room temperature or 4 °C before plasma separation. - Complementary work showed that holding temperature can affect some protein measurements, reinforcing protocol standardisation and documentation.
3) Freeze–thaw limits and hemolysis checks
- Minimise freeze–thaw cycles; aliquot at first storage.
- Flag or exclude visibly hemolysed specimens; record a haemolysis index when available.
A large benchmark across 1,472 Olink Explore 1536 analytes reported that only a subset are affected by repeated freeze–thaw or in-vitro hemolysis, but the effect is analyte-specific—supporting preventive handling and QC flags.
4) Storage and transport
- Snap-freeze plasma/serum promptly; store at −80 °C; avoid frost-free freezers.
- Ship on dry ice with temperature logging and chain-of-custody metadata.
General proteomics protocols emphasise strict control of pre-analytical variables for plasma/serum studies.
5) Olink internal and external controls (build them into plates)
- Internal controls (run on every sample): Incubation, Extension, and Detection controls monitor key steps.
- External controls (on each plate): negative controls, sample controls, and inter-plate/plate controls provide calibration and QC anchors.
UK Biobank Explore 1536 documentation shows eight external controls supplied per 96-well plate, clarifying standard layouts. (UK Biobank Olink FAQ)
6) Required QC gates before analysis
- Confirm internal control behaviour and plate-level metrics.
- Review detection versus LOD, call-rates, and sample outliers.
- Inspect dilution/median signal, control-to-sample separation, and replicate concordance where applicable.
- Record exclusion rules and keep an audit trail.
These practices reflect Olink NPX workflows and community guidance.
7) Bridging and batch harmonisation
- For multi-batch or multi-site projects, add bridging samples across plates/projects.
- Apply bridge normalisation to align NPX distributions before statistics.
The OlinkAnalyze references outline bridge-normalisation methods for within- and cross-product datasets. (OlinkAnalyze vignettes)
8) Minimal reporting checklist (embed in your SOP)
- Matrix, tube type, draw-to-spin time, holding temperature, centrifugation settings.
- Number of freeze–thaw cycles, storage duration/temperature, shipping conditions.
- Plate map, control placement, QC thresholds, exclusion criteria, and bridging design.
- Versioned scripts for normalisation and statistical analysis.
Running the Olink assay: plates, controls, and throughput
Plate maps that scale cleanly
- Use 96-well plates with a consistent layout across batches.
- Reserve external control wells on every plate and mirror their positions.
- In Explore 1536 workflows, a standard layout is 88 samples and 8 external controls. This convention anchors QC and supports cross-plate normalisation.
Practical note: Lock your layout template in the SOP before the pilot. It reduces remaps and helps downstream scripts find controls reliably.
Controls to enable confident NPX comparisons
- Internal controls track immunoreaction, extension, and detection in each sample. They flag run issues and help define pass/warn rules.
- External controls include negative controls, sample controls, and an inter-plate control (IPC) used for secondary normalisation.
- Example QC criteria used by service labs review Incubation/Detection control deviation from plate medians to classify Pass or QC warning. Document any thresholds you adopt.
Tip: Keep one pooled reference on every plate. It stabilises trend lines and aids troubleshooting during bridging.
Readout options and what they imply for throughput
- Target 48/96 (qPCR readout): The Olink Signature Q100 is a benchtop system designed for these panels, simplifying on-site runs and shortening turnaround.
- Explore (NGS readout): Libraries run on Illumina systems; for NextSeq 550, one Olink library uses one High Output flow cell per run. Plan runs and lanes before sample lock-in.
- High-throughput Explore/HT: Semi-automated workflows plus NGS enable very high weekly measurement capacity, supporting large discovery cohorts.
- Design guardrails: Batch by biologically coherent groups, add bridging samples between runs, and align plate counts with sequencer availability.
Throughput planning checklist
- Plate count: Derive from planned replicates, controls, and expected dropouts.
- Sequencing plan: Map libraries to flow cells; confirm instrument time and lane usage.
- Control density: Fix external controls per plate; verify internal control behaviour before combining plates.
- Automation fit: Decide which steps to automate; ensure barcode tracking across pre-PCR, library prep, and sequencing.
Biological interpretation: from cytokines to mechanisms
Olink proteomics analysis helps you move beyond single markers. With the Olink Cytokine Panel and Olink assay, NPX shifts trace coordinated immune programs—Th1/Th2/Th17 balance, interferon activity, and chemokine-driven trafficking—so you can generate mechanism-level hypotheses for research-only decisions. A 1 NPX difference is ~twofold on the log2 scale, which makes pathway changes intuitive to read.
1) Read effect size first, then significance
- Treat NPX differences as biological signals; add FDR for context.
- Summarise median effects across pathway members, not one analyte.
- Visualise with compact heatmaps or "axis scores" to show net shifts.
Zhong and colleagues demonstrated how high-plex PEA–NGS captures coherent immune trajectories rather than isolated cytokine spikes, enabling pathway-level interpretation.
2) Recognise hallmark cytokine axes
- Th1/interferon axis: IFN-γ with CXCL9/CXCL10/CXCL11 often rise together.
- Th2 axis: IL-4, IL-5, IL-13 accompany eosinophil-linked mediators.
- Th17/Type 3 axis: IL-17 family and IL-22 track barrier-site responses.
In a Molecular Omics study, Th1/Th2/Th17 cytokines predicted 186 cardiometabolic proteins profiled by Olink, underscoring axis-level coordination.
3) Separate general inflammation from interferon signaling
- Acute-phase reactants (e.g., CRP, SAA) can correlate with many cytokines.
- Check IFN-linked chemokines (CXCL9/10/11) to identify interferon programs.
- Build simple "IFN scores" by z-scoring these chemokines across samples.
Filbin et al. used high-plex Olink data to reveal severity-linked interferon-chemokine patterns and tissue-damage signatures, supporting program-level interpretations.
4) Use networks, not pairs
- Correlate cytokines across samples to find modules that move together.
- Expect modules mixing cytokines with soluble receptors and cell-death markers.
- Interpret modules by biology (e.g., "IFN-T cell trafficking" or "myeloid activation").
Population-scale Olink resources show stable co-movement patterns that aid mechanism inference and replication across cohorts.
5) Add cell-of-origin context
- Pair cytokine modules with tissue-enriched proteins to hypothesise sources.
- For example, epithelial-associated proteins alongside IFN-chemokines may imply barrier injury with antiviral signaling.
- Validate with orthogonal assays in appropriate model systems.
In severe viral infection, Olink profiles linked cytokine programs with tissue-specific injury signals, clarifying whether damage was direct or immune-mediated.
6) Mind time and matrix
- Longitudinal sampling reveals program switching that single time points miss.
- Use consistent matrices and pre-analytics so true biology outpaces artefacts.
- Report detection rates and below-LOD handling alongside effect sizes.
Longitudinal plasma profiling with PEA–NGS captured evolving interferon-linked chemokines over time, illustrating how kinetics refine mechanism calls.
Integrating cytokines with other omics for deeper insight
Olink proteomics analysis pairs naturally with transcriptomics and metabolomics. The Olink Cytokine Panel captures pathway-level protein signals, while RNA-seq and metabolite profiles add regulatory and functional context. Together, multi-omics sharpens mechanism hypotheses in research-use-only studies and avoids over-interpreting any single layer. (Reimegård et al., 2021. DOI: https://doi.org/10.1038/s42003-021-02142-w)
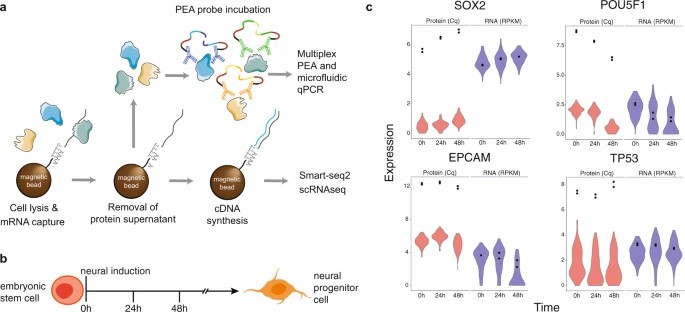 Fig. 3 multiplex PEA panel for single cell analysis in collaboration with Olink Proteomics
Why integrate these layers now
- Proteins sit closer to phenotype than transcripts, improving pathway readouts.
- Large proteogenomic resources enable genetics-anchored interpretation of cytokine shifts.
Practical integration patterns you can reuse
- Matched sampling: Align draw times across proteomics, RNA, and metabolites; record identical metadata. Review study-design options before data collection.
- Axis scores: Compute interferon-chemokine or Th1/Th2/Th17 scores from NPX, then correlate with RNA modules and metabolic pathways.
- Network fusion: Combine NPX–RNA correlations with pathway maps; use penalised models to stabilise high-dimensional features.
- Genetics as an anchor: Use pQTL and colocalization to prioritise cytokines linked to regulatory variants.
A minimal workflow for cytokine-centric multi-omics
- Plan matched time points and shared covariates; pre-register contrasts.
- Profile cytokines with Olink proteomics, RNA with bulk or single-cell sequencing, and metabolites with LC–MS.
- Normalise each layer independently; harmonise IDs, scales, and batches.
- Integrate with correlation networks, canonical pathway scores, and cross-validated models.
- Validate leading findings in independent samples or orthogonal assays.
Tooling notes for reproducible pipelines
- Use open workflows that accommodate proteomics, RNA, and metabolomics together; document versions and parameters.
- For protein genetics and causal inference, mine large, public proteogenomic resources first to reduce false positives.
To plan cross-omics from day one, see How to Integrate Olink Proteomics with Other Omics Technologies
References
- Zhong W, Altay O, Arif M, Edfors F, Doganay L, Mardinoglu A, Uhlen M, Fagerberg L. Next generation plasma proteome profiling of COVID-19 patients with mild to moderate symptoms. EBioMedicine. 2021 Dec;74:103723. doi: 10.1016/j.ebiom.2021.103723. Epub 2021 Nov 27. PMID: 34844191; PMCID: PMC8626206.
- Assarsson E, Lundberg M, Holmquist G, Björkesten J, Thorsen SB, Ekman D, Eriksson A, Rennel Dickens E, Ohlsson S, Edfeldt G, Andersson AC, Lindstedt P, Stenvang J, Gullberg M, Fredriksson S. Homogenous 96-plex PEA immunoassay exhibiting high sensitivity, specificity, and excellent scalability. PLoS One. 2014 Apr 22;9(4):e95192. doi: 10.1371/journal.pone.0095192. PMID: 24755770; PMCID: PMC3995906.
- Suhre K, Sarwath H, Engelke R, Sohail MU, Cho SJ, Whalen W, Alvarez-Mulett S, Krumsiek J, Choi AMK, Schmidt F. Identification of Robust Protein Associations With COVID-19 Disease Based on Five Clinical Studies. Front Immunol. 2022 Jan 25;12:781100. doi: 10.3389/fimmu.2021.781100. PMID: 35145507; PMCID: PMC8821526.
- Ao X, Stenken JA. Microdialysis sampling of cytokines. Methods. 2006 Apr;38(4):331-41. doi: 10.1016/j.ymeth.2005.11.012. PMID: 16487724.
- Anderson L, Hunter CL. Quantitative mass spectrometric multiple reaction monitoring assays for major plasma proteins. Mol Cell Proteomics. 2006 Apr;5(4):573-88. doi: 10.1074/mcp.M500331-MCP200. Epub 2005 Dec 6. PMID: 16332733.
- Zhong, W., Edfors, F., Gummesson, A. et al. Next generation plasma proteome profiling to monitor health and disease. Nat Commun 12, 2493 (2021). https://doi.org/10.1038/s41467-021-22767-z
- Candia J, Fantoni G, Moaddel R, Delgado-Peraza F, Shehadeh N, Tanaka T, Ferrucci L. Effects of In Vitro Hemolysis and Repeated Freeze-Thaw Cycles in Protein Abundance Quantification Using the SomaScan and Olink Assays. J Proteome Res. 2025 May 2;24(5):2517-2528. doi: 10.1021/acs.jproteome.5c00069. Epub 2025 Apr 18. PMID: 40249843; PMCID: PMC12053949.
- McCafferty C, Letunica N, Swaney E, Tengyi C, Monagle P, Ignjatovic V, Attard C. Blood Collection Processing and Handling for Plasma and Serum Proteomics. Methods Mol Biol. 2023;2628:33-40. doi: 10.1007/978-1-0716-2978-9_3. PMID: 36781777.
- Li, W. UK Biobank pharma proteomics resource. Nat Genet 55, 1781 (2023). https://doi.org/10.1038/s41588-023-01575-9


