
When you scale up proteomics in your lab—hundreds to thousands of samples—it matters less how many proteins you can detect in a small pilot, and more how fast, reproducible, and efficient the whole pipeline becomes. Olink's Explore HT and Explore 3072 formats are engineered for that shift. This guide walks you through what these formats actually deliver, when to choose which, and how to design studies to make the most of them—with scientific precision and non-clinical research in mind.
Throughput & Scale: What Do "HT" & "3072" Actually Deliver?
Olink's Explore HT and Explore 3072/384-panel libraries offer large-scale protein profiling with high sample throughput and relatively small sample input. Here are the verified specifications and performance metrics:
Proteins assayed: Explore HT covers 5,400+ validated protein assays.
Sample input volume: For HT, ~2 µL plasma / serum or other validated matrices; for 3072 (modular 384 panels), between ~1-6 µL depending on numbers of panels used.
Workflow speed / throughput gains:
- Explore HT delivers ~4× faster workflows vs the previous generation.
- Single instrument line throughput: ~11 million data points per week.
- Pilot UK Biobank project used Explore 3072 to measure ~3,000 proteins in >54,000 participants.
Dynamic range, specificity, validation:
- HT has ~99.5% specificity, dual-antibody PEA format with negligible cross-reactivity.
- Validation across top-level biological pathways: "100% of top‐level pathways" covered.
Project scale:
UK Biobank Pharma Proteomics Project (UKB-PPP) used Olink Explore (3072 in pilot, then moving to HT) across 54,000+ samples, uncovering many protein-genetic associations. Regeneron Genetics Center selected Explore HT for a study of ~200,000 samples.
What all that means in practice:
- Profiles with thousands of proteins become feasible even at population scale.
- Small sample volumes reduce burden especially for rare biospecimens.
- High throughput (>10M data points/week) means timelines compress significantly for large studies.
- Validation and specificity metrics show that the data is reliable for downstream analysis (e.g. proteogenomic associations) even when scaling up.
Choosing the Right Format: When Explore HT vs Explore 3072 Makes Sense
Explore HT is more sweeping, more ambitious; Explore 3072 (modular 384 panels) offers more flexibility. Which is right depends on several factors in your project.
| Decision Factor | When HT is clearly advantageous | When Explore 3072 / Modular Panels suffice or are preferable |
| Discovery breadth | You want maximal proteome coverage from start; want to search for new biomarkers without pre-conceptions. | You already have candidate proteins / pathways; focus on those, with lower cost. |
| Sample count & scale | Studies with tens of thousands of samples (e.g. biobank, population studies) where throughput matters to constrain time & cost. | Smaller studies (hundreds to few thousands) where modular approach lowers overhead. |
| Budget per sample / per datapoint | Initial investment high but per datapoint or per protein cost drops significantly when you scale. | If funds limited, modular panels allow you to phase in more breadth only if needed. |
| Sample availability & input volume | Limited sample volume (rare matrices, small animal models) favour HT's low 2 µL input. | If you have more sample (or multiple aliquots), a few panels may suffice. |
| Turnaround speed / logistics | Need fast results, large data sets, many comparisons/timepoints. HT's faster workflows and automation reduce bottlenecks. | If schedule is more relaxed or fewer comparisons, modular workflows may be simpler. |
Example scenario: A biotech lab wants to screen peripheral blood from 10,000 human volunteers for unknown biomarkers. Timeline is 8 weeks. HT is very likely the better option. By contrast, a university lab with 500 samples focusing on inflammatory and metabolic pathways might start with 2-3 384-plex panels in the 3072 library.
Technical Benchmarking & Cross-Platform Evaluation
Comparative Performance: Olink Explore HT vs MS-based Methods & SomaScan
Recent studies have begun to rigorously compare Olink Explore HT and 3072 formats with mass spectrometry (MS) and aptamer-based platforms such as SomaScan. These comparisons illuminate trade-offs among depth, reproducibility, missing data, dynamic range, and cost.
The paper "Technical Evaluation of Plasma Proteomics Technologies" (Beimers et al., 2025) compared six plasma proteomics technologies: unenriched ("Neat") plasma, acid depletion, PreOmics ENRICHplus, Mag-Net, Seer Proteograph XT, and Olink Explore HT.
In that comparative setup, Seer Proteograph XT achieved the greatest proteomic depth (~4,500 proteins). Olink Explore HT detected ~2,600 proteins, while other MS methods ranged from ≈500 to ≈2,200 depending on protocol.
Reproducibility: Neat, Mag-Net, Seer, and Olink had relatively good reproducibility; PreOmics ENRICHplus and acid depletion showed higher variability (>20% median CV).
Limit of detection (LOD) and quantification (LOQ): Seer had the highest number of quantifiable proteins (LOD & LOQ) among all; Olink was comparable to Neat and Mag-Net for LOD, but worse for LOQ in this context.
Another study, "Correlations Within and Between Highly Multiplexed Proteomic Assays of Human Plasma" (Rooney et al., 2025) examined precision and cross-platform agreement between Olink Explore HT and SomaScan 11k using split plasma samples from participants in the ARIC cohort.
Olink Explore HT (5,420 assays) showed a median correlation of 0.65 and median CV of 35.7%. For Explore 3072, median CV was lower (~19.8%).
Interestingly, when values below the LOD are replaced with half LOD, Olink's median correlation (duplicate measurements) improved (≈0.79), and median CV dropped (to ~13.3%). This shows how handling low-abundance / below-detection measurements can greatly affect precision metrics.
Between-platform correlation for overlapping proteins (≈4,443 proteins) had a bimodal distribution: many proteins had low correlation between platforms, but a subset had high (r ≥ 0.8). That suggests that for some proteins, results are broadly consistent across platforms; for others, platform choice strongly influences measurements.
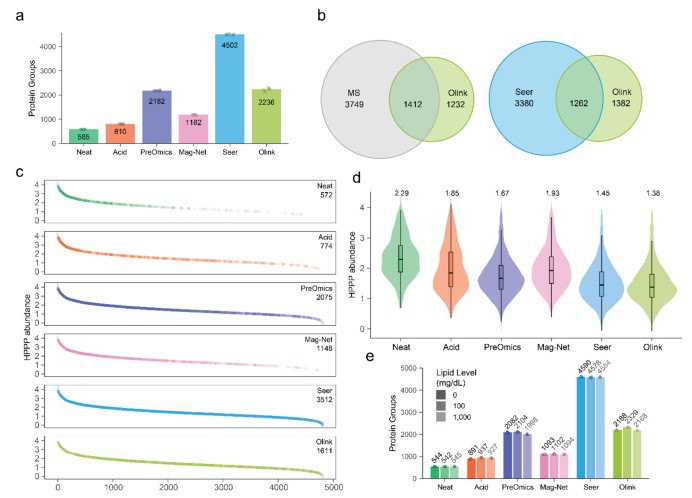 Figure 1. Comparison of proteomic depth and variability across six plasma proteomics methods (Neat, Acid depletion, PreOmics ENRICHplus, Mag-Net, Seer Proteograph XT, Olink Explore HT). Bars show number of proteins detected, number quantifiable at or above LOD/LOQ, and median coefficient of variation (CV) per method."
Implications for Study Design & Platform Selection
From these comparative results, several practical lessons emerge for researchers planning to use Olink HT / 3072 or considering between platforms.
Depth vs Precision Trade-off
Deeper proteome coverage (more proteins) tends to come with higher variability, especially for proteins expressed near the detection limit. Thus, if your interest includes low-abundance targets, plan for more samples, replicates, or accepting higher CV.
Choose platform based on which proteins are most critical: if many targets are low abundance, a platform with stronger LOQ may be better—even if overall protein count is lower.
Handling Values Below LOD Matters
As shown, replacing values below LOD with half LOD (or another imputation strategy) can markedly improve correlation and reduce CV. But this has analytical implications: it introduces assumptions that need to be transparent.
In designs, plan for sufficient sample volume, QC controls, and consider reporting how you treat below-LOD values.
Platform Overlap & Protein-by-Protein Differences
Overlapping protein sets across platforms vary; for overlapping proteins, correlation may be high for some, low for others. For projects relying on comparing data from multiple platforms (or meta-analyses), focus on shared proteins and verify their reproducibility.
Use controls or replicate measures to test specific proteins of interest in your matrix.
Cost, Throughput, and Practicality
Trade-offs in cost per sample or per datapoint can shift depending on number of samples. In Beimers et al., Seer had higher depth but also higher cost and lower throughput in some settings compared with Olink.
Time and infrastructure matter: sample prep, library construction, sequencing capacity, and data processing pipelines can become bottlenecks even if assay cost is acceptable.
Table summarizing key metrics from Beimers et al., 2025:
| Method | Avg Proteins Detected | Median CV | LOD-/LOQ-quantifiable Proteins | Throughput / Sample Capacity |
| Seer Proteograph XT | ~4,500 | ~10-12% | Very high | Moderate |
| Olink Explore HT | ~2,600 | ~13-14% (pre-LOD imputation), ~35.7% (without) | Moderate | Higher throughput |
| Mag-Net / Neat / etc. | ~500-2,200 | variable (often lower) | lower LOQ | variable |
Graph: Scatter plot of "% samples above LOD" vs "CV" for Olink HT assays (derived from Rooney et al.). This shows inverse relationship and helps readers understand what to expect for low vs high abundance proteins.
Venn Diagram: Overlap of proteins detected by Olink HT vs Seer vs SomaScan in shared sample sets (using data from Rooney et al. or Beimers et al.).
Practical Workflow Improvements — Efficiency, Quality & Data Consistency
Large-scale proteomics isn't just "more samples"; it demands robust workflows and thorough QC practices.
Workflow & reagents improvements:
- Automation in sample prep, pipetting, library preparation helps reduce human error and batch variation. HT is expressly designed for this.
- Reagent and consumable efficiency: HT system has ~6× fewer reagent components, ~10× fewer boxes in packaging versus older generations.
Data handling & QC:
- Normalized Protein Expression (NPX) metrics are used to standardize measurements. Built-in QC flags, internal controls to monitor assay performance.
- Pilot/trial runs help characterize missingness, detection limits in your specific sample matrix. Data from Olink vs MS comparison shows fewer missing values for Olink Explore 3072 in many proteins.
Consistency across batches:
- Randomization of samples across plates/runs. Use of replicate samples and control pools.
- Monitoring of plate effects, reagent lots, instrument calibration.
Case Studies & Use-Cases — How Big Projects Benefit
Here are published examples showing what these technologies achieve in practice.
Case Study: Olink Explore 3072 vs Mass Spectrometry in Plasma
Comparative evaluation of in-depth mass spectrometry and Olink Explore 3072 for plasma proteome profiling. (Sissala et al., 2024. DOI: https://doi.org/10.21203/rs.3.rs-6501601/v1)
- In 88 plasma samples, Explore 3072 measured ~2,923 proteins; MS (HiRIEF LC-MS/MS) in 120 samples measured ~2,578.
- Overlap ~1,129 proteins between the two, showing complementary coverage.
- Missing data (proteins below detection) less frequent in Olink data.
Use Case: UK Biobank Pharma Proteomics Project (UKB-PPP)
- Pilot phase measured ~3,000 proteins using Explore 3072 in >54,000 participant samples.
- Detected >14,000 genetic associations (pQTLs) across these proteins. Provides deep resource for hypothesis generation.
- The scope of the project is expanding: Explore HT will be used to profile all ~500,000 UK Biobank participants.
Big-scale Study Example: Regeneron Genetics Center
- RGC selected Olink Explore HT for a study of ~200,000 samples, taking advantage of its high throughput and large assay panel.
Designing Your Study for High Throughput Success
To extract maximal value from HT / 3072 proteomics, thoughtful planning is essential.
Define goals precisely:
- Are you aiming for discovery (novel proteins) or hypothesis testing (predetermined proteins)?
- Estimate effect sizes and variability—use pilot data or published variances from similar matrices.
Sample considerations:
- Source: plasma, serum, or other fluid. Each has pros/cons in background / interfering substances. Verify detection in your matrix.
- Sample volume and storage: freeze-thaw cycles degrade proteins; maintain consistency.
Logistics & lab capacity:
- Check instrument access (NGS sequencer for HT), lab automation for sample prep.
- Plan schedule: batching, QC, sequencing waiting times may introduce delays.
Data pipeline & analysis planning:
- NPX normalization; thresholds of detection; handling missingness.
- Statistical methods for differential expression, multiple testing.
Budget strategies:
- Phased approach: start modular, scale up.
- Negotiate with service providers or plan internal capacity, batch shipping etc.
Integrating with Other Omics & Translational Relevance
While these tools are not for diagnosis, they shine when integrated into broader biological research.
Multi-omics synergy: Combine proteomics with genomics (e.g. pQTL), transcriptomics, or metabolomics to build pathways. UKB-PPP is an exemplar.
Mechanistic studies: Use HT / 3072 to detect protein changes over time, under perturbations, drug treatment in vitro or in vivo.
Target discovery & validation: Identify proteins with genetic or expression support, then use follow-ups (antibodies, functional assays) in models.
Challenges, Limitations, and Mitigation Strategies
All technologies have boundaries; knowing them helps you avoid costly mistakes.
Key limitations:
- Lower signal precision or higher variability for very low-abundance proteins; detection limits may vary depending on matrix.
- Batch effects (plate, reagent lot, runtime) can influence results significantly at scale.
- Data missingness for proteins not expressed (or expressed at very low levels) in your sample type.
- Infrastructure and upfront costs: sequencers, lab automation, consumables.
Mitigation:
- Pilot studies to assess detection, variability.
- Design sample randomization, include controls, replicate samples.
- Plan QC pipelines; discard poor data early.
- Use conservative statistical thresholds; consider missingness patterns.
Advantages in Context: What Olink Brings Compared to Traditional & Alternative Methods
Understanding how Olink HT / 3072 compares clarifies when it's the right choice.
Speed & throughput: MS (especially deep fractionation) can reach high protein numbers but often with longer run times per sample. Olink HT allows tens of thousands of samples in compressed time frames.
Specificity & reproducibility: Dual-antibody PEA format reduces cross-reactivity. NPX normalization helps standardise.
Missing data and consistency: Case studies show fewer missing values and more consistent quantitation in Olink vs many MS workflows.
Cost per datapoint at scale: While unit cost may be higher than small multiplex panels, at high sample numbers the cost per protein/protein-data point tends to fall, particularly with HT.
To deepen your understanding of topics linked here, see these articles:
Olink's Plasma Proteomics: Unlocking Insights for Disease Research — for details on sample matrices, disease research, and translational context.
Olink Proteomics in Clinical Research: A Game Changer — helpful for seeing how non-clinical research often aligns with clinical-adjacent studies.
The Future of Proteomics: Where Olink Fits Into Emerging Technologies — for perspective on omics integration and upcoming technologies.
Conclusion & Action Steps
The Olink Explore HT and Explore 3072 formats bring high throughput, broad protein coverage, and efficient workflows that make ambitious non-clinical proteomics studies feasible. They enable you to handle large sample numbers, minimize sample input, and maintain data reliability—if you design and execute carefully.
What you can do next:
- Define your project needs: discovery vs validation, sample type, scale.
- Conduct a pilot with limited sample number and panels to benchmark detection, variability.
- Establish robust QC and data analysis pipelines in advance.
- Reach out to us to compare HT vs 3072 for your project, get estimates of cost, turnaround time.
Summary
Integrating this technical benchmarking extension deepens the article where researchers most need it: understanding not just what Explore HT / 3072 can do, but how they perform in comparative settings. It helps in choosing the best platform, anticipating limitations, and designing studies for robustness.
References
- A Technical Evaluation of Plasma Proteomics Technologies — Beimers et al., 2025. DOI: https://doi.org/10.1021/acs.jproteome.5c00221
- Correlations Within and Between Highly Multiplexed Proteomic Assays of Human Plasma — Rooney et al., Clin. Chem. 2025;71(6):677-687. https://doi.org/10.1093/clinchem/hvaf030
- Noora Sissala, Haris Babačić, Isabelle R. Leo et al. Comparative evaluation of in-depth mass spectrometry and Olink Explore 3072 for plasma proteome profiling, 05 May 2025, PREPRINT (Version 1) available at Research Square . https://doi.org/10.21203/rs.3.rs-6501601/v1


