
Plasma is one of the most information-rich biological materials available to researchers. It carries thousands of proteins that mirror both healthy physiology and early signs of disease processes. This complexity makes plasma an invaluable resource for biomarker discovery and functional studies.
Yet, traditional proteomics tools often fall short in capturing subtle but critical protein changes. This is where Olink proteomics analysis provides a decisive advantage. Using advanced proximity extension assay (PEA) technology, Olink enables researchers to study hundreds of proteins simultaneously from minimal plasma volumes with high precision.
In this article, we explore how Olink proteomics empowers plasma-based research. From mapping immune responses to identifying molecular signatures across different disease areas, Olink assays are shaping how the scientific community approaches translational discovery. For readers new to the platform, you can also review our primer on Introduction to Olink Proteomics for foundational concepts.
Why Plasma Matters in Modern Proteomics
Plasma is more than a simple transport medium; it reflects the dynamic state of the human body. Every protein circulating in plasma has the potential to serve as a marker of biological function, environmental response, or pathological change. This makes plasma an ideal sample type for broad proteomic studies.
A key advantage of plasma is accessibility. Unlike tissue biopsies, plasma can be collected using minimally invasive methods, enabling repeated sampling across large cohorts. This feature is especially valuable for longitudinal studies where researchers want to monitor protein changes over time.
However, plasma presents analytical challenges. The protein concentration spans more than ten orders of magnitude, with abundant proteins such as albumin masking the detection of lower-abundance biomarkers. Conventional techniques like ELISA often lack the sensitivity or throughput to capture this diversity.
This is where Olink proteomics provides a solution. By combining ultra-sensitive detection with multiplex capacity, Olink assays make it possible to map protein patterns in plasma that would otherwise remain hidden. For researchers considering deeper insights into panel structures, see our article on Exploring the Olink 96 and 48-Plex Panels.
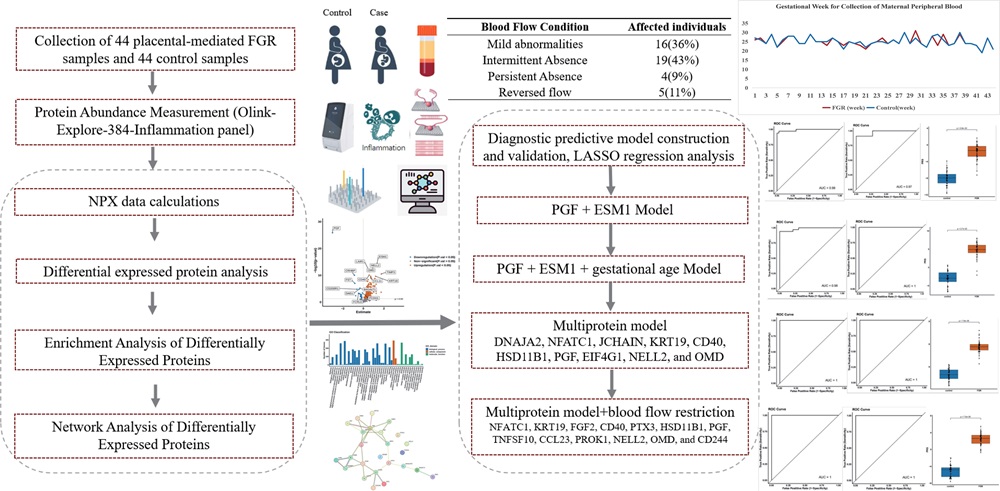 Figure 1. Workflow of Olink-Explore-384-Inflammation panel.
Olink Proteomics Analysis: Advantages Over Conventional Approaches
When designing plasma studies, researchers often choose among three main methods: ELISA, mass spectrometry (MS), and affinity-based multiplexed assays like Olink's Proximity Extension Assay (PEA). Olink proteomics combines the sensitivity of antibody binding with the amplification power of DNA-based detection. This hybrid approach yields several well-documented advantages over conventional methods.
Key Advantages of Olink PEA
1. High Sensitivity and Low Sample Volume
Olink PEA can detect proteins at very low concentrations (often pg/mL range) in plasma.
Only ~1-2 µL of plasma is needed for many panels, preserving precious sample material.
2. High Multiplexing Capability
A single run can assay dozens to thousands of proteins, depending on the panel (e.g., Olink Explore 3072 or Target 96 panels).
Allows comprehensive profiling of immune, metabolic, or signalling pathways without needing separate assays for each target.
3. Wide Dynamic Range and Robust Detection
The plasma proteome spans ~10 orders of magnitude in concentration. Olink PEA's panels effectively cover much of that range, enabling detection of both abundant and low abundance proteins without excessive sample processing.
Compared to MS workflows, PEA often shows fewer missing values across samples (i.e. more consistent detection). In the comparison of Explore 3072 versus deep MS (HiRIEF LC-MS/MS), Olink detected more proteins in a higher proportion of samples.
4. Streamlined Sample Preparation and Throughput
Olink workflows require less pre-processing: traditionally no need for depletion of high-abundance proteins or extensive fractionation that MS often requires. This reduces sample handling variability.
Throughput is higher for large sample sets, since panels allow many proteins to be assayed in parallel, and each run is relatively fast. This is especially valuable for studies with many samples (e.g. population or cohort studies).
Comparison with ELISA and Mass Spectrometry
| Feature | ELISA | MS (Mass Spectrometry) | Olink PEA / Olink Proteomics Analysis |
| Number of Proteins per Assay | Usually 1-5 targets | Potentially thousands (untargeted or data-dependent/independent acquisition) | Dozens to thousands (depending on panel) |
| Sample Volume Required | ~50-100 µL or more per assay | Often tens to hundreds µL depending on depth desired | ~1-2 µL for many panels; some high-plex Explore panels slightly more |
| Dynamic Range | Limited (especially for low-abundance proteins) | Broad, more so after fractionation or depletion; but with trade-offs in throughput and complexity | Broad dynamic range, capable of detecting low abundance proteins reliably without excessive depletion |
| Throughput & Scalability | Low – each target often run separately | Moderate to low for deep coverage, high cost & time per run | High throughput possible; panels allow many proteins & many samples with less hands-on time |
| Specificity / Reproducibility | Good, but limited by available antibodies; usually single target per assay | High for identified peptides; sequence/isoform resolution; but sample prep and missing data may reduce reproducibility for low-abundance proteins | High specificity due to dual-antibody requirement + DNA barcoding; fewer missing values; good reproducibility across panels |
Evidence from Real-World Comparative Studies
In a study comparing Olink Explore 3072 vs HiRIEF LC-MS/MS on 88 plasma samples, both platforms identified thousands of proteins. Olink detected more proteins in a larger fraction of samples, while MS offered somewhat wider unbiased coverage into very low-abundance and post-translationally modified proteins.
A large population cohort using PEA measured ~728 plasma proteins and showed strong performance in detecting low-abundance immune biomarkers, while MS workflows in the same cohort tended to miss many of those unless they used heavy fractionation.
When Conventional Methods Still Shine
While Olink's PEA offers many advantages, certain circumstances favour traditional approaches:
- If you need to discover novel, previously uncharacterised proteins or isoforms, untargeted MS is unmatched.
- For detailed analysis of post-translational modifications (phosphorylation, glycosylation, etc.), MS may provide better direct evidence.
- When samples are abundant and throughput is less limiting, MS with deep fractionation yields greater depth of proteome coverage.
Unlocking Cytokine Biology Through Plasma
Cytokines mediate key immune processes. Measuring their levels in plasma helps researchers track inflammation, immune signalling, and response to stimuli. The Olink Cytokine Panel offers a multiplexed, sensitive tool to capture dozens of cytokines simultaneously—with as little as 1 µL of plasma.
Why Plasma Cytokines Are Informative
- Plasma integrates systemic cytokine signals, reflecting both local and distal immune activity.
- Longitudinal sampling is possible, enabling detection of transient cytokine surges or declines.
- Multiplex panels avoid bias from selecting only a few cytokines; broader profiling reveals unexpected pathway involvement.
Technical Strengths of Olink Cytokine Panels
- High specificity through dual-antibody binding and DNA barcoding ensures reduced cross-reactivity. Olink's PEA design helps here.
- Wide dynamic range and high sensitivity allow detection of both abundant and scarce cytokines. In comparative tests, Olink's Target 48 Cytokine panel showed strong detectability even for low-abundance analytes that other multiplex systems missed.
- Minimal sample consumption is a major plus: only ~1 µL plasma is needed per cytokine panel.
Case Studies
Comparative Platform Study with the Olink Target 48 Cytokine Panel
Researchers compared Olink's 48-plex cytokine panel with MSD and Luminex platforms using overlapping analytes in plasma from healthy and inflamed subjects. The study found that Olink required far less plasma, had comparable or better linearity and precision, and detected more overlapping cytokines reliably across samples.
Inflammation-related Plasma Cytokine Profiling in the STELLAR II Trial Context
In a recent study, a set of 48 inflammation-associated proteins was measured in plasma samples using the Olink inflammation panel. This enabled clear distinctions in cytokine expression among groups, revealing patterns of immune activation relevant for mechanistic research.
Considerations and Best Practices
- Be aware of matrix effects: plasma versus serum may yield different quantification for certain cytokines. Always validate sample type in pilot studies.
- Standardize time points and pre-analytical handling (collection tubes, processing delays, freeze-thaw cycles) to reduce variation.
- Use controls and calibrators where available—panels like Olink's allow for both relative quantification (NPX units) and absolute quantification for many cytokines.
For more on immune signalling using Olink panels, see our resource Using Olink's Cytokine Panels for Immune System Research
Applications of Plasma Proteomics in Disease Research
Plasma proteomics is increasingly used in non-clinical research to uncover molecular signatures across disease models, stratify patient populations, and generate hypotheses for target discovery. Olink proteomics, with its high sensitivity and multiplexing, has featured prominently in research ranging from neurology to oncology. Below are real-world applications illustrating how researchers employ Olink assays to advance understanding in various disease areas.
1. Neurological Disorders: Alzheimer's Disease Biomarker Discovery
A large-scale study profiled ~1,200 plasma proteins using Olink Target 96 panels in Alzheimer's disease (AD) research. Jiang et al. discovered a 19-protein signature that distinguished individuals with AD from controls. The protein set also correlated with AD disease stage and hallmarks like amyloid and tau pathology. (Jiang et al., 2021.)
Key insight: plasma proteomics offers less invasive sampling compared to cerebrospinal fluid while retaining meaningful association with neurological processes. Researchers used this signature for staging, not for diagnosis.
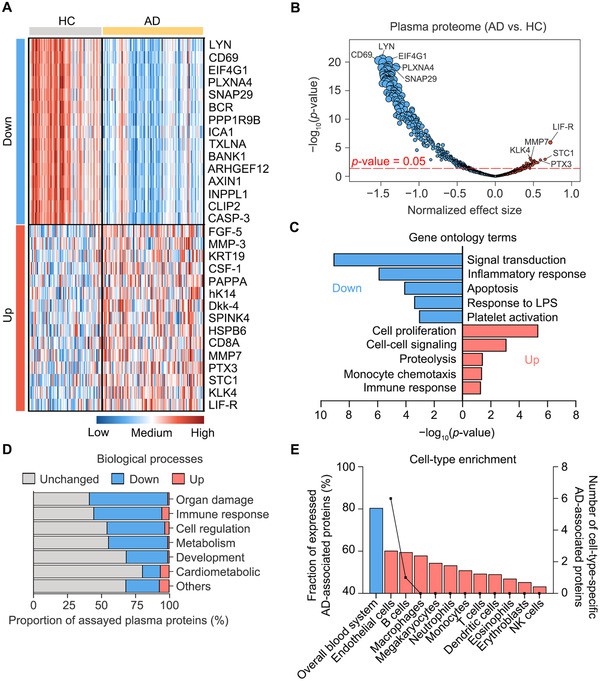 Figure 2. Alteration of the plasma proteome in patients with Alzheimer's disease (AD)
2. Oncology: Pan-Cancer Profiling and Early-Stage Tumour Signatures
Using the Olink Explore 3072 platform, a study measured over 3,000 plasma proteins in individuals with early-stage solid tumours (18 cancer types) vs healthy controls. Sex-specific multi-protein signatures achieved high discrimination (AUC ~0.98 in men, ~0.84 in women).
In another work, over 1,400 cancer patients' plasma profiles (1,463 proteins) were measured prior to treatment. Machine learning models identified protein sets associated with different cancer types.
3. Immune & Inflammation Research
A study in non-small cell lung cancer (NSCLC) looked at plasma immune-related proteins via Olink's 92-protein immune panel. Researchers found predictive biomarkers for response to immuno-chemotherapy by integrating plasma proteomics with transcriptomics. (Annals of Oncology, NSCLC study, 2024)
4. Platform Comparison & Methodological Insights
A recent preprint, The Current Landscape of Plasma Proteomics, compared SomaLogic, Olink, and various mass spectrometry technologies across the same cohort. It assessed differences in detection sensitivity, protein coverage, and reproducibility. Findings helped clarify when Olink assays outperform or complement MS.
Another technical evaluation comparing Olink Explore HT vs MS-based methods revealed trade-offs in depth vs throughput, demonstrating that Olink panels yield fewer missing values across many large sample sets. (ScienceDirect, "Technical Evaluation of Plasma Proteomics Technologies", 2025)
5. Lessons for Research Use
- Using such studies, researchers can choose protein panels tailored to their disease model—e.g. nervous system disease, tumour biology, immunology.
- Population diversity matters: sex, age, sample processing and cohort size affected signature robustness (e.g. in the pan-cancer and AD studies).
- Analytical pipelines matter: combining proteomics with transcriptomics or machine learning improves power for discovering novel mechanistic insights.
Choosing the Right Olink Plasma Assay for Your Project
When planning a plasma proteomics project, selecting the appropriate Olink assay panel is critical. Key variables include sample volume, number of proteins (plex level), turnaround time, cost, and the biological focus (e.g., cytokines, inflammation, neurology). The table below compares several commonly used Olink panels to help you choose wisely.
| Panel | Number of Proteins / Targets | Sample Volume Required | Readout Type | Best Use Cases / Strengths | Trade-offs / Considerations |
| Target 48 | ~45 immune / cytokine-related proteins per panel | 1 µL plasma (per panel) | qPCR or NPX-relative quantification; some panels offer absolute units (pg/mL) | Ideal when profiling immune or inflammatory signatures with low sample volume; good for focused biomarker discovery or validation studies | Covers fewer proteins—less suited when you need broad pathway coverage; fewer unique targets vs high-plex platforms |
| Target 96 | ~92 targets per panel; many disease / biology-oriented panels (inflammation, oncology, cardiometabolism, neurology etc.) | ~1 µL plasma per panel | Relative quantification (usually NPX); some absolute quant units for certain targets | Use when you want to cover dozens of proteins across multiple biological pathways without moving to very high plex; mid-size cohorts; hypothesis generation within known biology | May still miss very low abundance proteins; more expensive per panel vs smaller panels; data complexity increases with number of targets |
| Explore / High-Plex (e.g. Explore 3072 / Explore-HT) | Thousands of proteins (e.g. ~2,900+ in some Explore panels) covering many pathways | ~1-2 µL plasma depending on platform and panel type | Typically NGS-based readouts for the high-plex panels; relative quantification but good coverage | Best for discovery-scale projects, large-scale cohort profiling, or mechanism‐broad pathway mapping when you want many potential biomarkers or novel targets | Cost will be higher; data analysis much more complex; more stringent sample quality and batch effect control needed |
| Flex / Focus (Custom / Lower-Plex Panels) | Up to ~21 proteins (custom or pre-validated list) | ~1 µL plasma per custom panel | qPCR / NPX or absolute quantification for particular targets where available | Good if you have a specific hypothesis or set of targets already, want to validate findings from high-plex screens, or want bespoke panels for your models | Less discovery potential; upfront cost to design custom panel; may have longer lead time for custom reagents or assay development |
Practical Guidance for Panel Selection
- Pilot your samples: Run small sample sets across multiple panels (e.g., a Target 48 vs a Target 96) to see which meets detectability, dynamic range, and variation needs for your proteins of interest.
- Match sample type and handling: Make sure plasma vs serum, collection tubes, and storage protocols align with the assay's validation. Differences can affect quantification.
- Balance cost, throughput, and sample budget: High-plex panels cost more in reagents and analysis. If number of samples is high, bulk discounts or batching may matter.
- Account for bioinformatics capacity: High-plex panels generate larger datasets. Ensure your team has capacity for normalization, multiple testing correction, etc.
- Consider future scalability: If a pilot reveals promising targets, pick panels that allow easy scaling or overlap (e.g., that share some proteins) to facilitate follow-up validation.
Integrating Plasma Proteomics with Other Omics
Integrating plasma proteomics with other omics layers—transcriptomics, metabolomics, and genomics—amplifies biological insight. Rather than viewing proteins in isolation, this combined approach reveals regulatory relationships, causal paths, and richer mechanistic hypotheses. Below are key use cases, methods, and best practices for integrating Olink proteomics data with other omics sources.
Why Multi-Omics Integration Adds Value
- Provides insight into whether changes in protein levels stem from gene expression changes, metabolic flux, or post-translational regulation.
- Enhances robustness of biomarker or target discovery by requiring consistency across layers (e.g., gene → protein → metabolite).
- Helps in constructing more precise mechanistic models; e.g., linking genetic variants (pQTLs) to transcriptional regulation and downstream metabolic effects.
Recent Studies Illustrating Integration
1. Proteogenomics & Disease-Trait Mapping
A large-scale UK Biobank study measured plasma proteins with Olink Explore 3072 in over 50,000 individuals. By integrating protein quantitative trait loci (pQTLs), genome-wide association studies (GWAS), and transcriptomics, researchers identified nearly 938 genes whose variants affect plasma protein levels and are linked to disease phenotypes. This integration helps prioritize potential therapeutic targets.
2. Olink Proteomics + Transcriptomics in Stem Cell / Inflammation Research
A 2025 study used Olink proteomics and transcriptomic profiling on Mesenchymal Stem Cells (MSCs) following stimulation with TNF-α. They found that in addition to upregulated inflammatory proteins, many genes associated with stemness, cell migration, and differentiation changed in expression. These combined findings revealed that TNF-α impairs MSC regenerative capacity via coordinated changes at both protein and transcript level.
3. Acute Kidney Injury (AKI) in Mouse Models
Researchers employed Olink to profile inflammatory proteins in plasma from multiple AKI mouse models. They integrated these data with transcriptomics datasets (genes upregulated in kidney tissue or other models of AKI). Two proteins/genes—CXCL1 and TNFRSF12A—were upregulated at both levels. This suggests that these markers may reflect systemic inflammatory response as well as local gene expression change during AKI.
4. Proteomics + Metabolomics: Metabolic Landscapes in Disease
In breast cancer research, one study combined untargeted metabolomics and quantitative proteomics in plasma. They found altered metabolic pathways (e.g. glutamate, arginine biosynthesis) and identified several proteins (GOT1, LDHB, GPX3) that aligned with metabolite changes. That helped delineate metabolic dysregulation characteristic of cancer biology.
Practical Approaches and Best Practices
| Step | Key Consideration |
| Data Matching & Sample Synchrony | Ensure that proteomics, transcriptomics (or other omics) are done on the same or comparable samples. Time points, sample handling, and processing should be consistent. |
| Normalization & Batch Effects | Different omics modalities often have different scales, detection limits, missing data. Use robust normalization techniques (e.g., quantile normalization, variance modelling) and account for batch effects. |
| Statistical Integration Methods | Methods such as correlation networks, pathway enrichment, co-expression analysis, pQTL mapping, and Mendelian Randomization (MR) help define causal or directional relationships. |
| Bioinformatics Expertise | Teams must have skills in cross-omics pipelines, integrative tools (e.g., Multi-Omics Factor Analysis, network inference) and visualization (e.g., pathway maps). |
| Validation Across Layers | Findings should ideally be validated in multiple omics-layers. For example, a gene whose transcript is upregulated, whose protein is elevated, and whose metabolite is consistent can build stronger mechanistic confidence. |
For more guidance on combining Olink proteomics assays with other data types, see How to Integrate Olink Proteomics with Other Omics Technologies.
Turning Plasma Data Into Actionable Insights
Generating plasma proteomics data is only half the journey. To translate that data into useful insights, researchers must adopt rigorous analytical practices, thoughtful interpretation, and validation steps. Below are concrete strategies for turning Olink plasma proteomics into outputs you can act on in your R&D workflows.
Best Practices for Making Data Usable
Ensure Data Quality from the Start:
Collect plasma under consistent pre-analytical conditions (same tube type, processing time, freeze-thaw cycles). Poor sample handling introduces noise, especially for low-abundance proteins.
Normalize and Control for Batch Effects:
Use internal controls, replicate samples, and normalization methods. Olink assays provide NPX (Normalized Protein Expression) as relative quantification; ensure uniform handling across batches to make comparisons valid.
Focus on Reproducibility and Statistical Rigor:
Apply appropriate multiple testing corrections when assessing differential protein levels. Use independent cohorts (if possible) to replicate findings.
Integrate Multiple Data Layers:
Combine proteomics with transcriptomics, metabolomics, or genomics to verify whether protein changes reflect upstream regulation or downstream effects. This helps in prioritising proteins by biological plausibility.
Leverage Bioinformatics and Machine Learning:
Use clustering, network analysis, and predictive modelling to group proteins into functional signatures. For example, recent studies using Olink panels with machine learning have identified multi-protein signatures predictive of disease progression in cohort settings.
Use Public Data and Standards for Context:
Compare your findings with proteomics datasets in public repositories. Also adhere to reporting standards (such as those developed by the HUPO Proteomics Standards Initiative) to make your data useful to others.
Next Steps: From Insight to Inquiry
To move from insight to action in your own research projects:
- Begin with a pilot study to test assay sensitivity and panel suitability in your specific sample type.
- Document your experiment and metadata carefully: sample source, processing, storage, assay panel, dates, etc.
- If you identify promising proteins or signatures, plan follow-up validation (e.g., in another cohort, or using orthogonal assays).
- Share findings internally or in preprint form to generate feedback and build collaborations.
Call to Action
If your lab or CRO group is ready to harness plasma proteomics using Olink assays, contact us to:
- discuss which Olink panel fits your protein targets and sensitivity needs
- plan the workflow from sample collection to data interpretation
- get support integrating proteomics results into your broader discovery or mechanistic research pipeline
Explore how we can partner to accelerate your proteomics-based research.
References
- Petrera A, von Toerne C, Behler J, Huth C, Thorand B, Hilgendorff A, Hauck SM. Multiplatform Approach for Plasma Proteomics: Complementarity of Olink Proximity Extension Assay Technology to Mass Spectrometry-Based Protein Profiling. J Proteome Res. 2021
- Noora Sissala., et al. (2023). "Comparative evaluation of in-depth mass spectrometry and Olink Explore 3072 for plasma proteome profiling" Research Square, 2025
- Beimers WF., et al. A Technical Evaluation of Plasma Proteomics Technologies. bioRxiv [Preprint]. 2025 Jan 13:2025.01.08.632035. doi: 10.1101/2025.01.08.632035. 2025
- https://www.olink.com/question/how-is-the-limit-of-detection-lod-estimated-and-handled
- Olink proteomics data Version 1.0
- Bao XH, Chen BF, Liu J, Tan YH, Chen S, Zhang F, Lu HS, Li JC. Olink proteomics profiling platform reveals non-invasive inflammatory related protein biomarkers in autism spectrum disorder. Front Mol Neurosci. 2023
- Jiang Y, Zhou X, Ip FC, Chan P, Chen Y, Lai NCH, Cheung K, Lo RMN, Tong EPS, Wong BWY, Chan ALT, Mok VCT, Kwok TCY, Mok KY, Hardy J, Zetterberg H, Fu AKY, Ip NY. Large-scale plasma proteomic profiling identifies a high-performance biomarker panel for Alzheimer's disease screening and staging. Alzheimers Dement. 2022
- Hu, Z. et al. 1344P Plasma proteomics indicated predictive biomarkers for immuno-chemotherapy in stage IIIB-IV non-small cell lung cancer without EGFR/ALK alterations. Annals of Oncology, Volume 35, S850
- Zhou, Y., Xiao, J., Peng, S. et al. The Integration of Olink Proteomics with Transcriptomics Elucidates that TNF-α Induces Senescence and Apoptosis in Transplanted Mesenchymal Stem Cells. Stem Cell Rev and Rep 21, 2298–2309 (2025).


