
Why Proteomics Matters in Today's Research
Proteins are the workhorses of cells. They carry out functions that genes encode, mediate cell signalling, and respond to environmental changes. For research labs and pharma R&D teams, understanding protein levels and interactions can reveal mechanisms, indicate response to perturbations, and aid in biomarker discovery.
In recent years, proteomics has become essential because:
- Many biological questions (e.g. immune modulation, stress responses) require detection of low-abundance proteins.
- Sample amounts are often limited (e.g. precious tissue, rare cell populations).
- Multiplexed readouts (many proteins in a single run) accelerate throughput and reduce cost per measurement.
Olink proteomics analysis has emerged as a leading method to address these challenges. By combining high specificity, multiplexing, and low sample requirements, Olink lets researchers measure dozens to thousands of proteins from small volumes. This helps non-clinical studies uncover subtle protein changes, characterize signalling networks, and guide hypothesis generation.
What Makes Olink Proteomics Different
Olink proteomics uses Proximity Extension Assay (PEA) technology. Two antibodies bind different parts of the same target protein. Each antibody carries a unique DNA oligonucleotide. When both antibodies bind, the oligos come close and hybridize. A DNA polymerase extends them, creating a barcode. That barcode is amplified (by qPCR or NGS) and quantified. This dual-recognition system delivers high specificity and low background.
Key strengths of Olink assay in non-clinical research:
- High sensitivity: Able to detect low-abundance proteins (fg/mL levels) even in complex fluids like plasma or cerebrospinal fluid.
- Low sample volume: Often only 1-6 µL needed per run for large panels. Helpful when sample is limited
- Multiplexing capability: Panels ranging from dozens of proteins (e.g. 48-plex, 96-plex) up to thousands in the Reveal/Explore series.
- Broad matrix compatibility: Works with plasma, serum, CSF, tissue lysates, etc., giving flexibility in sample types.
Technical Caveats & Comparisons
- Antibody-based approach means you are limited to predefined targets (you won't discover entirely novel, unexpected proteins the way LC-MS might).
- Dynamic range is good but may not always match depth of deep mass spectrometry in detecting extremely rare proteoforms.
- Panel design matters: whether the antibodies have been validated in your sample matrix, cross-reactivity, lot-to-lot reproducibility.
Clinical Applications of Olink Proteomics
In non-clinical research, Olink proteomics offers powerful tools to probe immune signalling, inflammation, and protein biomarkers across diverse biological systems. Below are examples and use-cases that research project managers and R&D teams will find practically relevant.
Key Use-Cases for Non-Clinical Studies
Cytokine profiling in immunology research. The Olink Cytokine Panel enables simultaneous measurement of tens of cytokines, chemokines, and interleukins, allowing labs to map immune responses under different treatments or stimuli without needing separate assays for each.
Monitoring perturbations in experimental models. Whether using cell culture, animal models, or organoids, changes in protein expression (e.g. following knock-down or overexpression) can be sensitively measured. Olink assays can detect fold changes in low-abundance proteins that might be missed by single-plex ELISA.
Translational discovery in population and cohort studies. Using large sample sets (human or model organism), researchers can discover protein signatures linked to experimental conditions, physiological states, or biomarkers of interest for further validation.
Supported Case Studies
Two real-world studies demonstrate Olink's utility in non-clinical / research-adjacent settings:
Olink Reveal with NIST SRM-1950 and Spike-In Standards
Researchers used the Olink Reveal platform to quantify ~1,000 proteins in a standard human plasma reference (NIST SRM-1950), adding recombinant proteins (IL-10 and VEGF-D) at defined concentrations. The study confirmed excellent linearity (R² ~ 0.92–0.95), sensitivity, precision, and accuracy across spike-ins. These results affirm Reveal's ability to deliver reliable relative quantification in large-scale proteomic experiments.
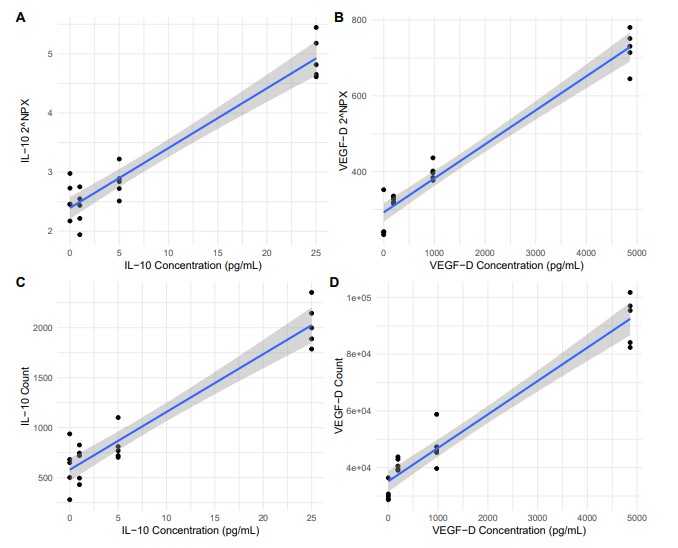 Figure 1: NPX values (log2 and median normalized) for IL-10 (A) and VEGF-D (B), and raw read counts for IL-10 (C) and VEGF-D (D).
Population Proteomics in Prediabetes / Diabetes Cohort
In the Białystok PLUS cohort (~500 participants), the Olink Reveal panel measured nearly 1,000 proteins in plasma. Researchers correlated protein levels with standard metabolic measures (e.g. HbA1c, oral glucose tolerance tests). They found many proteins showing statistically significant associations with glucose metabolism patterns, enabling novel hypotheses about early metabolic regulation.
Practical Recommendations for R&D Teams
- Ensure your sample prep is consistent; small deviations can influence detectability, particularly for low-abundance analytes.
- When planning multiplex panels, check whether your targets are represented in Olink's panels—especially the Cytokine Panel. If not, custom panel development may be needed.
- Consider replicates and plate controls: multiple replicates across plates improve reliability and help control for technical variation.
Addressing Common Research Concerns & Alternatives to Olink Proteomics
When selecting a protein detection platform for non-clinical research, project leads must trade off sensitivity, throughput, cost, and discovery potential. Below are common concerns researchers face, plus how Olink compares to alternatives like ELISA, Luminex, and mass spectrometry (MS).
Common Concerns R&D Teams Have
- Sensitivity / Detectability: Can the platform detect very low-abundance proteins reliably?
- Sample volume and matrix compatibility: Do you require µL amounts? Fluid types like plasma/serum vs lysates?
- Multiplex scale vs custom targets: Need many proteins in one run versus a few key ones?
- Reproducibility and batch effects: Can results be compared across runs, labs, or batches?
- Cost and throughput: How many samples per batch? What is per-sample cost?
Alternatives to Olink & Trade-Offs
Below is a comparison of Olink with other popular platforms, based on recent literature.
| Platform | Strengths | Limitations | When to Consider Alternative |
| ELISA (single-plex / small multiplex) | High specificity; well established; relatively simple setup | Low throughput; high sample volume; limited multiplexing; labour intensive for many proteins | Best when you need absolute quantification for 1-5 well-characterised targets |
| Luminex / Bead-based Multiplex Immunoassays | Moderate multiplexing; more cost-efficient for mid-scale (10-100 proteins); many labs already have the instrumentation | Lower sensitivity for some analytes; more background/cross-reactivity; higher sample volume (vs Olink) | Useful for profiling many proteins but when very low abundance detection isn't critical |
| Mass Spectrometry (MS; discovery workflows, DIA etc.) | Unbiased detection; can identify novel proteins, proteoforms, post-translational modifications; large proteome coverage | Requires more sample prep; larger volumes; more complex data analysis; lower throughput in many workflows | Ideal in discovery-phase studies or to validate findings from affinity-based assays |
Practical Takeaways: What to Use When
- Choose Olink proteomics / Olink Cytokine Panel when you need medium to high multiplexed profiling, excellent sensitivity with small sample volumes, and well-validated panels for known proteins.
- Use Luminex or MSD if you need moderately multiplexed immunoassays and cost or instrumentation is constrained; acceptable if sensitivity isn't pushed to extremes.
- Use ELISA when focusing on 1-3 targets, where absolute quantification is critical, or for validation after discovery.
- Use mass spectrometry during hypothesis generation, proteome discovery, or when looking for novel biomarkers or post-translational modifications not covered by pre-defined panels.
How Olink Data Drives Research Decisions
Reliable protein measurement is only useful if it meaningfully guides experiments, hypothesis generation, or downstream validation. This section shows how Olink's data supports decision making in academia, pharma R&D, and cohort studies.
From Data to Insight: Key Advantages
Relative quantification with consistency. Olink proteomics delivers comparable measures across samples even when working with different batches or sample matrices. For example, using paired serum and EDTA plasma samples, the serum-to-plasma ratios for many proteins were stable; after proper normalization, correlation coefficients between different studies were ≥ 0.93.
High throughput with broad coverage. Platforms like Olink Reveal quantify over 1,000 proteins in a single run, spanning many biological pathways (especially immune response and inflammation). Sample volume is small (≈ 4 µL plasma or serum).
Technical reproducibility and precision. In the Reveal platform evaluation (using NIST SRM-1950 human plasma and spike-in proteins such as IL-10 and VEGF-D), linearity (R² ~ 0.922-0.953), sensitivity, and precision were all strong. This supports confidence in detecting fold-changes in non-clinical/proof-of-concept work.
Implications for Research Planning
Designing experiments with confidence. When you expect subtle changes (for example, under treatment, stress, or knock-outs), choose Olink assays capable of detecting low-abundance proteins with high reproducibility (like Reveal or high‐plex panels).
Matrix consistency matters. Ensure you know which sample matrix (serum, plasma, etc.) you use, and where possible, stick with it. If mixing matrices, use normalization methods validated in literature.
Control for batch effects. Including bridging samples or technical replicates helps adjust for variation over time or across lots. Some published Olink work shows that with proper normalization, inter-study CVs drop significantly.
Case Study: Biomarker Discovery in Population-Scale Proteomics
This section illustrates how Olink Reveal has been used in large, well-powered non-clinical studies to uncover protein signatures, with strong relevance for hypothesis generation and translational research.
Białystok PLUS Cohort: Prediabetes & Diabetes Biomarkers
Study design: ~2,839 adults were screened in the Białystok PLUS Cohort; 508 non-diseased individuals (aged 35-70) were selected (healthy, prediabetes, and newly diagnosed type 2 diabetes). Plasma samples profiled with Olink Reveal (~1,000 proteins).
Key findings:
Mean detectability across assays was ~79%, with many proteins showing >99% detectability in healthy individuals.
37 proteins showed statistically significant associations with HbA1c; 22 associated with oral glucose tolerance test (OGTT) at multiple time points.
Proteins like BAIAP2, NAGK, MS4A1, and HSD11B1 stood out as potential biomarkers differentiating prediabetes / diabetes states.
- Research implications:
- Generated hypotheses about metabolic regulation well before overt disease.
- Provides candidates for follow-up functional studies or targeted validation in model systems.
Technical Evaluation: NIST SRM-1950 Standard + Spike-In Proteins
Setup: Using the human plasma reference standard NIST SRM-1950, recombinant IL-10 and VEGF-D were spiked at various concentrations. The Olink Reveal platform measured ~1,034 proteins spanning many biological pathways.
Performance results:
Linearity (R²) for both IL-10 and VEGF-D across spike-in ranges was excellent (≈ 0.922 ‒ 0.953). Precision and accuracy were strong even at low concentrations, supporting Reveal's utility in detecting subtle changes in protein abundance.
What this means for researchers:
- Confidence that low-abundance biomarkers can be reliably quantified.
- Strong baseline for using Reveal in large-scale cohorts or comparative studies.
Ensuring Data Quality: Reproducibility, Matrix Effects, and Validation
For researchers relying on Olink proteomics, high data quality is essential. This section covers key technical concerns—reproducibility, sample matrix issues, validation steps—and gives guidelines to maintain rigorous standards in non-clinical research.
Reproducibility & Cross-Matrix Consistency
A recent study used the Olink Explore panel to measure 1,463 proteins in matched serum and plasma from 19 samples. They found many proteins showed good correlation across matrices, though some proteins varied significantly depending on whether sample was serum or plasma. This suggests when planning large studies, sample type consistency matters.
Olink's white paper "Multiplex high-throughput proteomics with exceptional analytical specificity" (Explore 3072) reports 99.7% of assays tested showed no cross-reactivity and minimal background, even with high multiplexing. Sample volume was only ~ 6 µL per test.
Matrix Effects and Sample Handling
Different sample matrices (plasma vs serum vs CSF vs tissue lysate) have different cofactors, proteases, and potential inhibitors. These can influence antibody binding or the PEA reaction.
The matched serum-plasma study noted that some proteins detectable in one matrix may be suppressed or show signal shift in the other. Proper normalization is needed.
Sample storage, freeze-thaw cycles, anticoagulant choice (e.g. EDTA vs citrate vs heparin), and hemolysis can also contribute to variability. Researchers should include QC samples to monitor these.
Validation & Quality Controls for Reliable Results
Use built-in Olink QC metrics: NPX (Normalized Protein Expression) values, limit of detection (LOD), inter-plate controls. Olink documentation provides normalization, QC, and NPX calculation methods.
When using large multiplex panels (e.g. Explore 3072), include technical replicates and bridging samples across batches to assess batch effects.
Validate findings in a secondary method when possible (e.g. targeted MS or ELISA), especially for key candidate proteins to confirm trends.
Design experiments with these in mind: consistent sample collection protocols, standardised handling, and blinded processing to reduce bias.
Final Thoughts & Next Steps
Olink proteomics offers powerful tools for non-clinical research: high multiplexing, small sample volume requirements, and robust reproducibility make it ideal for biomarker discovery, cohort studies, and hypothesis generation. When researchers design studies carefully, accounting for matrix effects, technical variation, and proper validation, Olink data can reveal new biology with confidence.
Key Takeaways
In the Christensen et al., 2022 study, using the Olink 92-plex panel, matched serum and EDTA plasma showed strong correlation for ~44/92 proteins; after normalization, inter-study coefficient of variation (CV) dropped from ~42% to ~26%.
Plasma often provides more stable signatures than serum in certain settings. For example, in a study of pregnancy-related protein signatures, plasma showed higher predictive power vs serum for gestational age models.
Comparisons between Olink and aptamer-based platforms (SOMAscan) in epidemiological settings show that Olink has greater stability for many proteins in delayed processing or across time.
In technical evaluations (e.g., "A Technical Evaluation of Plasma Proteomics Technologies") Olink Explore HT detected about ~2,600 proteins with strong reproducibility; while MS-based methods may have higher depth in some cases, Olink offers a favorable balance of throughput, sensitivity, and ease of sample handling.
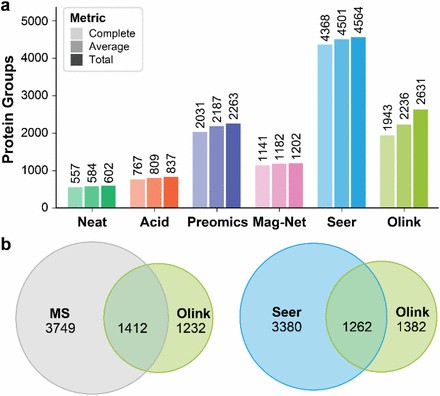 Figure 2. Depth of proteomic analysis afforded by the olink methods.
What to Do Next (for Research Teams)
Define your goals up front
Decide what you want: discovery of new biomarkers, quantification of known targets, cohort profiling, or combination. The panel choice (Target 48/96, Explore, Reveal) depends on that.
Select matrices and handling protocols carefully
Use consistent sample type (plasma vs serum) across all collections. If mixing types, use normalization methods validated in literature. Include QC for freeze-thaw, storage, and processing delays.
Include technical replicates and bridging samples
To monitor inter-batch variation, use the same sample(s) across plates or across panel versions. The Christensen et al. paper shows these bridging tools make longitudinal comparisons possible over years
Plan for orthogonal validation
If you identify interesting protein hits, verify with alternative methods (e.g. ELISA, MS) to confirm findings, especially if they will form the basis for downstream publications or development.
Leverage multi-omics when possible
Combining proteomics (via Olink) with genomics, transcriptomics, or clinical metadata often yields deeper insights. Many recent studies have used Olink as part of proteogenomic / multiomics pipelines.
Call to Action
If you're planning a research project involving protein profiling, consider discussing your study design with an Olink proteomics service provider. We help with panel selection, sample handling protocols, normalization approaches and result validation.
To get started:
Explore How Olink's Cytokine Panel Accelerates Inflammation Research for immune-signaling work.
Read Case Study: Using Olink Proteomics to Investigate Cancer Biomarkers for how large-scale cohorts used Olink in biomarker discovery.
Review Introduction to Olink Proteomics: What You Need to Know to familiarise yourself with PEA technology and panel options.
If you like, I can send you a draft of the full article combining all sections, for final edits and formatting.
References
- van der Burgt Y, de Meijer E, Palmblad M. Evaluation of Olink Reveal Proximity Extension Assay for High-Throughput Proteomics: A Case Study Using NIST SRM 1950 and Spike-In Protein Standards. ChemRxiv. 2025; doi:10.26434/chemrxiv-2025-0pvmg This content is a preprint and has not been peer-reviewed.
- Jiang Y, Zhou X, Ip FC, Chan P, Chen Y, Lai NCH, Cheung K, Lo RMN, Tong EPS, Wong BWY, Chan ALT, Mok VCT, Kwok TCY, Mok KY, Hardy J, Zetterberg H, Fu AKY, Ip NY. Large-scale plasma proteomic profiling identifies a high-performance biomarker panel for Alzheimer's disease screening and staging. Alzheimers Dement. 2022
- Hu, Z. et al. 1344P Plasma proteomics indicated predictive biomarkers for immuno-chemotherapy in stage IIIB-IV non-small cell lung cancer without EGFR/ALK alterations. Annals of Oncology, Volume 35, S850
- Zhou, Y., Xiao, J., Peng, S. et al. The Integration of Olink Proteomics with Transcriptomics Elucidates that TNF-α Induces Senescence and Apoptosis in Transplanted Mesenchymal Stem Cells. Stem Cell Rev and Rep 21, 2298–2309 (2025).


