
What is Olink Explore Data Analysis?
The Olink Explore platform represents a groundbreaking advancement in proteomic research, enabling simultaneous measurement of thousands of proteins with exceptional specificity and sensitivity. The 1536 and 3072-plex panels offer researchers unprecedented insights into the human proteome, allowing for comprehensive biomarker discovery, pathway analysis, and therapeutic target identification. However, the wealth of data generated by these high-plex platforms demands sophisticated analytical approaches to extract meaningful biological insights.
This article provides practical guidance for researchers seeking to optimize their data analysis workflow, with particular emphasis on data standardization, batch effect correction, and pathway enrichment strategies that are essential for robust proteomic research.
The complexity of Olink data analysis stems from several factors:
- The high-dimensional nature of the data (thousands of proteins across typically hundreds of samples)
- Technical variability introduced during sample processing
- The need for appropriate statistical methods that account for the multipletesting burden inherent in proteomic studies
- Furthermore, the unique characteristics of immunoassay-based quantification require specialized normalization approaches distinct from those used in transcriptomic or genomic studies.
By implementing the tips and strategies outlined in this article, researchers can maximize the value of their Olink data and avoid common pitfalls that compromise biological interpretations.
Data Normalization Strategies for Olink Data
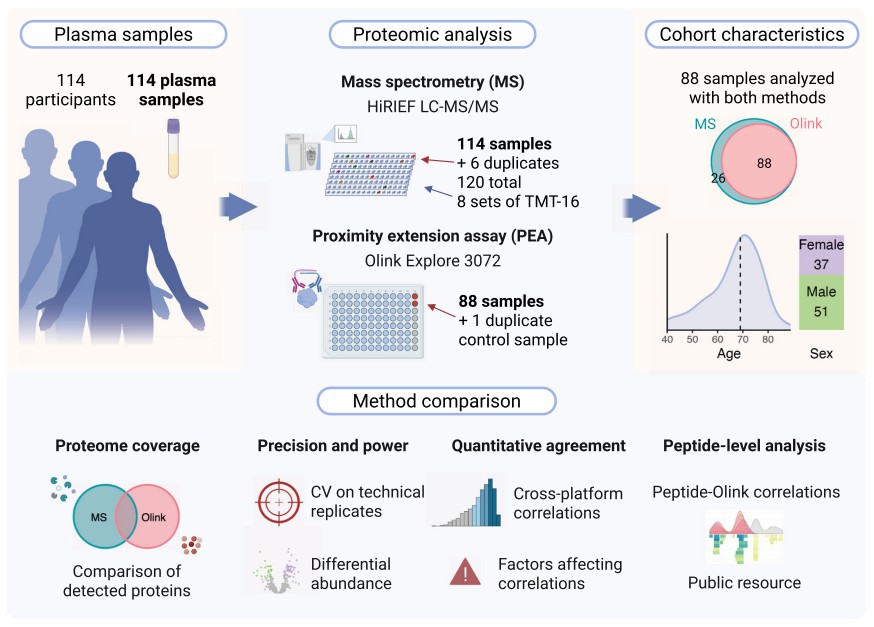 Figure 1: The complete technical process of Olink platform from sample collection to data analysis. (Sissala, N. et al., 2025)
1. Understanding Data Distribution Characteristics
Before applying any normalization technique, it is crucial to understand the distribution properties of your Olink data. Proteomic data often exhibits right-skewness due to the presence of high-abundance proteins, and normalization methods must account for this characteristic. Begin by visualizing your data using density plots or histograms to assess the overall distribution pattern. This preliminary step informs the choice of normalization method and helps identify potential outliers that might disproportionately influence the normalization process:
- Assess skewness and kurtosis: Calculate these distribution metrics for each sample to quantify departures from normality. Samples with extreme values may indicate technical issues that need to be addressed before proceeding with normalisation.
- Visualize with boxplots: Create boxplots of protein expression values for each sample to identify differences in median expression and variability across samples. Systematic differences in medians often indicate the need for normalization.
- Check for missing data patterns: Identify whether missing values are randomly distributed or concentrated in specific samples or protein groups. Non-random missingness may indicate technical biases that should be considered during normalization.
2. Selecting Appropriate Normalization Techniques
Normalization aims to remove technical variability while preserving biological signals. For Olink data, the optimal normalization approach depends on the experimental design and data quality. Research has shown that the choice of normalisation method can significantly affect downstream analyses, including differential expression and pathway enrichment results.
- Min-max normalization: This technique rescales the data to a fixed range, typically [0, 1]. It is particularly useful for Olink data when you need to compare relative changes across proteins with vastly different absolute abundances. The formula is: v' = (v - minA)/(maxA - minA) * (new_maxA - new_minA) + new_minA, where v is the original value, minA and maxA are the minimum and maximum values of feature A, and new_minA and new_maxA define the new range.
- Z-score normalization: This method transforms data to have a mean of 0 and standard deviation of 1. It is advantageous when you want to emphasize patterns of relative variation across proteins. The formula is: v' = (v - μ)/σ, where μ is the mean and σ is the standard deviation. This approach helps compare protein expression across different samples by placing all measurements on a comparable scale.
- Decimal scaling: This technique normalizes by moving the decimal point of values, which can be useful for reducing the impact of extreme outliers. The formula is: v' = v/10^j, where j is the smallest integer such that max(|v'|) < 1.
Table: Comparison of Normalization Methods for Olink Data
| Method | Best Use Case | Advantages | Limitations |
| Min-max | Comparing relative changes across proteins | Preserves original relationships; intuitive interpretation | Sensitive to extreme outliers |
| Z-score | Analyzing patterns across samples | Creates a standard scale; handles skewness well | Assumes normal distribution |
| Decimal scaling | Data with extreme outliers | Reduces outlier impact; simple calculation | May over-compress data range |
3. Implementing Normalization in Practice
Proper implementation of normalization techniques requires attention to computational details and validation of results. The following steps ensure that normalization improves data quality without introducing artifacts:
- Apply methods consistently: Use the same normalization approach across all samples in a study to maintain comparability. Calculate normalization parameters from control samples or pooled references when available.
- Validate effectiveness: Post-normalization, reassess data distributions to confirm reduction of technical variability. Visualisation techniques, such as Principal Component Analysis (PCA), before and after normalisation can help assess the procedure's effectiveness.
- Document parameters: Keep detailed records of all parameters used in normalization (e.g., reference samples, scaling factors) to ensure reproducibility and facilitate meta-analyses.
Batch Effect Correction Methods
1. Identifying Batch Effects in Olink Data
Batch effects represent systematic technical variations introduced when samples are processed in different groups (e.g., different plates, different days, or by different technicians). In Olink studies, where large sample sets are often processed in multiple batches, identifying and correcting for these effects is crucial for valid biological interpretations. Left uncorrected, batch effects can create false associations or mask true biological signals.
- Visual detection methods: Use PCA to visualize sample clustering by batch. If samples cluster more strongly by processing batch than by biological groups, batch effects are likely present. Similarly, correlation heatmaps can reveal batch-related patterns.
- Statistical tests: Employ statistical methods such as ANOVA to quantify the variance explained by batch versus biological factors. A significant association between protein expression and batch identifier indicates the need for correction.
- Positive controls: Monitor control samples included in each batch. Systematic differences in control values across batches provide direct evidence of batch effects that require correction.
2. Batch Correction Techniques
Several computational methods have been adapted for proteomic data to remove batch effects while preserving biological variability. The choice of method depends on the experimental design and the severity of batch effects.
- ComBat: This empirical Bayes method is particularly effective for Olink data as it adjusts for batch effects while preserving biological signals. It can be applied in both supervised and unsupervised modes and handles small batch sizes relatively well, as demonstrated in microarray studies (Johnson, W. E. et al., 2007).
- ARSyN: ANOVA Simultaneous Component Analysis is particularly useful when batch effects interact with biological factors. This method separates the data matrix into biological and technical effect matrices, allowing for targeted removal of technical variance.
- Remove Unwanted Variation (RUV): This approach uses control proteins (e.g., housekeeping proteins or negative controls) to estimate the unwanted variation component, which is then removed from the entire dataset. RUV is especially valuable when batches correlate with biological groups of interest.
3. Strategic Experimental Design to Minimize Batch Effects
While statistical correction methods are powerful, proactive experimental design remains the most effective approach to managing batch effects.
- Randomization: Distribute biological groups evenly across processing batches to avoid confounding biological effects with technical variations. For example, ensure that cases and controls are represented in each processing batch rather than processing all cases in one batch and all controls in another.
- Balance batch sizes: Whenever possible, keep batch sizes consistent to facilitate more effective correction. Large disparities in batch sizes can challenge some correction algorithms.
- Include controls: Incorporate pooled quality control samples in each batch to monitor technical variability and facilitate batch effect correction. These controls serve as anchors for normalization and batch correction procedures.
Pathway Enrichment Analysis for Olink Data
1. Standardized Sample Collection Protocols
Pathway enrichment analysis places Olink protein measurements in biological context, revealing systems-level insights beyond individual protein changes. Proper preparation is essential for meaningful pathway analysis.
- Protein identifier mapping: Ensure accurate mapping of Olink protein identifiers to standard databases (e.g., UniProt, Ensembl) using current annotation files. Inconsistent identifier mapping is a common source of error in pathway analysis.
- Define protein sets: Create appropriate protein lists for enrichment analysis. Typically, this includes proteins showing significant differential expression between conditions, but may also include proteins with specific expression patterns from clustering analysis.
- Select appropriate background: Use a background list representing all proteins reliably measured in your experiment rather than the entire proteome. This accounts for the limited nature of Olink panels and prevents biased enrichment results.
2. Olink-Specific Pathway Analysis Tools
Several pathway analysis tools have been optimized for Olink data, leveraging the platform's specific characteristics.
- Olink Insight: The company's proprietary platform offers integrated pathway analysis tools specifically designed for Olink data. These tools incorporate knowledge of antibody performance and protein detection limits to provide tailored recommendations.
- WebGestalt: WebGestalt: This web-based tool supports Overrepresentation Analysis (ORA) and Gene Set Enrichment Analysis (GSEA) modes. The 2019 update introduced phosphorylation site enrichment analysis and an R package (WebGestaltR), making it ideal for integrating Olink proteomic data into custom workflows (Liao, Y. et al., 2019).
- Enrichr: A user-friendly tool that accesses numerous pathway databases. Its API allows for automated analysis of multiple protein lists, facilitating comparison across experimental conditions. The 2016 update introduced enhanced libraries and fuzzy set analysis, improving robustness for proteomic data (Kuleshov, M. V. et al., 2016).
- Custom protein-set databases: Supplement standard pathway databases with protein sets derived from recent literature or specific biological processes particularly relevant to your research question. This tailored approach can reveal novel insights that standard databases might miss.
3. Interpretation and Validation of Pathway Results
Proper interpretation of pathway enrichment results requires consideration of statistical and biological factors.
- Multiple testing correction: Apply appropriate corrections (e.g., Benjamini-Hochberg FDR) to account for the numerous pathways tested. However, be aware that overly stringent correction may miss biologically relevant but less statistically robust findings.
- Prioritize convergent findings: Place greater confidence in pathways identified by multiple analytical methods (e.g., both ORA and GSEA) or supported by complementary data types (e.g., transcriptomics).
- Biological plausibility: Evaluate whether enriched pathways align with prior knowledge about the biological system under study. Unexpected pathway enrichments should be scrutinized for potential technical artifacts before accepting as biological discoveries.
Table: Recommended Pathway Analysis Strategies for Olink Data
| Analysis Type | Best Use Case | Recommended Tools | Key Considerations |
| Overrepresentation Analysis (ORA) | Focused analysis of significantly altered proteins | WebGestalt, Enrichr | Requires arbitrary significance threshold; may miss subtle coordinated changes |
| Gene Set Enrichment Analysis (GSEA) | Assessing coordinated subtle changes across entire protein set | GSEA, WebGestalt | More computationally intensive; requires full ranked protein list |
| Network-based Analysis | Identifying protein interaction modules | Cytoscape with relevant plugins | Provides mechanistic context; requires specialized expertise |
Quality Control Pipelines for Olink Data
1. Pre-normalization Quality Assessment
Implementing a robust quality control (QC) pipeline is essential for generating reliable results from Olink studies. QC should be performed both before and after normalization to identify problematic samples and assess the effectiveness of normalization procedures.
- Sample-level QC: Calculate quality metrics for each sample, including median intensity, detection rate (percentage of proteins above detection limit), and missing value profile. Samples with metrics deviating substantially from the cohort median should be flagged for further investigation or exclusion.
- Protein-level QC: Assess each protein's performance across samples, including missing value rate, coefficient of variation in quality control samples, and intensity distribution. Proteins with high missingness (>20%) or excessive variability in control samples may need to be excluded from analysis.
- Plate effects: Evaluate systematic differences between processing plates by comparing the distributions of quality metrics across plates. Significant plate effects may necessitate batch correction approaches beyond simple normalization.
2. Data Imputation Strategies for Missing Values
Missing values are common in proteomic data and require careful handling. The optimal approach depends on the missingness mechanism (missing completely at random, at random, or not at random) and the percentage of missing data.
- For low missingness (<5%): Simple imputation methods such as mean/median replacement or random forest imputation generally perform well. For minimal missingness (<1%), deletion of samples or proteins with missing values may be acceptable.
- For moderate missingness (5-15%): More sophisticated approaches such as k-nearest neighbors (kNN) imputation or maximum likelihood methods are preferable. These methods leverage patterns in the observed data to estimate missing values.
- For high missingness (>15%): Consider whether the protein should be excluded from analysis, as high missingness complicates imputation and may indicate technical issues with the protein's measurement. If retention is necessary, use specialized methods such as Bayesian principal component analysis or mixed models that account for the uncertainty in imputed values.
Recommended Analysis Tools and Workflows
1. R and Python Packages for Olink Data
Specialized software packages can streamline Olink data analysis, providing implemented functions for normalization, batch correction, and quality control.
- OlinkAnalyze (R): This dedicated package provides functions specifically designed for Olink data analysis, including normalization, quality control, and visualization. The package implements Olink's recommended analysis workflows and is regularly updated to reflect methodological improvements.
- Python libraries: For Python users, libraries such as pandas and NumPy provide the foundation for data manipulation, while scikit-learn offers machine learning approaches for batch correction and imputation. Scanpy, originally developed for single-cell RNA sequencing data, can be adapted for Olink protein data analysis, particularly for dimensionality reduction and visualization.
- Commercial platforms: Tools like JMP Clinical or GraphPad Prism offer point-and-click interfaces for proteomic data analysis, making them accessible to researchers with limited programming experience. However, they may lack the flexibility of programming-based approaches for complex analytical needs.
2. Visualization Tools for Olink Data
Effective visualization is crucial for interpreting high-dimensional Olink data and communicating findings.
- Heatmaps: Use clustered heatmaps to visualize protein expression patterns across sample groups. Include sample annotations (e.g., clinical variables, batch information) to facilitate interpretation of potential confounders.
- Volcano plots: Create volcano plots to visualize the relationship between statistical significance (p-values) and magnitude of change (fold differences) for differential expression analysis. This helps identify proteins with both statistical and biological importance.
- Interactive dashboards: Develop Shiny (R) or Dash (Python) applications to enable interactive exploration of results, particularly useful for collaborative projects or when sharing findings with non-technical stakeholders.
Troubleshooting Common Analysis Challenges
1. Addressing Low Signal Strength
Some proteins may exhibit low signal strength near the detection limit, complicating reliable quantification. Several strategies can help address this challenge:
- Group low-abundance proteins: For proteins with similar biological functions that individually have low signal, consider creating aggregate scores that combine information from multiple proteins in the same pathway. This can increase the signal-to-noise ratio for assessing pathway-level activity.
- Non-linear transformation: Apply asinh or log(x + c) transformations to compress the dynamic range and reduce the influence of very high-abundance proteins, which can help reveal patterns in low-abundance proteins.
- Weighted analyses: In multivariate models, assign lower weights to proteins with higher technical variability (often correlated with low signal) to reduce their influence on the overall results while still incorporating their information content.
2. Analyzing Longitudinal Olink Data
Repeated measurements from the same subjects over time require specialized analytical approaches that account for within-subject correlation.
- Mixed-effects models: These models appropriately handle the correlated nature of longitudinal data by including both fixed effects (e.g., treatment, time) and random effects (e.g., subject-specific intercepts). They can accommodate unbalanced designs and missing data points common in longitudinal studies.
- Response feature analysis: As a simpler alternative, reduce longitudinal data to summary measures (e.g., area under the curve, maximum change from baseline) for each subject, then analyze these summary measures using standard statistical tests. This approach loses some temporal information but simplifies analysis and interpretation.
- Trajectory analysis: Cluster subjects based on their protein expression trajectories over time to identify subgroups with distinct temporal patterns. This can reveal heterogeneity in treatment response or disease progression that might be obscured in group-level analyses.
Conclusion
Effective analysis of Olink Explore 1536 and 3072 data requires a thoughtful approach to normalization, batch correction, and pathway enrichment. By implementing the strategies outlined in this article, researchers can maximize the biological insights gained from their proteomic studies while minimizing false discoveries resulting from technical artifacts. The key to success lies in selecting methods appropriate for the specific experimental design, rigorously evaluating the effectiveness of each processing step, and maintaining a clear chain of analytical decisions from raw data to biological interpretation. As the proteomics field continues to evolve, staying informed about new analytical approaches and best practices will ensure that your Olink data realizes its full potential to advance biomedical knowledge.
FAQs
1. What is the key difference between within-product and between-product bridging in Olink data analysis?
- Within-product bridging corrects technical variation between projects run on the same Olink platform (e.g., two Olink Explore 3072 batches) using shared bridging samples. It assumes consistent assay distributions and applies median-centering normalization.
- Between-product bridging integrates data from different platforms (e.g., Olink Explore 3072 and Olink Explore HT). It requires more bridging samples (40–64 for 3072-to-HT) and uses advanced methods like quantile smoothing or median normalization, depending on assay compatibility.
2. How many bridging samples are needed for combining Olink Explore 3072 with other products?
- Olink Explore 3072 to Olink Explore HT: 40–64 bridging samples.
- Olink Explore 3072 to Olink Reveal: 32–48 bridging samples.
These samples must represent the dynamic range of protein expression and pass quality controls (e.g., high detectability).
3. What QC steps are critical before bridging?
- Bridging sample validation: Ensure samples are not outliers via PCA plots.
- Assay overlap check: Confirm sufficient overlapping assays between platforms (e.g., ~2,900 for 3072/HT).
- Distribution inspection: Use visualizations (e.g., density plots) to identify assays with mismatched distributions.
4. Can I combine bridged data with other omics datasets for pathway analysis?
Yes. After successful bridging, the normalized NPX values can be integrated with genomic or transcriptomic data for multi-omics pathway enrichment. Tools like WebGestalt or Enrichr support such analyses, but ensure batch effects are fully corrected beforehand.
Related Reading
For deeper insights, we recommend exploring the following related guides:
Understanding Olink's Data Analysis Process: From Raw Data to Insights — An overview of how Olink's structured analytical pipeline transforms raw protein data into biological insights through quality control, differential analysis, and functional interpretation.
A Deep Dive into the Olink Explore 3072 Platform: Expanding the Boundaries of Proteomic Discovery — A vision of how Olink's scalable, high-throughput proteomics is accelerating biomarker discovery, reshaping drug development, and unlocking the functional proteome through ultra-sensitive, large-scale studies of complex biological samples.
References
- Sissala, N., Babačić, H., Leo, I.R. et al. Comparative evaluation of Olink Explore 3072 and mass spectrometry with peptide fractionation for plasma proteomics. Commun Chem 8, 327 (2025).
- Johnson, W. E., Li, C., Rabinovic, A. (2007). Adjusting batch effects in microarray expression data using empirical Bayes methods. Biostatistics, 8(1), 118-127.
- Liao, Y., Wang, J., Jaehnig, E. J., Shi, Z., Zhang, B. (2019). WebGestalt 2019: gene set analysis toolkit with revamped UIs and APIs. Nucleic Acids Research, 47(W1), W199-W205.
- Kuleshov, M. V., Jones, M. R., Rouillard, A. D., Fernandez, N. F., Duan, Q., Wang, Z., et al. (2016). Enrichr: a comprehensive gene set enrichment analysis web server 2016 update. Nucleic Acids Research, 44(W1), W90-W97.

