
Introduction
In recent years, the research community has seen that pairing Olink proteomics technology with other omics layers—genomics, transcriptomics, metabolomics—unlocks insights that neither alone could provide. For example, the UK Biobank Pharma Proteomics Project (UKB-PPP) used the Olink Explore platform to measure ~3,000 plasma proteins in over 54,000 individuals. That dataset revealed over 14,000 genetic associations (pQTLs) with protein levels, many of them novel, deepening our understanding of how genetic variation influences protein expression. (Sun et al., 2023.)
For biotech teams, pharmaceutical R&D, and academic researchers, the key question is: how can combining Olink cytokine / plasma proteomics with other omics improve biomarker discovery in precision oncology? In practice, separate omic studies often leave gaps: mRNA expression does not always predict functional protein levels; metabolite changes may lag behind upstream transcriptional regulation; tissue or plasma compartment differences complicate interpretation. By integrating proteomics with genomics, transcriptomics, metabolomics, and other layers, you can:
- detect actionable biomarkers more reliably
- uncover regulatory mechanisms missed by transcript‐only studies
- improve statistical power and prediction for disease risk or response to therapies
In this article, we explore how to integrate Olink proteomics technology, especially Olink cytokine panels and plasma proteomics, with other omic types. We'll cover:
- biological and technical rationale for integration
- computational and design frameworks
- real case studies in oncology and immune signaling
- practical steps for deploying multi-omic workflows in research settings
At the end, you'll have concrete strategies to plan and execute integrative omics projects that make your biomarker work more rigorous, insightful, and impactful.
Why Combine Olink Proteomics with Other Omics?
Integrating Olink proteomics with genomics, transcriptomics, metabolomics and related omic layers offers unique scientific and technical advantages. Below are key reasons why multi-omics strengthens research outcomes, especially in precision oncology and biomarker discovery.
2.1 Closer Readout of Function than Gene or RNA Alone
mRNA levels often don't correspond precisely to protein levels. Post-transcriptional regulation, translation efficiency, and protein degradation all affect the final proteome.
Olink proteomics, especially cytokine panels and plasma proteomics, enable quantification of proteins that mediate immune signalling and microenvironment interactions, which can't be inferred reliably from transcriptomics alone.
In a study of mesenchymal stem cells under TNF-α stimulation, combining Olink proteomics with RNA-seq revealed that although many transcripts related to immune response were upregulated, only a subset translated to increased secreted proteins; some pathways (e.g. cell migration, differentiation) were suppressed at the protein level despite active transcription (Zhou et al., 2025. DOI:10.1007/s12015-025-10938-0)
2.2 Detect Low-Abundance and Secreted Proteins (e.g. Cytokines) Missing from Other Layers
Many biologically important molecules (cytokines, chemokines, growth factors) are present at low concentrations and are secreted. RNA profiling may show gene expression, but secreted protein abundance in plasma or tissue fluid gives functional insight.
Olink PEA (Proximity Extension Assay) technology has very high sensitivity and wide dynamic range, allowing detection of these low-abundance but functionally critical proteins using small sample volumes.
2.3 Link Genetic Variation to Functional Protein Outcomes (Proteogenomics)
Genomic data (e.g., SNPs, structural variants) can identify variants, but understanding their functional effect often requires seeing whether and how they alter protein levels (protein quantitative trait loci, pQTLs). Combining proteomics helps illuminate which genetic changes truly impact the proteome.
As shown in recent work in cardiovascular research: Using Olink's high-throughput proteomics along with GWAS, investigators found cis-pQTLs for hundreds of proteins associated with ischemic heart disease, then used Mendelian Randomization to infer causality for certain proteins. These findings were not possible via genomics alone.
2.4 Improve Statistical Power & Predictive Biomarker Signatures
Multi-omics data (e.g., combining protein + RNA + metabolite) allows models that capture more variance in phenotype or response, because each layer contributes non-redundant information.
In oncology or immune response studies, protein signatures (including cytokines) improve prediction of response to perturbations beyond what gene expression alone provides. Also, longitudinal or time-series omics benefit when protein levels change over time (e.g., during immune activation) earlier or later than transcripts.
2.5 Reveal Post-Translational Modifications, Protein Isoforms, and Context
Some crucial information—modifications (phosphorylation, glycosylation), cleavage, isoform switching—is invisible at the mRNA level but influences protein stability, localization, or function.
While Olink panels are targeted (not global MS-based), combining with other omic types or MS allows detecting these features; the presence or absence of modified proteins can confirm functional regulation or signaling pathway activation.
Key Omics Modalities to Integrate with Olink & Their Synergies
Integrating Olink proteomics technology with other omics layers gives richer biological insight. Below, I explore several omic modalities, how they pair with Olink, and examples.
3.1 Genomics / Proteogenomics
How They Synergize
Genomics (including genome sequencing, SNP / variant discovery, exome or whole-genome) reveals inherited variation. But many variants' effects are buffered or modified at the protein level.
By measuring protein quantities (via Olink), you can detect protein quantitative trait loci (pQTLs) — i.e. variants that affect protein level — which helps link genotype to phenotype.
This is valuable for biomarker discovery: proteins influenced by specific variants may be more stable, causally relevant, or less confounded by environmental noise.
Example
The UK Biobank Plasma Proteomics Consortium integrated whole-exome data with Olink Explore proteomics (≈3,000 plasma analytes, ~54,000 participants). They discovered thousands of rare genotype–protein associations, many of which had not been seen in genome-wide association studies (GWAS) alone. This strengthens confidence in proteins as candidate biomarkers.
In an acute kidney injury (AKI) mouse model, combining Olink plasma proteomics with transcriptomics data found overlapping genes/proteins (e.g. CXCL1, TNFRSF12A) whose expression was elevated in both layers. This helped pinpoint potential biomarkers that are active at both transcriptional and protein levels.
3.2 Transcriptomics (Bulk, Spatial, Single-Cell)
How They Synergize
Transcriptomics shows which genes are being transcribed; but mRNA is only one step. Comparing mRNA and protein levels reveals post-transcriptional regulation.
Spatial / bulk / single-cell transcriptomics can localize which cell types or tissue zones are producing transcripts, while Olink (particularly cytokine panels) can reveal secreted proteins or protein abundance in fluids/plasma related to those transcripts.
Discordance between mRNA and protein (e.g. mRNA high but protein low) can point to regulation at translation, protein stability or secretion.
Example
In the recent study by Zhou et al. (2025), mesenchymal stem cells exposed to TNF-α were profiled with both transcriptomics and Olink proteomics. The authors found that while many immune and signaling transcripts rose, only subsets of immune proteins were elevated—revealing suppression of certain pathways at the protein level despite strong transcriptional activation. This helped refine which biomarkers are reliable.
Another example: in the Omics Playground platform, a dataset of sarcoidosis was analysed using Olink Explore 1536 proteomics and bulk RNAseq from skin biopsies & blood. The proteomics and transcriptomics data both captured upregulation of macrophage / cytokine genes and proteins (including CHIT1). This confirmed immune pathways across tissues and sample types.
3.3 Metabolomics & Lipidomics
How They Synergize
Metabolomics measures the small molecules / metabolic intermediates that are final readouts of many cellular processes. They often change more rapidly than transcripts or proteins.
Lipidomics is a subset focusing on lipids, which are important in membrane biology, signalling, energy storage, inflammation.
When you combine metabolomics / lipidomics with proteomics, you can trace how proteins (e.g. enzymes, transporters, cytokines) affect metabolic flux, whether a protein's modulation is functional downstream, or how metabolic state influences signaling or protein abundance.
Example
In a study of non-small cell lung cancer (NSCLC) patients undergoing thermal ablation, plasma samples were profiled by Olink proteomics and metabolomics. The integration revealed differentially expressed proteins (e.g. IL-6, PD-L1) and metabolites whose changes corresponded to immune checkpoint pathways, tumor microenvironment alterations, and angiogenesis. This dual profiling allowed deeper pathway mapping than either omic alone.
In colorectal cancer, saliva samples were analysed using Olink proteomics plus untargeted metabolomics. Combined analysis found both proteins and metabolites distinguishing CRC patients from healthy controls, improving biomarker signature strength.
3.4 Epigenomics & Other Regulatory Omics
How They Synergize
Epigenomic data (DNA methylation, histone marks, chromatin accessibility) highlight regulatory control points upstream of transcription. These can suggest why certain genes are over- or under-expressed.
When linked with transcriptomics + proteomics, you can build chains: epigenetic modification → changes in transcription → resulting protein level (or lack thereof).
Other regulatory omics include miRNA / non-coding RNA, which regulate mRNA translation or stability.
Example
(Currently, fewer published studies explicitly pair Olink proteomics with detailed epigenomic data in oncology. However, the UK Biobank cohort's proteogenomic work occasionally explores methylation or non-coding variant data in relation to protein levels. )
3.5 Other Modalities: Imaging, Clinical / Phenotypic Data
How They Synergize
Imaging (histopathology, immunofluorescence, spatial imaging) helps locate where in tissue or tumor microenvironment proteins are active. Combining with proteomics helps connect secreted / circulating proteins to tissue‐level expression and spatial heterogeneity.
Rich clinical / phenotypic metadata (e.g. treatment response, environmental exposure, time-series data) allow correlating multi-omics signatures with outcomes, even in non-clinical research (e.g. preclinical models, animal studies).
Example
In studies of immune modulation in skin disease (e.g. vitiligo) using Olink serum proteomics and tissue transcriptomics, changes in immune signalling proteins measured in blood reflected both skin lesion transcript signatures and imaging phenotypes, illustrating systemic vs local effects.
Case Studies: Olink + Other Omics in Precision Oncology & Biomarker Discovery
Case Study A: Pancreatic Cancer Biomarkers in Two Prospective Cohorts
Study design
Nested case-control study among ~38,295 elderly Chinese individuals, ~5.7 years follow-up. Olink Explore 3072 / 384 panels used to measure ~1,463 serum proteins.
Integration with other omics
Researchers combined the protein data with genetic/variant data (Mendelian Randomization) and replicated findings in UK Biobank proteomics cohort. This cross-cohort and cross-omics validation strengthens causal inference.
Key findings
Identified REG1A, REG1B, TNF, PLA2G1B among proteins linked with incident pancreatic cancer.
The two REG1 proteins showed stronger effect sizes as diagnosis approached.
Causality analyses supported potential causal roles, making them promising early biomarkers / therapeutic targets.
Takeaway for integrating Olink + other omics
This study shows the power of combining longitudinal proteomics (via Olink) + genetic data + validation across cohorts to identify early markers. It helps avoid false positives and improves robustness.
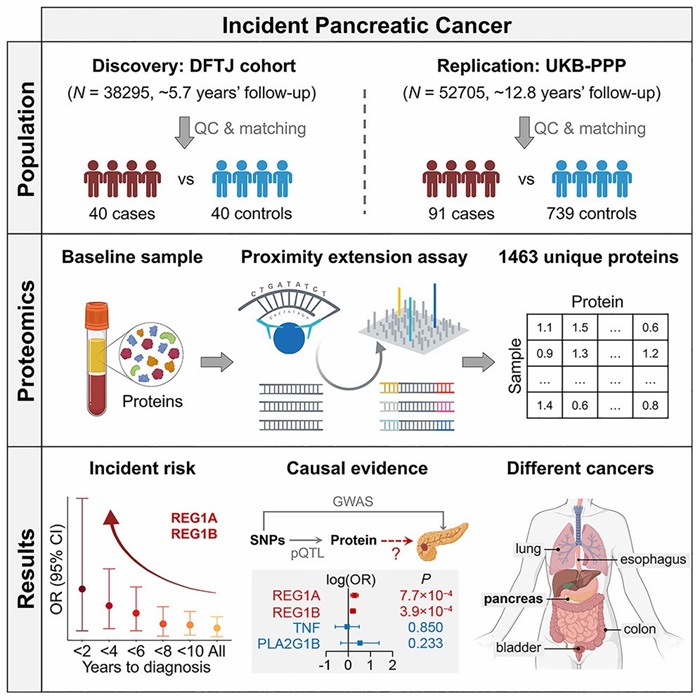 Fig. 1 Prospective proteomic discovery and replication of pancreatic cancer risk biomarkers with Olink technology.
Case Study B: Ovarian Cancer Multi-Protein Signature
Study design
Enroth et al. (2022) used multiple Olink Target 96 panels to screen ~600 plasma proteins in three cohorts with ovarian cancer and controls; later developed a custom panel and validated in independent cohorts (total >1,100 samples).
Integration with other omics
While this study was more proteomics-centred, it used multivariate modelling and risk score trajectories. Though not heavily genomics or transcriptomics, the longitudinal follow-up patterns corresponded with disease progression, suggesting that integrating time-series proteomics can behave similarly to dynamic transcriptomic or phenotypic data.
Key findings
Discovered an 11-protein diagnostic signature (including MUCIN-16, SPINT1, TACSTD2, etc.) with ~94% accuracy distinguishing ovarian cancer from healthy controls.
Risk score trajectories during two-year follow-up predicted clinical outcomes and survival better than many traditional markers.
Takeaway
Even when not combining multiple omics modalities, careful sampling, cohort replication, and serial proteomics deliver strong biomarker signatures. Integrating with transcriptome and genomic data in subsequent work could further solidify findings.
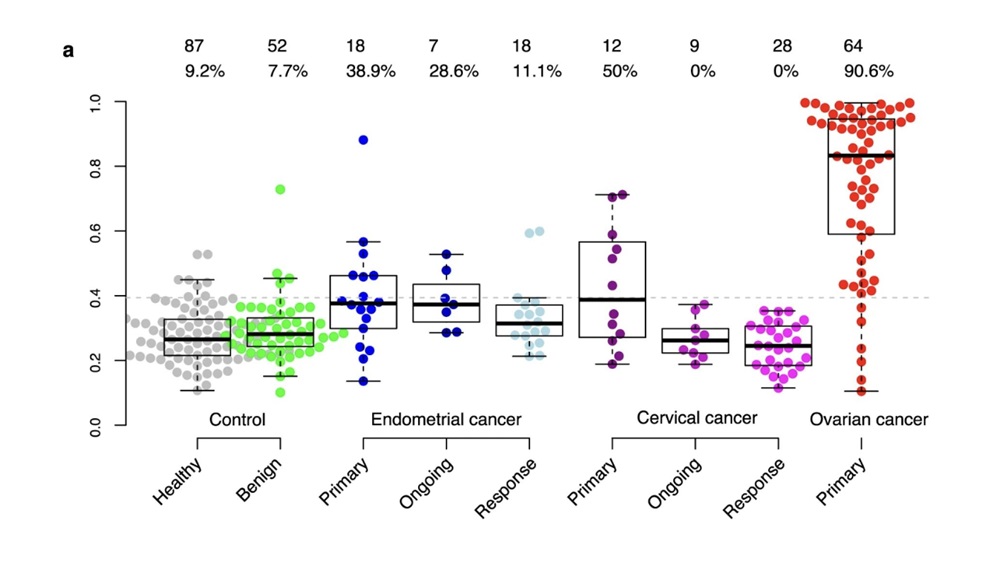 Fig 2. Risk score for healthy women and those with benign tumors, or endometrial, cervical and ovarian cancer (stages I–IV).
Case Study C: SCALLOP Consortium — Inflammation Proteins + Genetics
Study design
SCALLOP (Systematic and Combined AnaLysis of Olink Proteins) collated data from 45 cohort studies (almost 70,000 samples) using Olink Target 96 Inflammation panels, combined with GWAS data across cohorts.
Integration with other omics
Proteomics + genetics (pQTL analysis) + GWAS hits + Mendelian Randomization to link protein levels with immune-mediated diseases.
Trans-pQTLs and cis-pQTLs identified; cross-cohort meta-analysis allowed discovery and validation.
Key findings
180 significant associations between 108 genomic regions & 70 inflammation-related proteins.Identified proteins overlapped with known immune disease loci; MR analysis implicated 10 proteins as causally related to disease.
Takeaway
Large consortia + Olink proteomics + genetic data enable robust discovery of immune biomarkers. For oncology, similar large-scale multi-omics designs can enable discovery of tumor-immune axis biomarkers.
Case Study D: Early Detection of Multiple Cancers from Plasma Proteome
Study design
Novelna Inc. used Olink Explore 3072/384 to profile >3,000 proteins in plasma from individuals with 18 different early-stage solid tumors vs healthy controls.
Integration with other omics / metadata
Although the focus is proteomics, models were trained with consideration of sex-specific differences, and comparisons were made with known tissue of origin signatures. Such integration of proteomics + metadata / phenotypic covariates helps refine biomarker specificity.
Key findings
Sex-specific 10-protein models: in males AUC ~0.98, in females ~0.983 at early stages with high specificity.
Larger multi-protein models derived to identify tissue of origin with ~80% accuracy.
Takeaway
A high-multiplex proteomic platform (like Olink Explore) plus thoughtful modeling (sex, tissue origin) can deliver powerful early detection signatures even before integrating transcriptomics or genomics. Still, integrating those could enhance causality and robustness.
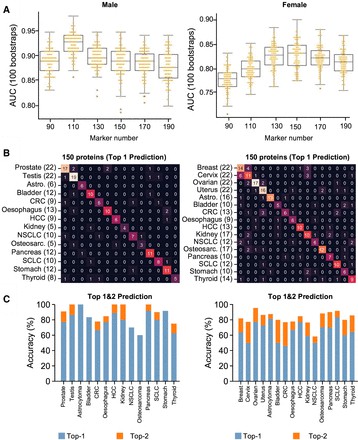 Figure 4 The selection and performance of the localisation panels across cancers.
Technical & Design Considerations When Using Olink Cytokine Panels in Multi-Omic Studies
To maximize the value of Olink cytokine / inflammation data when combining with other omics, consider:
| Factor | Why It Matters | Suggested Practice |
| Sample timing / matchedness | Cytokine levels fluctuate rapidly (diurnal, treatment, immune activation). If timepoints don't align with other omic data, misinterpretation occurs. | Collect matched samples for both proteomics and other layers (e.g., transcriptomics) at same or closely spaced timepoints. Include baseline + longitudinal sampling. |
| Sample matrix & quality | Serum vs plasma vs tissue fluid have different cytokine-profiles and interference; handling (freeze-thaw, storage) can degrade cytokines. | Use low binding tubes, standardize collection procedures; only compare like sample types; QC metrics (e.g. coefficient of variation, lower limits) should be reported. |
| Dynamic range & detection sensitivity | Some cytokines are below detection or low abundance, may be picked up only in certain panels. | Use Olink panels with high sensitivity (e.g., Target 48 Cytokine or specifically validated inflammation panels); verify LOD / LOQ. If needed, complement with other detection (e.g., ELISA) for some analytes. |
| Normalization & batch effects | Inter-plate variation and batch effects can distort comparisons; NPX (Normalized Protein eXpression) values depend on internal controls. | Include internal controls, randomized sample layout across plates, replicate samples; consider plate/batch as covariate in models. |
| Statistical modeling & integration | The multivariate nature of cytokine profiles means multiple correlated variables; combining with other omics increases dimensionality. | Use dimensionality reduction (PCA, factor analysis), regularized regression, machine learning; multi-omic integrative tools (e.g., CCA, network methods); validate in independent cohorts. |
Challenges, Limitations & Pitfalls
When integrating Olink proteomics technology with other omics layers, many advantages exist—but significant challenges and trade-offs also arise. Recognising them early helps plan better studies, avoid misinterpretation, and ensure reproducible, robust biomarker discovery.
6.1 Detection Limits, Missing Data & Low-Abundance Proteins
Limit of Detection (LOD) and Limit of Quantification (LOQ): Each Olink assay has defined plate-specific LOD and LOQ values; many proteins/cytokines may fall below LOD in a large fraction of samples, making statistical comparison unreliable.
Data below LOD / large missingness: If too many samples are below LOD/LOQ (e.g. >25-50%), results may be biased. Handling such data (imputation, censoring, exclusion) can strongly affect downstream integration.
Low-abundance proteins: Some secreted cytokines or signaling proteins are very low concentration; even with Olink's sensitivity, detection may be inconsistent. These gaps may lead to missing or noisy signals when correlating across omics.
6.2 Panel Bias & Limited Coverage
Pre-defined panels: Olink panels measure a fixed set of proteins. You can't discover entirely novel proteins (outside panel) or all post-translational modifications (PTMs). This biases analyses toward what's already known.
Dynamic range limitations: Though Olink has good sensitivity, the range (especially for very high or very low concentrations) is narrower than some mass spectrometry (MS)-based or discovery proteomics methods. Extreme values (above or below the quantification limits) can distort analyses.
6.3 Sample & Pre-analytic Variability
Sample type differences: Plasma vs serum vs tissue lysate vs other fluids—these differ in protein background, interference, matrix effects. Cross-omic data (e.g. RNA from tissue vs protein from plasma) may not map cleanly.
Sample collection, handling, storage: Freeze-thaw cycles, delay in processing, storage temperature, tube types (protein binding), anticoagulants etc. can introduce variability that swamps biological signal.
Timepoint mismatches: If proteomics and transcriptomics or metabolomics samples are collected at different times relative to perturbation (e.g. treatment, stimulus), then observed differences may be due to timing, not biology.
6.4 Statistical, Computational & Integration-Specific Challenges
Heterogeneous data scales & distributions: Omics data types (e.g. gene counts, NPX protein expression, metabolite levels) have different units, noise profiles. Scaling, normalization, transforming appropriately is non trivial.
Batch effects: Different omic layers may be processed in different labs, at different times, on different platforms. Removing batch effects without removing biological variation is hard.
Missing modalities: In many studies, not all omics layers are available for all samples; this missingness can bias downstream modelling.
High dimensionality / "curse of dimensionality": Many features but fewer samples; risk of overfitting, false positives. Needs appropriate regularization, cross-validation, or dimensionality reduction.
6.5 Biological & Interpretational Pitfalls
Discordance between mRNA and protein: Differences in translation, degradation, secretion etc. mean that high RNA expression doesn't always lead to high protein or secreted protein. Interpretation must consider regulation beyond transcription.
Confounding, causality: Correlation across omics layers doesn't imply causation. Genetic or perturbation data (e.g. from pQTLs, MR, knockdowns) are needed to support causal inference.
Compartmentalization: Proteins measured in plasma may originate from many tissues; transcriptomics from one tissue may not reflect systemic protein sources. Misattribution of source can mislead about mechanism.
6.6 Cost, Throughput & Resource Constraints
Cost per sample / per panel: High-plex Olink panels / Explore or HT panels are expensive; scaling up many samples across many omics quickly becomes resource-intensive.
Throughput constraints: Time, labor, reagent supply, instrument availability can limit number of samples or replicates; low replication impedes statistical power.
Data storage, computing requirements: Multi-omics datasets (especially when including high-resolution transcriptomics, metabolomics, imaging) require substantial resources for processing, storage, and analysis.
Best Practices & Steps to Implement in Your Lab or CRO / Pharma Setting
To realize the benefits of combining Olink proteomics with other omics (genomics, transcriptomics, metabolomics, etc.), labs and CROs need rigorous workflows. Below are recommended best practices and concrete steps to plan, execute, and analyze multi-omics projects, reducing technical pitfalls and maximizing biological insight.
7.1 Study Planning & Experimental Design
Define clear biological / research questions
Know whether you aim for discovery (e.g. novel biomarkers), mechanistic insight, or predictive modelling. This guides which omic layers are essential.
Sample size and statistical power
Estimate required sample size considering multiple modalities and correction for multiple testing. When many omic features are measured (e.g., 1,000+ proteins, tens of thousands of transcripts), you often need more samples to avoid overfitting.
Matched sample collection
Ensure that samples used for Olink proteomics and other omic layers come from the same individuals, timepoints, and conditions. This minimizes confounding due to temporal, spatial, or processing differences.
Randomization and blocking
Randomize sample allocation across plates, batches etc. If possible, block experimental variables that may influence protein expression (e.g. collection time, operator, storage conditions).
7.2 Sample Collection, Handling & QC
Standardize collection protocols
Use consistent sample matrix (plasma vs serum vs tissue lysate), anticoagulants, collection tubes, temperature, time to processing. Following proteomics best practices improves detection reliability.
Minimize pre-analytic variability
- Snap-freeze or freeze at −80°C quickly
- Avoid repeated freeze-thaw cycles by aliquoting early
- Use low binding tubes to reduce protein loss
Include appropriate QC / control samples
- Internal / external controls (blanks, spike-ins, known concentration standards)
- Replicate samples across plates or batches
- Bridge samples: shared samples across different Olink NPX datasets to enable normalization / bridging later.
7.3 Data Generation & Normalization / Bridging
Use proper normalization / bridging when combining multiple NPX datasets
If your project involves more than one plate, or different Olink products (e.g. Explore HT vs Explore 3072), you need bridging or overlapping reference normalization to align datasets. Olink provides functions (e.g. olink_normalization, olink_normalization_subset, olink_normalization_qs) to manage this
Randomize samples across plates and batches
Ensures that batch effects are not confounded with biological groups. If all treated samples are in one plate and controls in another, it's difficult to disentangle technical from biological variation.
Check sample and assay QC metrics
After generating NPX data, verify that sample passing QC warnings, check internal control performance, look at coefficient of variation (CV) across replicates, assess detection limits. Remove poor quality samples / assays before downstream integration.
7.4 Multi-Omics Integration & Analysis
Use dimensionality reduction and regularisation
Techniques such as PCA (principal components), factor analysis, sparse partial least squares, canonical correlation, or recent deep learning embedding frameworks help reduce noise and avoid overfitting.
Batch effect correction tools
Employ algorithms that can handle multi-omics data, adjusting for technical effects while preserving biology. The Quartet Project compared multiple batch-effect correction approaches across proteomics, transcriptomics and metabolomics and found that balanced design + reference samples helps significantly.
Visualization and network analysis
Use heatmaps, clustering, co-expression / co-abundance networks, pathway enrichment to inspect concordance / discordance among omic layers. For example, comparing cytokine panel data with gene expression of immune pathways can reveal regulatory bottlenecks.
Validation in independent cohorts or replicates
Always test findings in separate sample sets or through orthogonal methods (e.g. ELISA, western blot) to confirm that protein biomarkers are real, reproducible, and not artifacts.
7.5 Infrastructure, Tools & Resources
Use appropriate software / bioinformatics pipelines
- Olink's own tools / R packages (e.g. OlinkAnalyze) for NPX normalization, bridging, QC.
- Tools for omics integration (multi-omics frameworks) needed for handling heterogeneous data.
Ensure data management, metadata, and documentation
Keep detailed metadata: sample source, collection time, processing, storage, experimental conditions, batch IDs. Use standards where possible (e.g. MIAME, PSI for proteomics).
Sufficient computational resources
Ensure storage, processing power (especially if including large transcriptomic / metabolomic / imaging datasets), staff with skill in statistics / computational biology.
7.6 Reporting, Interpretation & Reproducibility
Transparent reporting
Include all key parameters: number of bridging / QC samples, plate/batch layout, detection limits, normalization methods, statistical tests used, filtering criteria.
Interpret with caution discordant signals
If a transcript is high but protein low (or vice versa), consider post-transcriptional regulation, secretion, sample type mismatch. Use domain knowledge to interpret these discordances.
Pre-register or predefine analysis pipelines where feasible
To avoid "fishing" for biomarkers; defining hypothesis, statistical thresholds, and analytic workflow in advance aids reproducibility.
7.7 Example Roadmap: Step-by-Step Implementation Plan
Here's a sample implementation plan you could adopt or adapt in your lab / CRO / pharma R&D team:
Define the study: disease model or experimental perturbation, endpoints, sample types (plasma, tissue), timepoints.
Select panels: choose Olink panels (e.g. 96-plex vs 48-plex vs inflammation/cytokine panels) that cover proteins likely relevant to your hypotheses. Use internal link Exploring the Olink 96 and 48-Plex Panels: Key Differences to decide.
Assemble matched samples: plan to collect sample material for other omics at same time, same individuals.
Plan QC / control samples: decide number of bridge / shared samples, replicate samples, internal controls.
Generate data: execute Olink proteomics + other omics; monitor QC metrics as data comes in.
Normalization / bridging: after raw NPX data from Olink, perform plate control normalization, then bridging/overlap normalization if combining datasets.
Statistical integration & modelling: apply dimensionality reduction / regularised regression / network analysis; integrate omic layers; test consistency; validate in independent set.
Report & share: publish or internal report with full metadata, methods; use established internal or external reporting standards.
Future Directions
Looking ahead, several emerging technologies and methodological trends are poised to transform how Olink proteomics integrates with other omics layers. For research teams planning long-term strategies, these directions suggest where investment and capability building may produce high ROI.
8.1 Spatial Proteomics & Single-Cell Resolution
Technologies that preserve spatial arrangement of cells/tissues are improving rapidly. Single-cell spatial proteomics can reveal where proteins are expressed relative to tissue architecture (e.g. tumor margin, stromal vs parenchyma). This spatial context helps identify microenvironment interactions missed by bulk proteomics.
Example: The scProAtlas project has built an atlas of multiplexed spatial proteomics imaging across ~15 human tissues, mapping protein expression at single-cell resolution and enabling neighborhood and cell-cell interaction analyses.
Also, advances in "expansion proteomics" allow profiling at subcellular resolution using fixed tissues (e.g. FFPE), which may offer ways to link proteomics to histology and imaging omics.
Implication for Olink integration:
Olink panels (which currently measure soluble/circulating proteins or proteins from homogenized tissue) could be used in tandem with spatial proteomics to validate whether soluble protein signatures have local tissue origins, or to map where key proteins are localized in tumors or in immune infiltrates.
8.2 Hybrid Affinity-Based + Mass Spectrometry / Enhanced Coverage
There's a growing trend of combining high sensitivity affinity-based platforms (like proximity extension assays, PEA) with mass spectrometry (MS). MS can detect broader proteomic breadth, isoforms, post-translational modifications; affinity methods provide sensitivity, throughput, and reproducibility. A recent roundtable noted that hybrid strategies help expand proteome coverage while retaining the strengths of each method.
Also, Olink is advancing its Explore / HT panels to measure thousands of proteins, improving overlap with MS-based discovery proteomics. The UK Biobank / Olink Explore studies are examples of large-scale proteogenomics pushing this frontier.
Implication: For biomarker discovery, labs might adopt workflows where MS discovery identifies candidate proteins / PTMs, then Olink panels validate / quantify across large cohorts; or use Olink to prioritize which MS analyses to perform.
8.3 Spatial Metabolomics + Proteomics Integration
Beyond proteins, mapping metabolites and small molecules spatially in tissues is becoming feasible. The scSpaMet framework combines imaging mass cytometry (for proteins) with secondary ion mass spectrometry (for metabolites) to profile both at single-cell resolution in situ. This allows seeing metabolic gradients in tumors and the relationship with protein signaling.
This combined modality helps trace metabolic reprogramming in cancer or immune cells, which can modulate or be modulated by protein signals (e.g. cytokines, enzymes).
Implication: Olink proteomics (especially plasma or tissue panels) could be integrated with spatial metabolomics in research workflows to correlate soluble or tissue protein biomarkers with metabolic states in situ, enhancing mechanistic understanding.
8.4 Foundation Models, Machine Learning & AI for Omics Integration
Image-based foundation models are emerging that can generalize across datasets, tissue types, and staining / imaging platforms. For example, "KRONOS" is a foundation model trained on millions of patches from multiplex imaging, able to perform cell phenotyping, region classification, and patient stratification across cohorts.
Also, virtual tissue / transformer-based models (e.g., VirTues) are in development to integrate spatial proteomic signals across molecular, cellular, tissue scales, enabling cross-study comparisons and scaling of multiplex imaging / spatial omics.
Implication: These AI/ML tools can aid integration of Olink proteomics with other data layers (e.g. imaging, transcriptomics) by learning representations that capture complex multi-scale relationships. They also help standardize interpretation across labs and datasets.
8.5 Population-Scale and Longitudinal Multiomics
Initiatives like the UK Biobank Pharma Proteomics Project (UKB-PPP) are scaling Olink proteomics to very large cohorts, enabling discovery of rare pQTLs, longitudinal change, and robust statistics for biomarker validation.
In cohort studies, there is increasing interest in adding repeated measures (serial sampling), combining proteomics with environmental, phenotypic, exposomic, microbiome, and epigenomic data to capture temporal dynamics and external modifiers.
Implication: For labs and CROs, this means building capacity for high throughput, standardized sample collection, data persistency, and tools for longitudinal / mixed-effect modeling. Olink proteomics panels will be more useful when projects capture time dimension.
8.6 Integration with Microbiome & Environmental Omics
Though less mature than transcript/protein/metabolite layers, microbiome and exposome (environmental exposures) are increasingly being recognized as important modulators of host protein expression (especially immune signalling / cytokines).
Olink paired with microbiome or microbiota-derived metabolomics may reveal host-microbe interactions relevant to inflammation, immune microenvironment in tumors, or immune regulation. Creative Proteomics' roadmap (from our whitepaper) explicitly suggests expanding in this area.
8.7 Technical Advances in Throughput, Sensitivity & Sample Miniaturization
Panels are becoming more multiplexed, sample volume requirements are being lowered, and throughput is improving. These advances reduce cost per sample and make large-scale / multi-omics studies more feasible. Olink's NGS-readout PEA, high throughput Olink Explore, and improvements in assay chemistry are in this direction.
Also, technologies to reliably quantify proteins and cytokines in challenging sample types (e.g. small tissue biopsies, dried blood spots, microfluidic devices) will further expand integration possibilities.
8.8 Standards, Data Sharing & Interoperability
As multi-omics datasets grow in scale and complexity, community standards for metadata, assay reporting, QC metrics, bridging / normalization become more critical.
Public resources / knowledge bases (like scProAtlas) help by providing annotated datasets, spatial annotations, tissue atlases. These facilitate benchmarking, cross‐study comparisons, and external validation.
Tools, pipelines, and model sharing (open source / open access) will allow labs to reuse, reproduce, and expand multi-omics analyses.
Take-Home: Where Olink Fits In
Olink proteomics (especially cytokine / targeted panels, high-plex Explore or HT versions) is well positioned to be a core modality in future multi-omics, especially where sensitivity, throughput, or correlation with phenotype matter.
The greatest leverage will come when Olink data is collected in spatially resolved ways, longitudinally, and in hybrid workflows (affinity + MS + imaging + environmental data).
Labs that build capabilities now—both technical (sample handling, panel selection, spatial context) and computational (machine learning, integration pipelines, standards)—will have an advantage in future biomarker discovery landscapes.
References
- Tiangang Wang, Xuanmin Chen, Yujuan Han, Jiahao Yi, Xi Liu, Pora Kim, Liyu Huang, Kexin Huang, Xiaobo Zhou, scProAtlas: an atlas of multiplexed single-cell spatial proteomics imaging in human tissues, Nucleic Acids Research, Volume 53, Issue D1, 6 January 2025, Pages D582–D594, https://doi.org/10.1093/nar/gkae990
- Allam, M., Coskun, A.F. Combining spatial metabolomics and proteomics profiling of single cells. Nat Rev Immunol 24, 701 (2024). https://doi.org/10.1038/s41577-024-01084-8
- Yu, Y., Zhang, N., Mai, Y. et al. Correcting batch effects in large-scale multiomics studies using a reference-material-based ratio method. Genome Biol 24, 201 (2023). https://doi.org/10.1186/s13059-023-03047-z
- Ana R Baião, Zhaoxiang Cai, Rebecca C Poulos, Phillip J Robinson, Roger R Reddel, Qing Zhong, Susana Vinga, Emanuel Gonçalves, A technical review of multi-omics data integration methods: from classical statistical to deep generative approaches, Briefings in Bioinformatics, Volume 26, Issue 4, July 2025, bbaf355, https://doi.org/10.1093/bib/bbaf355
- Sun, B.B., Chiou, J., Traylor, M. et al. Plasma proteomic associations with genetics and health in the UK Biobank. Nature 622, 329–338 (2023). https://doi.org/10.1038/s41586-023-06592-6
- Zhou, Y., Xiao, J., Peng, S. et al. The Integration of Olink Proteomics with Transcriptomics Elucidates that TNF-α Induces Senescence and Apoptosis in Transplanted Mesenchymal Stem Cells. Stem Cell Rev and Rep 21, 2298–2309 (2025). https://doi.org/10.1007/s12015-025-10938-0
- Li, X., Zhou, X., Ping, X. et al. Combined Plasma Olink Proteomics and Transcriptomics Identifies CXCL1 and TNFRSF12A as Potential Predictive and Diagnostic Inflammatory Markers for Acute Kidney Injury. Inflammation 47, 1547–1563 (2024). https://doi.org/10.1007/s10753-024-01993-9
- Hoste, E.A.J., J.A. Kellum, N.M. Selby, A. Zarbock, P.M. Palevsky, S.M. Bagshaw, et al. 2018. Global epidemiology and outcomes of acute kidney injury. Nature Reviews Nephrology 14 (10): 607–625. https://doi.org/10.1038/s41581-018-0052-0.
- Kwiatkowska, E., L. Domanski, V. Dziedziejko, A. Kajdy, K. Stefanska, and S. Kwiatkowski. 2021. The mechanism of drug nephrotoxicity and the methods for preventing kidney damage. International Journal of Molecular Sciences. https://doi.org/10.3390/ijms22116109.
- Lyu, Jingjing et al. Identification of biomarkers and potential therapeutic targets for pancreatic cancer by proteomic analysis in two prospective cohorts Cell Genomics, Volume 4, Issue 6, 100561
- Enroth, S., Ivansson, E., Lindberg, J.H. et al. Data-driven analysis of a validated risk score for ovarian cancer identifies clinically distinct patterns during follow-up and treatment. Commun Med 2, 124 (2022). https://doi.org/10.1038/s43856-022-00193-6
- Budnik B, Amirkhani H, Forouzanfar MH, Afshin A. Novel proteomics-based plasma test for early detection of multiple cancers in the general population. BMJ Oncology. 2024;3:e000073. https://doi.org/10.1136/bmjonc-2023-000073
- alt
- Figure 1. Olink proteomics reveals REG1A/REG1B blood biomarkers before pancreatic cancer
- Figure 2. Olink risk-score discriminates healthy vs ovarian/endometrial tumors


