
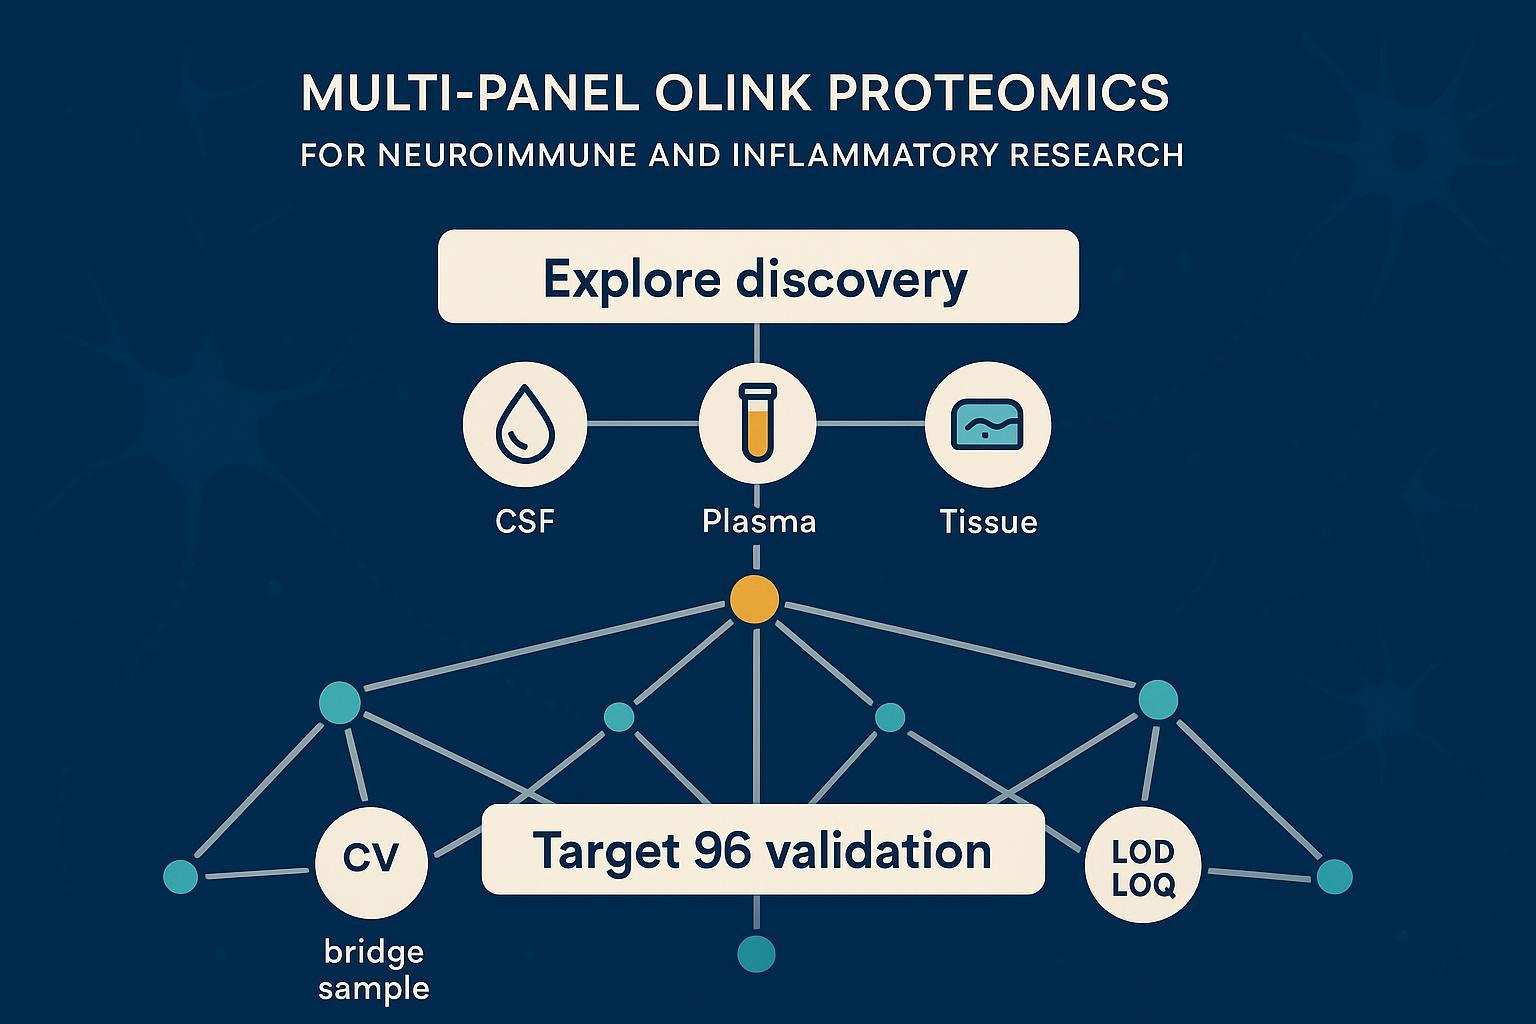
Modern neuroimmune and inflammatory research rarely follows a single pathway. Microglial activation, cytokine cascades, vascular changes, and neuronal stress interact in ways that simple marker sets can't fully capture. Multi-panel Olink proteomics—combining discovery panels with targeted validation—offers a practical way to see cross‑talk across brain–immune axes while keeping sample input low and data quality high. The key is doing it in a way that scales across sites, batches, and matrices, and that stays auditable from day one.
This Ultimate Guide focuses on the main axis that matters most to cross‑functional leaders: cross‑center reproducibility and batch‑effect correction. You'll find decision frameworks, standardized QC gates, panel strategy (Explore vs Target 96), multi‑omics integration tips, and evidence anchors to help you plan and execute neuroimmune/inflammation studies at scale.
Learn how Olink's PEA and service workflows support multi-panel integration in the assay overview.
Key takeaways
- Make harmonization the first milestone: define bridge samples, randomization, and metadata standards before any plate runs.
- Use Explore for broad discovery, then move successful candidates to Target 96 for clinical validation and stratification.
- Treat QC as gates, not suggestions: monitor CV ranges, bridge‑sample correlations, detectability, and LOD/LOQ evidence.
- Visualize batch effects early (PCA/UMAP, NPX distributions) and document pre/post normalization.
- Integrate proteomics with transcriptomics/genomics for stronger causal hypotheses and patient segmentation.
- Plan a 4–6 month timeline with parallelized assay/QC phases and predefined reporting checkpoints. QC thresholds noted here are starting recommendations; validate with SMEs for clinical contexts.
Why multi-panel Olink proteomics elevates neuroimmune and inflammatory research
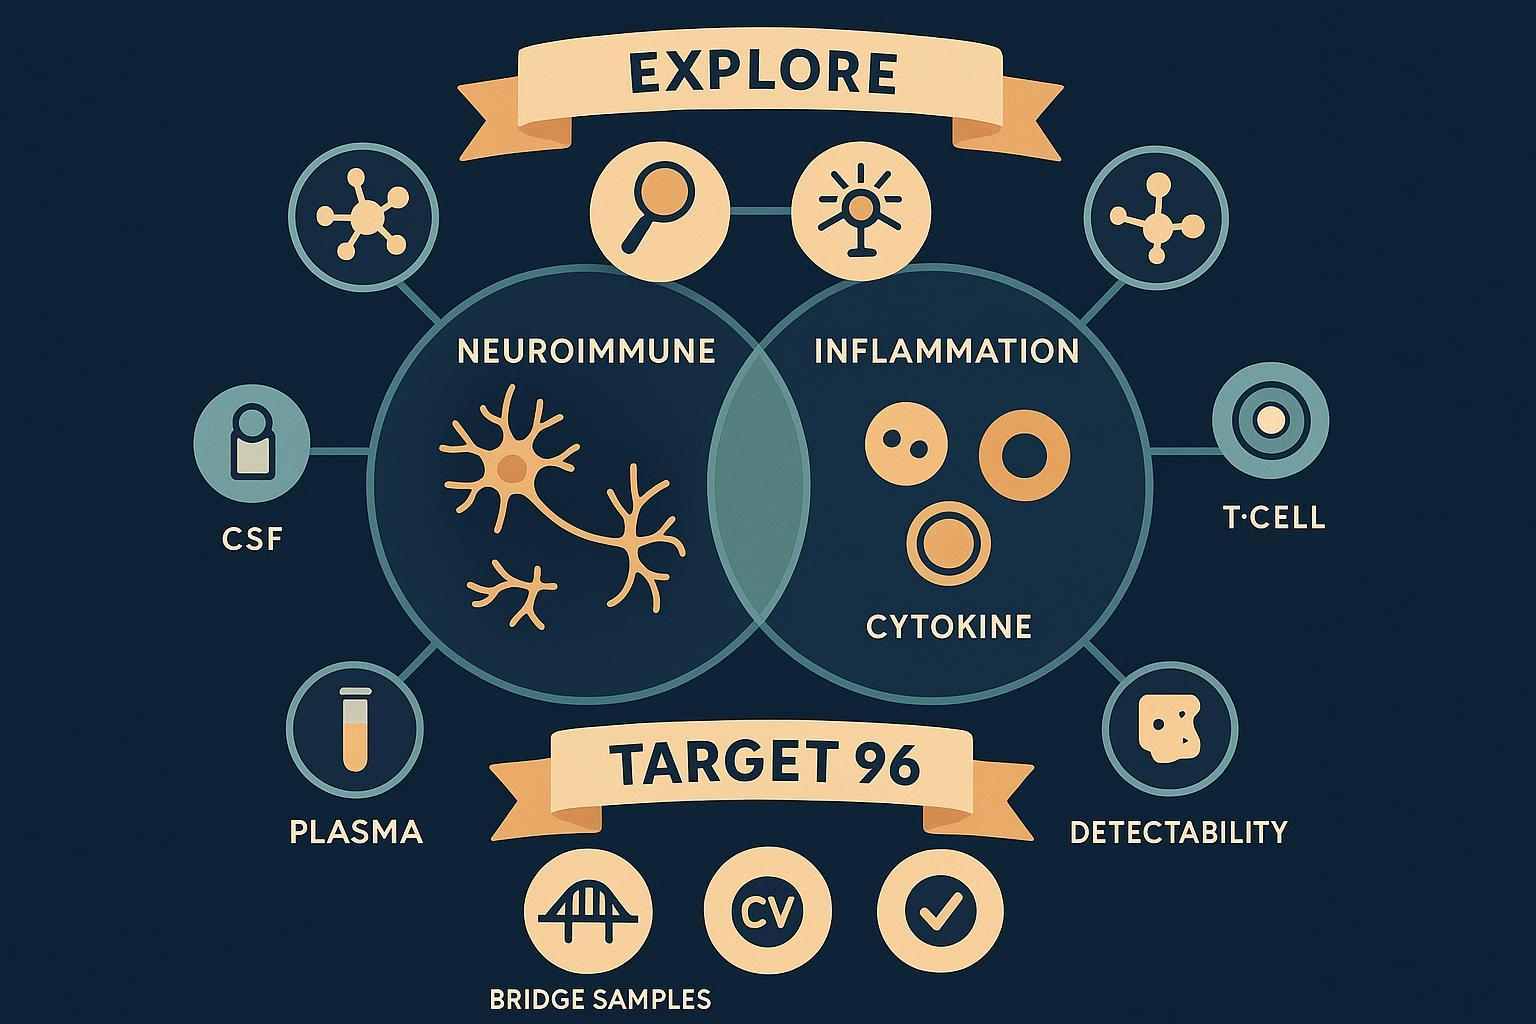
Single‑pathway panels often miss off‑axis biology. In neuroimmune studies, microglial signaling intersects with systemic inflammation, endothelial function, complement pathways, and metabolic stress. Multi‑panel Olink proteomics lets teams cover thousands of proteins in discovery and then lock onto the most informative markers for validation and stratification.
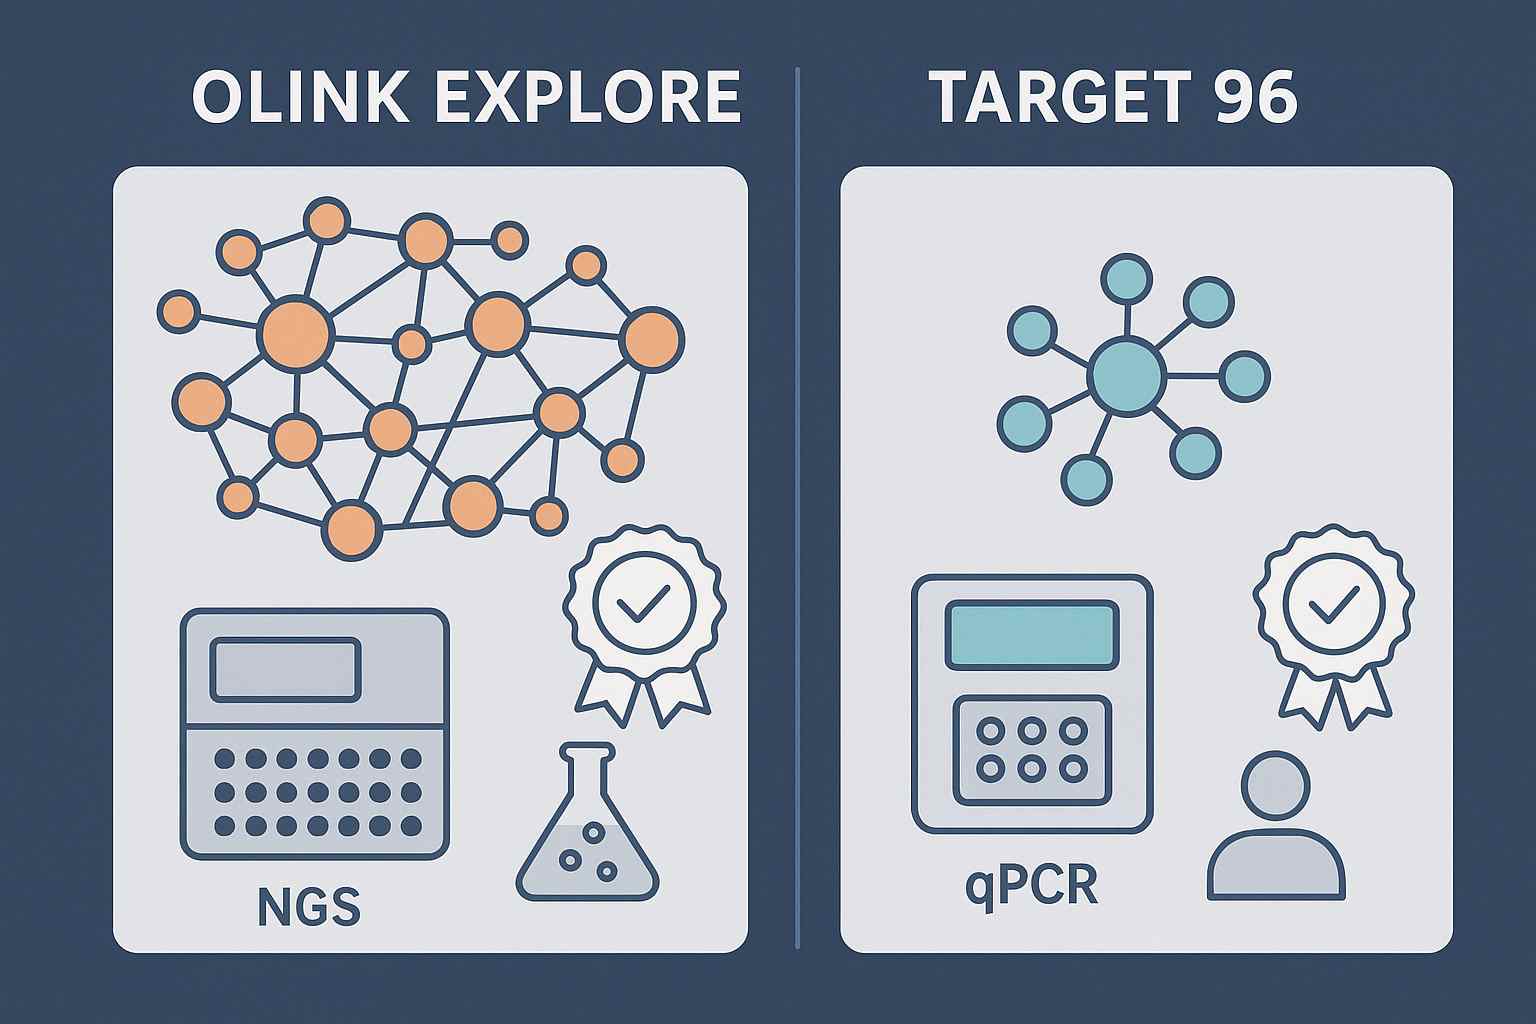
- Discovery at scale: Olink Explore (including Explore HT) profiles thousands of proteins with an NGS readout suitable for large cohorts and complex phenotype mapping. See capabilities of the Olink Explore series.
- Targeted validation: Olink Target 96 panels focus on ~92 proteins with high specificity and sensitivity, perfect for longitudinal clinical studies. Review the Olink Target 96 overview.
- Cohort evidence: Recent CNS/immune examples include a two‑step study quantifying 92 plasma inflammatory proteins in NMOSD and CSF proteomics across HIV infection stages using Explore 1536, illustrating matrix diversity and neuroimmune relevance. For context, see the NMOSD inflammatory protein study (2024) and the CSF Explore 1536 across HIV stages (2024).
Multi-panel Olink proteomics: key panels for neuroimmune and inflammatory research
Choosing between Explore and Target 96 hinges on study phase and goals. A phased approach reduces blind spots while ensuring data is practical for clinical decision‑making.
Explore series for discovery breadth
Explore (HT/3072/1536) is ideal for early‑phase discovery, pathway cross‑talk analysis, and candidate prioritization across neuroimmune and inflammatory axes. Teams commonly use Explore to map signatures from plasma, CSF, and tissue with minimal input volumes and high throughput.
Target 96 for validation and stratification
Target 96 panels provide focused, high‑specificity measurement with qPCR readout, suitable for longitudinal studies, patient stratification, and clinical endpoints. Typical use is to verify and refine candidate markers identified in Explore across cohorts and centers.
If you're deciding which panel fits your phase and matrix, review the internal explainer on how to choose the right Olink panel.
Integrating multi-panel proteomics with other omics
Multi‑panel proteomics is strongest when integrated with transcriptomics/genomics for causal inference and richer patient segmentation. Because Explore uses NGS, it aligns naturally with RNA‑seq pipelines and genomic variant data.
- Align protein signals with gene expression modules to refine mechanism hypotheses and prioritize targets.
- Use proteogenomic joins to test pathway consistency across omics layers.
- Add orthogonal validation (e.g., LC‑MS) to confirm absolute quantitation and PTMs when relevant.
For background on NPX normalization and bridging concepts, Olink's references on NPX are useful starting points; see the Olink NPX FAQ.
Best practices for cross-center reproducibility and batch-effect correction
Here's a decision‑oriented harmonization SOP you can adapt for neuroimmune/inflammation cohorts. Treat these as starting recommendations subject to subject‑matter expert review in clinical contexts.
- Study design and randomization
- Pre‑define bridge samples: pooled QC or overlapping references placed on every plate and at each site.
- Randomize sample placement across plates to avoid site/plate confounding with phenotype.
- Standardize metadata capture (matrix, collection method, storage/freeze‑thaw cycles) and enforce audit‑ready logs.
- QC gates and metrics
- Monitor intra/inter‑plate CVs; set pass/fail bands aligned to platform documentation and project tolerance.
- Require bridge‑sample correlation targets (e.g., high Pearson/Spearman concordance) to confirm assay "bridgeability."
- Apply detectability filters and review LOD/LOQ evidence per assay; set % missingness thresholds for analysis inclusion.
- Diagnostics and normalization
- Visualize batch effects using PCA/UMAP and NPX distributions before normalization.
- Use appropriate normalization (e.g., median centering and reference‑based bridging) and re‑diagnose post‑normalization.
- Document all steps with pre/post plots and sensitivity analyses.
- Governance and reporting
- Establish role‑based QC sign‑off (wet lab, data science, PI) and a unified change log.
- Report NPX shift diagnostics, bridgeability plots, and CV summaries in every data release.
- Keep raw and normalized datasets organized for re‑analysis and audit.
For a deeper methodological explainer (diagnostics, bridging, normalization visuals), see this internal overview of the Olink data analysis process.
Evidence summary — independent anchors: third‑party work supports running shared reference/pooled QC samples on every plate, using two‑step (within‑batch then across‑batch) normalization, and verifying correction by PCA and bridge‑sample correlations. For example, the Synthetic Plasma Pool Cohort Correction (SPOC) method demonstrates cost‑effective cross‑cohort alignment for Target 96 studies, the UK Biobank Olink normalization note describes a two‑step intensity normalization with per‑plate references, and Olink's documentation details NPX bridging diagnostics. These are starting recommendations requiring SME confirmation.
To ground these methods in primary sources, review Olink's 2022 NPX calculation and normalization documentation for definitions of NPX, QC, and project‑to‑project bridging; see the NCI BRD Olink Explore HT Analytical Validation (2025) for an external SOP detailing platform validation; and, for disease‑area context, the 2024 CSF Explore 1536 analysis across HIV stages on PubMed Central illustrates matrix‑specific neuroimmune patterns at scale.
In multi‑site studies, some teams coordinate standardized Olink processing and QC artifact generation through a single partner to reduce variation and improve auditability; others operate fully in‑house or with multiple qualified CROs. Choose the route that best fits your governance and capacity.
Challenges in multi-panel integration—and how to overcome them
- Data join and standardization
- Challenge: Heterogeneous matrices (CSF, plasma, tissue) and panel mixes complicate scaling.
- Strategy: Mandate metadata schemas, unify NPX processing, and define matrix‑specific QC gates and detectability filters.
- Batch effects across centers
- Challenge: Site‑specific shifts can mask or mimic biology.
- Strategy: Increase bridge sample density, enforce randomization, and validate normalization with pre/post diagnostics.
- Panel heterogeneity
- Challenge: Explore and Target 96 have different readouts and coverage.
- Strategy: Plan overlap through shared markers and define cross‑panel comparison rules.
- Underpowered cohorts
- Challenge: Small sample sizes yield unstable signals.
- Strategy: Pool discovery cohorts, pre‑register analysis plans, and stage validation runs with Target 96 across centers.
For platform capabilities and cross‑panel context, Olink's materials on Explore HT and validation are helpful; review the Olink Explore HT product page and the NCI BRD analytical validation overview.
Case studies: successful multi-panel proteomics in neuroimmune/inflammatory research
These anonymized vignettes illustrate how teams structure cohorts, panels, and QC gates across a 4–6 month window.
Case 1: Neuroimmune discovery → validation
- Cohort: 600 plasma samples across three centers.
- Panels: Explore 1536 for discovery; Target 96 inflammation panel for validation.
- QC: Bridge samples per plate/site; CV summaries logged; NPX pre/post normalization plots; detectability filters applied.
- Timeline: 5 months from first plate to integrated report.
- Outcome: Shortlist of cytokine and complement markers advanced to stratification.
Case 2: CSF and plasma cross‑matrix harmonization
- Cohort: 320 CSF + 480 plasma samples across two centers.
- Panels: Explore HT for CSF discovery; Target 96 neurology and inflammation panels for follow‑up.
- QC: Matrix‑specific LOD reviews; bridgeability correlation targets per matrix; PCA/UMAP diagnostics.
- Timeline: 6 months including multi‑omics joins with RNA‑seq.
- Outcome: Cross‑axis signature integrating microglial and systemic inflammatory signals.
Case 3: Longitudinal stratification in a multi‑center cohort
- Cohort: 1,000 plasma samples across four centers, three timepoints.
- Panels: Explore 3072 discovery baseline; Target 96 for follow‑up stratification.
- QC: Randomized plate layouts; bridge sample triplicates; governance sign‑offs; sensitivity analyses.
- Timeline: 4–6 months with staged releases and validation checkpoints.
- Outcome: Stable stratification markers aligned with clinical phenotypes.
Contextual, peer‑reviewed anchors that show matrix diversity and neuroimmune relevance include the NMOSD inflammatory protein study (2024) and CSF Explore 1536 across HIV stages (2024). For population‑scale norms, see the UK Biobank proteomics profiling context (2025).
FAQ: expanding multi-panel proteomics for neuroimmune and inflammatory markers
What is the difference between Olink Explore and Target 96 panels in neuroimmune research?
Explore (NGS readout) offers thousands of proteins for discovery and pathway cross‑talk analysis; Target 96 (qPCR readout) focuses on ~92 proteins for validation and longitudinal stratification. Many programs use Explore to identify candidates, then Target 96 to confirm and scale across centers.
How do I integrate proteomics with transcriptomics in neuroimmune studies?
Align proteins from multi‑panel Olink proteomics to gene expression modules (e.g., co‑expression networks). Use NGS‑based Explore outputs to harmonize with RNA‑seq, and test pathway consistency. Consider orthogonal LC‑MS for absolute quantification when decisions hinge on precise levels. A practical starting point is the Olink NPX FAQ.
What are the challenges when working with multi-panel proteomics in large cohort studies?
Batch effects, matrix heterogeneity, and panel differences are common. Define bridge samples and metadata standards early, increase randomization, and apply normalization with visible pre/post diagnostics. Cross‑panel overlap rules help when moving from Explore to Target 96.
Can multi-panel Olink proteomics help identify early biomarkers in inflammatory diseases?
Yes—programs often use Explore for broad signal detection across cytokines, complement, and neuroinflammatory pathways, then confirm promising markers with Target 96 in longitudinal cohorts. The approach reduces blind spots and improves reproducibility when paired with standardized QC.
How do I ensure data consistency when using multiple panels for cross‑disease analysis?
Use shared markers and bridge samples across plates and sites, enforce detectability and missingness thresholds, and standardize NPX processing. Visualize batch effects and document normalization decisions.
Conclusion: unlocking new insights with multi-panel proteomics
Multi‑panel Olink proteomics, executed with harmonization front‑of‑mind, gives neuroimmune and inflammatory teams a scalable way to see the full interaction network—and to trust the signals. Start with bridge samples, metadata standards, and QC gates; use Explore to cast a wide net; confirm with Target 96 in cross‑center cohorts; and integrate with transcriptomics/genomics to sharpen causal hypotheses.
Author and credentials
Creative Proteomics Translational Science Team. The team collectively brings extensive experience designing and coordinating multicenter biomarker studies and has overseen Olink‑based discovery‑to‑validation programs (Explore → Target 96) in neuroinflammation research.
Core capabilities include study harmonization, bridge‑sample design, standardized QC and reporting workflows, and audit‑ready data governance.Conflict of interest disclosure: This article is published under a team byline rather than an individual author. Creative Proteomics offers Olink assay and multi‑omics services and contributed editorial input on technical accuracy; recommendations in this guide are technical examples and should be interpreted in the context of study objectives and independent expert review. For details on services referenced in this article, see Creative Proteomics — Olink assay services.
For a practical orientation on panel choice and harmonized workflows, contact Creative Proteomics (Olink proteomics services) to discuss project coordination and service options.


