
Translational research depends critically on robust, sensitive, and interpretable proteomics data. Olink proteomics analysis—especially using Proximity Extension Assay (PEA) technologies—offers tools that help researchers move from discovery toward meaningful biological insight. Here we explore how to use Olink data effectively in translational (non-clinical) contexts: what its strengths are, how to integrate it, what pitfalls to avoid, and how to plan for scale.
Advantage of High-Sensitivity, High-Multiplex PEA Data for Research Translation
Olink's PEA (Proximity Extension Assay) is built for sensitivity and multiplexing. Key advantages:
Dual-antibody recognition + DNA tagging reduces background and cross-reactivity. Each protein target requires two antibodies tagged with matched oligonucleotides. Only when both bind does a DNA extension event occur. This gives high specificity.
Low sample volume: Many Olink Explore / HT panels need as little as ~2 µL serum or plasma. That is especially useful in studies with limited sample availability (e.g., biobanks, small model organisms, rare sample types).
Wide dynamic range and detection of low-abundance proteins: Some proteins circulating at very low levels (fg/mL) are difficult for standard immunoassays or MS without enrichment. PEA allows detection of many of those, making possible early changes, mechanistic insights, or discovery of subtle biomarkers.
Scalability / high throughput: Platforms such as Olink Explore HT enable measurement of thousands of proteins in many samples, with automated workflows and software support. This supports large discovery cohorts or population-scale projects.
These advantages mean that for non-clinical translational research—whether biomarker discovery, mechanistic biology, comparisons across cohorts, or integrating with other omics layers—Olink proteomics data can deliver actionable insight more efficiently than many older methods.
Major Translational Applications: Biomarker Discovery, Stratification, and Mechanistic Insight
Here is how Olink proteomics data are being used in translational research, with concrete examples from published studies.
Biomarker Discovery in Large Cohorts / Population Studies
The UK Biobank Pharma Proteomics Project (UKB-PPP) used Olink Explore / HT to profile over 50,000 samples in its pilot phase, measuring ~3,000 proteins. These data are being used to map protein-trait associations, uncover genetic influences on the proteome, and identify biomarker candidates.
Regeneron Genetics Center's selection of Olink Explore HT for nearly 200,000 samples in the Geisinger Health Study shows how proteomics is scaling for hypothesis generation at a massive scale. This allows detection of modest effect sizes and low abundance proteins.
Patient or Condition Stratification / Signature Development
In research of immune response, cancer immunology, or response to experimental drugs, Olink panels have been used to distinguish subgroups (e.g., high vs low responders) by protein signature patterns. While many of these are still preclinical, they help with trial design, mechanism validation, and target prioritization. (Specific peer-reviewed examples: see Proximity Extension Assay in Combination with Next-Generation Sequencing for high-throughput proteome-wide analysis using ~1,500 proteins across 96 samples to examine proteomic dynamics in patient samples.)
Mechanistic Biology and Pathway Discovery
Because PEA allows many targets and low volumes, researchers can study signaling cascades, inflammation pathways, tissue injury / repair, etc., even in rare sample types (e.g., CSF, cell culture supernatant, tissue lysates). For example, comparative measurements in matched serum vs plasma show differences that are biologically meaningful and must be accounted for in mechanism studies.
Integration with genomics: protein quantitative trait loci (pQTL) studies are feasible; UKB pilot data show many genetic loci correlated with protein levels. These help in target validation, inference of causality, etc. (UKB-PPP again; see Olink publications filtered by "protein genetics / proteogenomics" in their publication portal).
Using Diverse Sample Matrices
Not just plasma/serum—CSF, urine, tissue lysate, etc. For rare or precious sample types, Olink platforms often allow detection with less input, enabling comparative studies even where sample quantity is constrained.
Also, studies comparing serum vs plasma proteomes reveal that certain proteins are more reliably measured in one vs the other; these insights help shape design and avoid misinterpretation.
These applications illustrate how Olink data can move from mere lists of differential proteins toward translational insights: signatures, mechanistic hypotheses, stratification, and target prioritization.
Workflow & Panel Comparisons
Here I propose embedded diagrams / figure ideas and include panel comparison tables to help clarify technical choices.
PEA / Olink Explore HT Workflow (Sample → Data)
- Sample collection & handling
- Antibody probe incubation + paired antibodies + oligo pairing (dual-antibody recognition)
- DNA extension / hybridization
- Amplification (PCR or NGS readout)
- Library prep / sequencing or qPCR readout
- Data normalization (NPX), QC & filtering
- Data analysis: differential expression, pQTL, signature, stratification
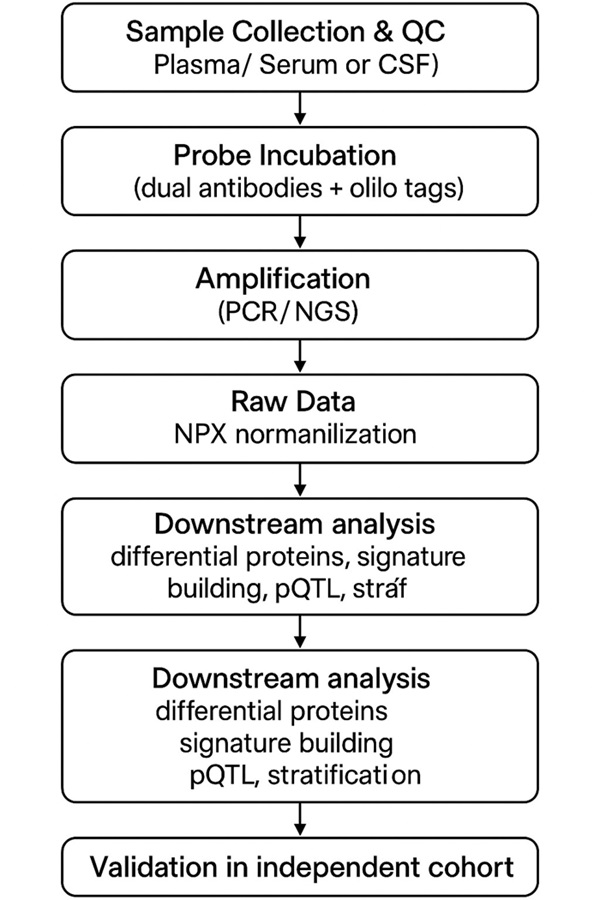 Figure: Workflow of Olink PEA Explore-HT from sample to data. The diagram illustrates each step from sample collection and probe incubation to amplification, NPX normalization, downstream analysis, and independent validation.
Panel Comparison Table
A table comparing features of different Olink panel types:
| Panel Type | Number of Proteins / Targets | Sample Volume Requirement | Throughput | Best-Use Case |
| Target 48 / Target 96 | ~45-100 | very low (~1-2 µL) | medium | hypothesis validation, focused study, less exploratory |
| Explore / Explore HT | ~3,000 proteins (pilot) → up to 5,400+ | moderate sample input (few µL) | high / population scale | large cohorts, discovery & pQTL, broad pathway coverage |
| Custom / Focus / Flex Panels | user-chosen subset | minimal | tailored | follow-up of discovery signatures, cost optimization |
Use cases:
- If sample volume is very limited (e.g., rare model organism, CSF), use a smaller panel with high sensitivity.
- For population-scale discovery, Explore HT offers ability to measure thousands of proteins and link to genetics.
Ensuring Robustness & Reproducibility in Translational Olink Studies
High-throughput proteomics data is powerful only if robust. Here are best practices and potential pitfalls to watch out for when using Olink data in translational research.
| Aspect | Key Considerations | Practical Tips |
| Sample collection & handling | Sample type (plasma vs serum), time to freeze, storage temperature, freeze-thaw cycles affect protein stability. Matching across cohorts matters. | Use standardized protocols; include metadata; process all samples similarly whenever possible. |
| Batch effects & plate / procedural variation | Different plates, reagent lots, dates can introduce systematic bias. Large studies often span many runs. | Include pooled controls; randomize sample placement across plates; use internal QC control samples. |
| Detection limits, missing data | Some proteins will fall below the limit of detection (LOD) in many samples. If missingness correlates with biological group, may bias results. | Report rates of missingness; consider imputation only when appropriate; treat proteins with very low detectability cautiously. |
| Normalization & data transformation | NPX (Normalized Protein Expression) values are relative. Differences due to abundance scaling must be handled properly. | Use logs; consider standard Normalization across plates; confirm consistency of key proteins across panels. |
| Validation in independent cohorts | Discovery findings risk overfitting. Replication in separate samples is essential. | Reserve independent set; verify signature performance in new sample types; if possible, cross-site replication. |
| Statistical power & effect sizes | Smaller studies may lack power to detect subtle proteomic changes. Also, multiple testing is nontrivial when thousands of proteins. | Calculate power ahead; adjust p-values; use false discovery rate (FDR) control; focus on effect sizes and biological plausibility, not just p-values. |
Implementing these practices helps ensure that findings are reproducible and more likely to translate further (e.g.,, into assay development, or informing therapeutic hypotheses).
Integrating Olink Data with Other Omics Layers to Enhance Insight
Proteomics is one layer; combining it with genomics, transcriptomics, metabolomics, etc., adds value in translational research.
Genomics + Proteomics (Proteogenomics / pQTL Studies): Identify genetic variants that influence protein levels. These help in causal inference (does gene → protein → trait) rather than mere correlation. UKB-PPP data has already enabled many protein-trait genetic associations.
Transcriptomics vs Proteomics: mRNA levels often only partially correlate with protein abundance, especially for secreted proteins, post-translational modifications, or proteins with regulation at translation or degradation. Olink data helps confirm which signals at the transcript level are mirrored at the protein level, and which are not.
Metabolomics / Lipidomics Integration: Proteins often regulate metabolism; integrating protein signatures with metabolite changes gives mechanistic pathways and potentially allows earlier signals.
Time-course / Longitudinal Omics: Repeated sampling over time gives insight into dynamics; combining, e.g.,, proteomics + transcriptomics across time reveals the order of molecular events.
Be aware of data harmonization issues: different omics have different dynamic ranges, missing data problems, measurement noise. Use network analysis, multivariate statistics, machine learning where appropriate, but ensure interpretability.
Case Studies: Translational Successes Using Olink Proteomics Data
Here are several published examples illustrating how Olink data has already driven translationally useful insight (still research use, non-clinical).
Serum / Plasma vs CSF Proteome Comparison
A recent study (two cohorts) collected matched serum and plasma, used high-throughput PEA to measure proteins, and compared detectability, relative abundance, and reproducibility across these matrices. They found systematic biases for many proteins depending on matrix, and identified which proteins are reliably measurable in both. This helps in choosing sample type for biomarker or signature discovery.
UK Biobank Pharma Proteomics Project (Pilot, then Larger Scale)
The pilot phase: ~54,000 participants, ~3,000 proteins measured (Olink Explore / Explore 3072). Outcomes include genotype-protein associations, identification of candidate biomarkers for many traits, and public release of data for community interrogation. This allows others to test their own hypotheses on proteomic variation across age, sex, lifestyle, etc.
High-Throughput Proteome-Wide PEA + NGS Readout
The study "Proximity Extension Assay in Combination with Next-Generation Sequencing for high-throughput proteome-wide analysis" (≈1,500 proteins × 96 samples) showed capacity to generate ~150,000 data points per run. They demonstrated how this can power studies of biological dynamics, disease severity (in research studies), and patient stratification.
These examples show how Olink proteomics analysis enables more than just snapshot differential protein lists; they drive discovery of biological signatures, genotype-protein links, and better sample/matrix decisions.
Challenges and Pitfalls: What Researchers Must Be Wary Of
Even with strong tools like Olink, translational research has risks. Here are common pitfalls to anticipate:
Overfitting / multiple hypothesis bias: With thousands of proteins measured, many correlations arise by chance. Without replication, false positives are frequent.
Batch / plate / reagent variability: Over large-scale runs, systematic biases can creep in. Without proper controls, leading proteins may reflect technical artifacts rather than biology.
Matrix effects & sample type variation: Plasma, serum, CSF etc. differ in protein content, interfering substances, binding proteins; also sample collection methods (anticoagulants etc.) matter.
Detection limits & missingness: Some proteins will always be near or below detection; if groups differ in missingness, that may bias results.
Cross-platform comparability: Different Olink panels (Target 48, Target 96, Explore, Explore HT) and readout modes (qPCR vs NGS) may give different dynamic range, background, or detection characteristics. Comparing across them requires calibration.
Interpreting NPX / relative values: NPX is relative expression; without absolute quantification, translation to mechanistic or functional claims needs careful validation.
Reproducibility / validation: Discovery must be followed by replication in independent cohorts; cross-site or cross-lab validation enhances confidence.
Being aware of these avoids wasted effort, cost, and helps ensure findings are meaningful.
Strategic Roadmap: From Olink Data to Translational Impact
To maximize the utility of Olink proteomics data, researchers should plan a pathway. Here is a checklist / roadmap:
Define Biological / Translational Question Clearly
- What do you want to detect / predict / understand (e.g., early changes, response, mechanism)?
- What sample types are available? What volumes?
Select Appropriate Olink Platform / Panel
- For broad discovery: Explore HT / Explore 3072 (many proteins).
- For hypothesis validation: Target 96 / Target 48 or custom Focus / Flex panels.
- Consider sample matrix compatibility, detection limits, assay sensitivity.
Design Study for Sufficient Power & Controls
- Include enough samples to detect expected effect sizes.
- Randomize samples across plates / runs. Include technical replicates & QC samples.
Collect & Handle Samples Uniformly
- Standardize collection, processing, storage.
- Document metadata (time of day, fasting status, anticoagulant, etc.).
Run Assays & Perform QC
- Check internal controls, plate effects.
- Examine assay‐level detection rate, CV (coefficient of variation), missingness.
Statistical Analysis with Adequate Adjustment
- Correct for covariates (age, sex, batch, sample type).
- Use multiple test correction (e.g., FDR). Evaluate effect size, not only p-value.
Validation Phase
- Validate findings in independent cohorts / sample sets.
- Prefer sample types intended for downstream application.
Integration with Other Layers & Biological Interpretation
- Map identified proteins to known pathways or networks.
- Correlate with transcriptomics, metabolomics, genetics where available.
Documentation & Data Sharing
- Share methods, QC metrics.
- If possible, deposit data or summary into public data portals (subject to institutional / funding constraints).
Plan Next Steps for Translational Moves
- If the signature seems promising, plan for assay reproducibility, possibly custom panels.
- Discuss with collaborators (e.g., CROs, other labs) to test reproducibility.
- Consider IP, funding pathways if moving toward commercial / regulatory assay (still in non-clinical realm).
Future Trends in Translational Proteomics with Olink Data
Looking ahead, here are directions where Olink proteomics is likely to contribute more and where researchers should watch for opportunities.
Even larger population-scale datasets: Projects like UKB-PPP scaling to hundreds of thousands of samples allow finer stratification, rare variant effects, gene-environment interactions.
Improved readout speed, cost efficiency: Automated workflows, reagent optimization, software pipelines reduce per-sample cost/time, enabling more iterative / dynamic studies.
Custom panels and signature transition: As more validated protein signatures emerge, custom Flex / Focus panels will allow researchers to build focused assays for preclinical or mechanistic follow-up.
Greater integration with AI / machine-learning / network modeling: Using large proteomic + genetics + clinical metadata datasets to build predictive models, pathway network models.
Better cross-platform harmonization: Standardizing measurement across panels, labs, sample types (serum/plasma/CSF) to allow meta-analysis and reuse of data.
Expanding sample matrices: Better capacity for tissue, exosomes, secreted proteins, microvesicles, possibly single-cell proteomics or near-single-cell, though the latter remains more in MS realm; but PEA / Olink may expand sensitivity.
Conclusion
Olink proteomics analysis offers research teams powerful tools to translate protein data into biologically meaningful insight. When used thoughtfully—with strong study design, robust QC, appropriate sample matrices, and validation—Olink datasets enable:
- identification of meaningful biomarker candidates,
- stratification of sample cohorts,
- mechanistic pathway discovery, and
- integration with other omics for deeper insights.
If you are planning a translational proteomics project, here are concrete next steps:
- reach out for expert consultation to choose the right Olink panel or custom design,
- pilot your study including QC and replicate samples to assess performance in your hands,
- explore public datasets (e.g.,, UKB-PPP) to test hypotheses or compare findings,
- contact us (or your preferred service provider) to get a quote / timeline for Olink proteomics services.
For further reading and to deepen your understanding:
"Understanding Olink's Data Analysis Process: From Raw Data to Insights" — learn the best practices for handling NPX values, QC, normalization etc.
"Olink Proteomics in Oncology and Biomarker Discovery" — examples in oncology where biomarker signatures have been explored using Olink.
"Olink Proteomics for Large-Scale Population Studies: A Success Story" — deep dive into population/cohort studies using Olink.
References
- Wik, L., Nordberg, N., Broberg, J., Björkesten, J., Assarsson, E., Henriksson, S., Grundberg, I., Pettersson, E., Westerberg, C., Liljeroth, E., Falck, A., Lundberg, M. (2021). Proximity Extension Assay in Combination with Next-Generation Sequencing for High-throughput Proteome-wide Analysis. Molecular & Cellular Proteomics.
- Sun, B., Chiou, J., Traylor, M., … et al. (2023). Plasma proteomic associations with genetics and health in the UK Biobank. Nature.
- Wen Zhong, Fredrik Edfors, Anders Gummesson, Göran Bergström, Linn Fagerberg & Mathias Uhlén, etc. Next generation plasma proteome profiling to monitor health and disease. Nature Communications.
- Shraim R, Diorio C, Canna SW, Macdonald-Dunlop E, Bassiri H, Martinez Z, Mälarstig A, Abbaspour A, Teachey DT, Lindell RB, Behrens EM. A Method for Comparing Proteins Measured in Serum and Plasma by Olink Proximity Extension Assay. Mol Cell Proteomics. 2025


