
A New Era in Population Proteomics with the UK Biobank Olink Panel
Have you ever wondered what it takes to map thousands of proteins in tens of thousands of people—and what insights that power can unlock for basic research? The UK Biobank Pharma Proteomics Project (UKB-PPP), using the UK Biobank Olink panel, is doing just that. Over 54,000 participants have already had their plasma profiled with around 2,900 unique Olink Explore assays, producing a rich, standardized dataset for connecting genetic variation, environmental exposures, and molecular biology at scale.
This work isn't just about large numbers. It offers a leap forward in how researchers can build robust hypotheses—whether around genetic control of protein levels (pQTL), ancestry differences in proteomes, or predicting phenotype from proteomic signatures. The scale and design of UKB-PPP make it possible to move beyond small-cohort limitations.
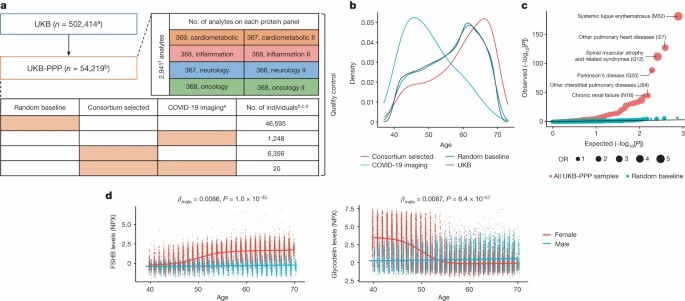 Fig 1. Proteomic profiling on blood plasma samples collected from 54,219 UKB
The UK Biobank Olink Panel Project: Scope & Design
The UKB-PPP represents one of the largest non-clinical proteomics efforts ever done. It uses Olink cutting-edge platforms to generate deep proteomic data across tens of thousands of plasma samples. Here are the core features that give the project its scale and rigor.
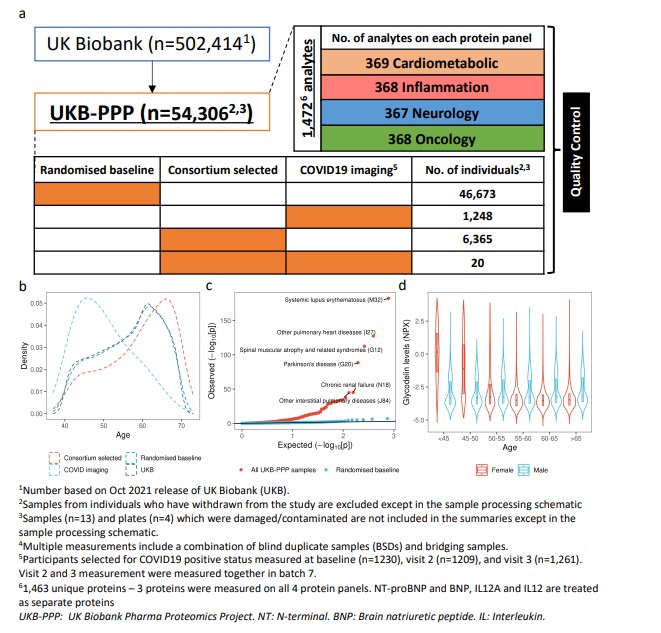 Fig 2. Overview of UKB-PPP
Project Size and Participant Cohorts
Pilot cohort: ~ 54,000 UK Biobank participants profiled, using the Olink Explore 3072 platform.
Full‐scale target: Expansion to ~600,000 samples across up to 5,400 proteins using the Olink Explore HT platform.
Consortium composition: Partnership among UK Biobank and ~13-14 biopharmaceutical companies.
Proteomic Coverage & Assays
Protein targets measured: In the pilot phase, ~2,900 unique proteins (≈2,923 distinct assay targets) via ~2,941 protein measurements.
Platforms used:
- Olink Explore 3072 for ~3,000 proteins in the pilot.
- Explore HT (high throughput) for the full-scale expansion to ~5,400 proteins.
Sample Types, Timing & Cohort Selection
Sample type: Plasma collected at baseline visits for most participants. Some samples drawn in repeated studies (e.g., imaging or follow-ups).
Subcohort inclusion:
- Majority are randomly selected baseline participants (~46,600).
- A smaller group of "consortium-selected" participants chosen for specific features (e.g., age, ancestry, specific health traits).
Quality Control, Data Format & Access
Normalization and NPX format: Protein levels expressed via Normalized Protein Expression (NPX); assay versions, limit of detection, lot and batch effects tracked.
QC pipeline steps include: sample withdrawal filtering; removal of control samples; outlier detection; exclusion of data with QC or assay warnings; checks for sample swaps.
Data availability: Pilot dataset (~54,000 samples / ~3,000 proteins) available via UK Biobank's Research Analysis Platform and public data releases. The expanded dataset to follow in later stages.
Key Advantages of Olink in Population-Scale Studies
Olink technology offers several unique strengths when applied at the scale of UK Biobank-type cohorts. Below are the major advantages, supported by recent evidence from peer-reviewed studies.
High Coverage of Protein Targets & Deep Genomic Integration
In the Sun et al. (2023) study, plasma proteomic profiling using Olink Explore 3072 measured ~2,923 unique proteins in 54,219 UK Biobank participants. This enabled mapping of 14,287 primary genetic associations (pQTLs), of which ~81% were novel.
The data include ancestry-specific pQTLs in non-European groups, enhancing the ability to understand genetic effects across populations.
Robust Quality Control & Reproducibility
The UKB-PPP QC protocol involves multiple steps: sample selection, removal of control samples, outlier detection, assay QC, and detection of sample swaps, ensuring high data integrity.
NPX data are accompanied by metadata such as assay lot, batch number, plate ID, and limit of detection per assay per plate, enabling downstream adjustment of batch effects and ensuring reproducibility.
Strength in Ancestry Diversity & Discovery of Novel Associations
By stratifying analyses by British/Irish, African, and South Asian ancestries, researchers using UKB-PPP with Olink discovered variant–protein associations not detectable in European-only cohorts.
The proportion of Olink assays that show cis-pQTLs (an indicator of assay specificity) is ~72%, significantly higher than some alternative high-throughput platforms (e.g., ~43% in SomaScan in one comparison).
Enhancing Predictive Models and Pathway Insights
The Sun et al. (2023) resource demonstrated that integrating protein levels improves prediction of demographic and health indicators beyond standard covariates.
Large-scale proteomics using Olink permits detailed mapping of pathways, ligand-receptor interactions, complement and cytokine networks, and epistatic effects (e.g., ABO blood group, FUT2 secretor status). These insights are enabled by the depth and specificity of assays.
Scalability & Future Expansion Potential
The pilot phase profiled ~54,000 samples; the full UKB-PPP aims to process up to 600,000 samples measuring over 5,400 proteins using Olink Explore HT. This represents exceptional scale for any non-clinical proteomics project.
The large sample size supports discovery of both common and rare variant effects, including associations with small effect sizes, which would be underpowered in smaller cohorts.
Case Study Findings: What UKB-PPP Has Revealed
Here are several recent, less-cited UK Biobank + Olink studies that demonstrate how large-scale proteomics unlocks new knowledge in aging, risk stratification, and organ‐level biology.
Case 3.1: Frailty Onset & Mortality in Prefrail / Frail Populations
Xu et al. (2024) examined 43,895 participants aged 39-70, using ~2,920 proteins measured by Olink Explore panels. They identified 102 proteins cross-sectionally associated with prefrailty and 90 with frailty status at baseline (after Bonferroni correction).
Prospective mortality analyses in prefrail (n=16,661) and frail (n=1,647) groups showed 87 and 48 proteins, respectively, significantly associated with risk of death. Among these, CD300E, GDF15, PLAUR emerged as overlapping markers in both baseline frailty and mortality prediction.
The predictive models used LASSO regression and gradient boosting machines, achieving good discrimination; key proteins for predicting death included GDF15, WFDC2, NEFL.
Why this is notable:
This study shows proteomic signatures can anticipate the progression from prefrailty to frailty and link to subsequent mortality. Researchers studying aging biology, functional decline, or lifespan extension may use these results to select candidate proteins for mechanistic follow-ups.
Case 3.2: Organ-Specific Biological Age ("Age Gaps") & Mortality Risk
Zhao et al. (2024) studied 45,821 UKB adults, using plasma proteomics (Olink Explore) to compute biological age for 12 major organs, comparing with individuals' chronological age. They defined "age gaps" (organ biological age minus calendar age).
Every organ age gap was associated with increased risk of all-cause mortality: risk increases ranged from 6%-60% per standard deviation in age gap. The more organs showing accelerated aging, the higher the mortality risk.
In cause-specific mortality analyses, e.g. brain age gap was strongly associated with deaths from mental and nervous system diseases (HR ~2.38 per SD), stomach age gap was an indicator for gastric cancer mortality.
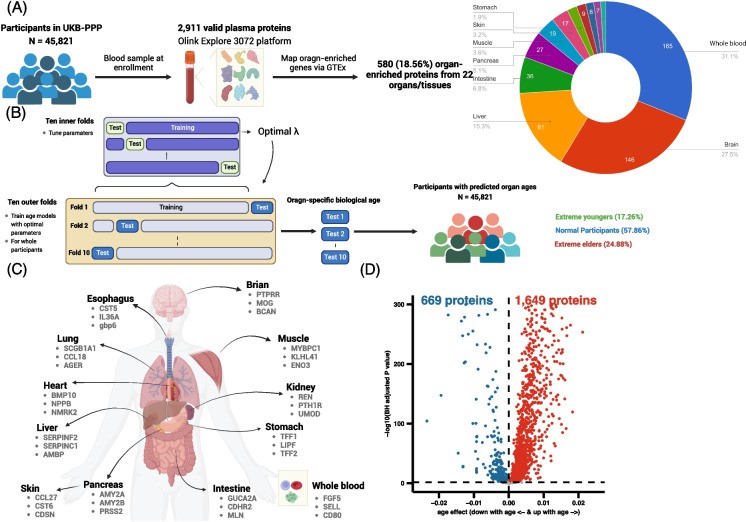 Fig 3. Overview of the plasma protein-based model for biologically aging.
Why this is notable:
This provides organ-level aging maps using proteomic data. It suggests that looking at organ-specific aging (not just whole-body) can reveal which systems are most at risk, guiding basic biology into aging, organ decline, and potentially interventions (in non-clinical research settings).
Case 3.3: Incident Disease & Mortality via Proteomic Risk Scores
In Nature Aging (Gadd et al., 2024), researchers used ~1,468 Olink proteins measured in ~47,600 UKB participants to test associations with 23 age-related diseases and mortality.
They found 3,209 protein-incident disease associations (out of 21 disease outcomes). Then they constructed "ProteinScores" (using penalized Cox regression) that improved prediction for six outcomes beyond standard risk factors, clinical biomarkers and lifestyle variables. For example, the ProteinScore for type 2 diabetes outperformed a polygenic risk score + HbA1c.
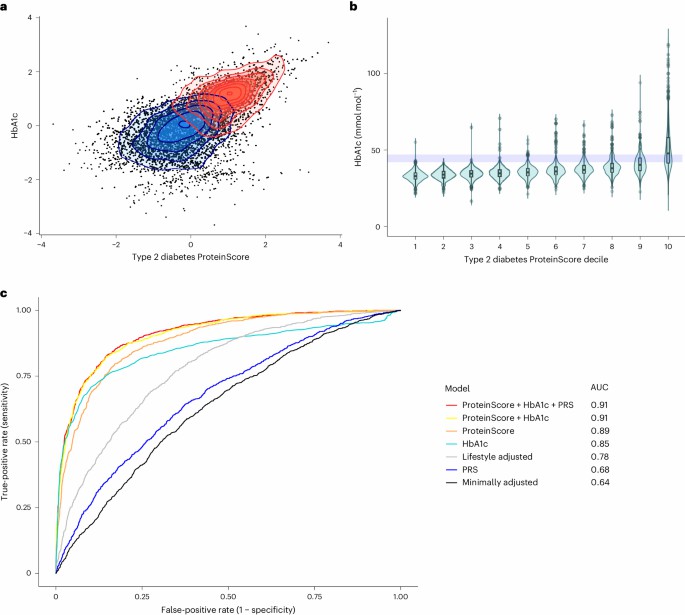 Fig 4. Exploration of the type 2 diabetes ProteinScore.
Why this is notable:
This demonstrates proteomics isn't just descriptive—it adds predictive power for incident disease. For researchers interested in risk modelling, molecular epidemiology, or biomarker discovery (non-clinical), such results validate that Olink panels can contribute meaningfully beyond classical risk factors.
Authority & Collaborations
One major reason UKB-PPP has made such rapid progress is due to its strong consortium structure, rigorous data practices, and transparent partnerships. These elements establish its authority in population-scale proteomic research.
Consortium Structure & Industrial Partnerships
- UKB-PPP is a collaboration between UK Biobank and 14 leading biopharmaceutical companies.
- These industry partners include major names such as Amgen, AstraZeneca, Bristol Myers Squibb, Roche, GSK, Johnson & Johnson, Novo Nordisk, Regeneron, Takeda, and others.
- Thermo Fisher Scientific's Olink platform was selected as the proteomic technology provider for this project.
Funding & Governance
- The initial pilot phase profiled ~54,219 participants using ~2,900 proteins measured via Olink Explore 3072; this dataset is now in public release with QC protocols.
- For expansion to 600,000 samples (measuring ~5,400 proteins via Explore HT), the project is funded by the 14 biopharma companies plus UK government support of roughly £20 million.
- Governance includes sample QC pipelines (six steps: sample selection; control/sample removals; outlier detection; QC warnings removal; sample swaps detection) to ensure data reliability.
Publication Output & Data Availability
- The pilot has already led to landmark publications (for example, Sun, B. et al., Nature 2023) that map over 14,000 pQTLs in ~2,923 proteins.
- The pilot data (≈ 54,000 samples / ≈ 2,900 proteins) is made available to UKB-approved researchers; subsequent data releases are scheduled as the 600,000-sample phase advances.
Why This Consortium Gains Trust in the Research Community
- Scale and transparency: Large sample sizes, openly published QC protocols, and broad data sharing. These reduce biases and strengthen reproducibility.
- Multi-partner governance: Industry and academic partners holding stakes help ensure that both biological insight and rigorous methods are balanced.
- Platform reliability: Olink PEA (proximity extension assay) technology has been validated via QC across many plate, lot, and sample-handling batches. The UKB-PPP QC summary is publicly published.
Challenges, Lessons Learned & Best Practices
Scaling proteomic studies to tens or hundreds of thousands of samples (as with UKB-PPP + Olink) brings enormous opportunity—and a set of technical, statistical, and operational challenges. Below are major issues encountered, lessons learned from the pilot phase, and best practices researchers should follow.
Key Challenges
Batch Effects and Plate / Lot Variability
- UKB's Olink data include metadata for plate ID, assay batch, lot number, shipment date, all of which can introduce unwanted variation.
- Differences between assay lots or even plates can shift NPX values, requiring careful adjustment.
Limit of Detection (LOD) and Missing Values
- Many assays have a per-plate limit of detection. Values below LOD often result in "missing" NPX or undetectable signals. Deciding whether to impute, censor, or filter such values is nontrivial.
- Some "missing" values reflect very low abundances (biological signal), others assay failure; mixed causes complicate downstream modelling.
Outlier Samples & Sample Swaps
- Some samples behave anomalously (extreme PCA values, inconsistent replicate behaviour). The pilot QC protocol removes those via PCA / median-IQR outlier detection.
- Also, sample swaps or mis-labelling across plates need detection, to avoid false associations.
Ancestry Representation & Statistical Power in Non-European Groups
- While UK Biobank includes non-European ancestry participants (e.g. South Asian, African), sample sizes are much smaller. This limits power for discovery or replication in those groups.
- Genetic architecture (e.g. allele frequencies, linkage disequilibrium) may differ, affecting pQTL discovery.
Multiple Testing and False Discovery
- Profiling thousands of proteins across many phenotypes or outcomes multiplies statistical comparisons. Correcting for multiple testing (e.g. Bonferroni, FDR) may be overconservative for some analyses, but under-correction risks spurious findings.
Computational / Data Handling Complexity
- Handling huge NPX matrices, metadata (batch, assay version, plate, lot), and annotation (e.g. UniProt IDs) requires robust pipelines. Transforming, filtering, QC, joining multiple resource tables can be error-prone.
Lessons Learned
- Establish a rigorous QC pipeline from the start: UKB-PPP defined a 6-step QC for NPX data (sample selection, control removal, outlier detection, QC warnings, sample swaps etc.).
- Include assay-level metadata (batch, lot, plate, limit-of-detection, version) to allow downstream correction and filtering.
- Use mixed models or covariate adjustment (batch, plate, shipment date) in all downstream analyses to reduce technical noise.
- For missing / low-signal values, apply consistent decision rules: e.g. whether to discard assays with many values below LOD, impute missing values, or treat "missing" as a category depending on context.
- For rare variant / ancestry-specific discovery, increase sample sizes in under-represented groups if possible; if not, use meta-analysis or borrow strength across groups with methodological caution.
- In predictive modelling (e.g., risk scores, organ age gaps), cross-validation and external replication are essential to avoid overfitting (especially when many proteins are used).
Best Practices for Researchers
Here are concrete recommendations you can adopt, drawing on UKB-PPP's experience:
| Area | Best Practice |
| Data QC & Pre-processing | Use standardized QC steps (remove control samples, exclude withdrawn participants, remove outliers, control for plate & lot effects). Document every step for reproducibility. |
| Assay/Lot Information | Always keep assay version, lot number, shipment/plate date etc. in your dataset. Use these as covariates or random effects in statistical models. |
| LOD & Missing Data | Decide on missing data strategy beforehand: filter assays with high proportion below LOD; use imputation methods suited to proteomic data (if needed); include flags for "unreliable" measurements. |
| Statistical Correction | Apply appropriate multiple testing correction; consider methods like FDR for large p, but understand trade-offs. Use permutation or empirical null distributions when possible. |
| Ancestry & Subgroup Analyses | Where possible, stratify analyses by ancestry or adjust explicitly; for smaller subgroups, report uncertainty and confidence intervals carefully. |
| Reproducibility & Documentation | Version your data pipelines; share QC metrics and code; if sharing resource tables (as UKB did), make them easily joinable with NPX data (e.g. via assay ID, plate ID, etc.). |
| Interpretation & Biological Validation | When a protein is associated with a phenotype or outcome, look for external validation or functional annotation. Use ligand-receptor databases, pathway analysis, or follow-up experiments for plausibility. |
Implications for Researchers, CROs & Biotech
As the UKB-PPP continues producing large, high-quality proteomic datasets via Olink, the downstream implications for researchers, contract research organizations (CROs), and biotech firms are profound. Here's how different stakeholders can use these findings, what to anticipate, and how best to position future projects.
What Researchers Can Do Now
Integrate Proteomics with Genomics for Novel Hypothesis Generation
The UKB-PPP data (e.g. Sun et al., 2023) reveal thousands of protein quantitative trait loci (pQTLs), many previously unreported, across ~2,900 proteins in ~54,000 participants.
Researchers can mine these pQTLs to generate hypotheses about gene regulation, protein function, and downstream biological pathways.
Use Longitudinal / Repeated Measures
The project plans to include ~100,000 second (follow-up) blood samples in addition to ~500,000 baseline samples.
This enables dynamics studies: how protein levels change with age, exposure, or risk factor trajectories. Such designs improve power to detect early shifts, temporal trends, or lagged effects.
Develop Multi-Omic & Cross-Cohort Models
With NPX proteomic data now being paired with genomic, lifestyle, imaging, and phenotypic data, researchers can build richer models for risk stratification, exposure effects, and pathway perturbation. Cross-platform comparison (e.g., with SomaScan) indicates that combining datasets gives insight into which proteins are robust across technologies.
What CROs & Biotech Companies Should Consider
Validating Drug Targets using Genetic Evidence
The UKB-PPP data allow biotech clients and CROs to check whether a proposed protein target has strong genetic support (cis-pQTLs, trans-pQTLs) and consistent expression across relevant population subgroups. This strengthens target selection and may reduce downstream attrition risk.
Designing Discovery & Precompetitive Studies
Prioritize panels or platforms (e.g. Olink Explore, Olink Explore HT) that cover thousands of proteins with strong detection rates and good QC metadata. UKB's infrastructure demonstrates the value of assay metadata (batch, lot, LOD, plate) for downstream filtering and reproducibility.
Leveraging Shared Resources & Access
Data releases are staggered: portions of UKB-PPP data will be made available to UK Biobank-approved researchers beginning in 2026, full data by 2027. Companies with R&D goals can plan timelines around these releases to fetch proteomic data for target validation, biomarker idea vetting, or risk model building.
Strategic Benefits & Future Trends
Power to Detect Small Effects & Rare Variant Associations
As sample size climbs (to ~600,000), UKB-PPP will enable detection of associations with lower effect sizes—common in many biological processes. Also, rare variants (via exome sequencing or collapsing analyses) may be better represented, enabling discovery of strong effect proteins.
Improved Ancestry Representation & Generalizability
The UKB-PPP has made efforts to include non-European ancestries (e.g. British/Irish, South Asian, African) in pQTL mapping. Findings show that ancestry stratification reveals unique associations. Biotech and CROs should design studies with diverse populations to increase generalizability of biomarkers or targets.
Opportunities for Machine Learning & AI
The wealth of imaging, genetics, proteomics, lifestyle, and phenotypic data in UKB allows for multi-modal modelling. For example, organ-specific proteome changes, temporal proteomic trajectories, and phenotype prediction can all benefit from ML frameworks.
Regulatory & Ethical Considerations in Non-Clinical Research
Though the data are for research use only (non-clinical), best practices around data privacy, participant consent, and data sharing remain crucial. For biotech partners, transparency in assay validation, reproducibility of findings, and open metadata assist in building trust with regulators or scientific community.
Practical Advice & Planning for Your Projects
Select Panels with Strong Detection & Overlap for Your Research Area
If your interest is neurology, metabolism, aging, etc., check which Olink panels (Explore, Neurology, Inflammation, Oncology etc.) have high detection rates in UKB-PPP and either include or overlap proteins relevant to your biology.
Budget for Metadata, QC & Bioinformatics
For large-scale proteomics, budget should include bioinformatics support to handle QC steps, missing data / LOD issues, batch corrections. Using UKB's resources (e.g., olink_batch_number, plate/Lot metadata) as a template is helpful.
Plan for Delayed Data Access & Release Strategy
Since full datasets are released staggeredly, plan your internal project timelines to align with data availability. Early access projects (pilot or first-release data) can already deliver insights; later expanded data will allow deeper/longitudinal analyses.
Recommended Internal Reads
These are from our content library and complement the UKB-PPP story in useful ways.
Introduction to Olink Proteomics: What You Need to Know – This article lays out how Olink technologies work (e.g. PEA, NPX units), their benefits, and what to consider when designing a proteomics study. Great for those newer to proteomics or needing a refresher.
Olink Proteomics in Oncology and Biomarker Discovery – If your interest is in using proteomic signatures for target discovery or oncology research, this article covers key case studies, workflows, and caveats in biomarker panels.
Case Study: Using Olink Proteomics to Investigate Cancer Biomarkers – This gives a detailed example of how Olink panels have been used in cancer biomarker discovery, including panel selection, validation, and statistical modelling.
Conclusion
The UUKB-PPP, using the UK Biobank Olink panel, is redefining what population-scale proteomics can achieve. From its pilot phase (≈ 54,000 samples, ~3,000 proteins) to its expansion toward 600,000 samples profiling over 5,400 proteins, it demonstrates the strength of large, well‐controlled datasets in revealing biological insights at unprecedented scale.
Key lessons include:
- Deep genetic integration: pQTL and rare variant studies are yielding many novel associations.
- Robust QC and assay metadata are essential to ensure reproducibility across lots, batches, and plates.
- New analytical angles—such as organ-specific biological aging and frailty prediction—show that proteomic signatures reflect subtleties of biology not captured by standard clinical variables.
- Shared resources and collaborative funding (14 pharma partners + UK government) enable scale, timeliness, and trust.
- While challenges remain (batch effects; LOD / missingness; under-represented ancestries; handling of large data matrices), the precedents from UKB-PPP set a blueprint for rigorous, high-impact proteomic research.
If you're a researcher, academic institution, CRO, or biotech team considering population-scale proteomics or interested in mining proteomic signatures:
Explore our Olink Proteomics Services — We offer expertise in panel selection, QC pipelines, assay metadata handling, and large-cohort study design.
Request a Consultation — Let's discuss how your project can leverage lessons from UKB-PPP to maximize biological insight and statistical power.
References
- Xu, J., Liu, J., Tang, J. et al. Plasma proteomic signature of risk and prognosis of frailty in the UK Biobank. GeroScience 47, 2365–2381 (2025).
- Sun, B.B., Chiou, J., Traylor, M. et al. Plasma proteomic associations with genetics and health in the UK Biobank. Nature 622, 329–338 (2023).
- Genetic regulation of the human plasma proteome in 54,306 UK Biobank participants bioRxiv preprint 2022
- Zhao R, Lu H, Yuan H, Chen S, Xu K, Zhang T, Liu Z, Jiang Y, Suo C, Chen X. Plasma proteomics-based organ-specific aging for all-cause mortality and cause-specific mortality: a prospective cohort study. Geroscience. 2025 Apr;47(2):1411-1423.
- Gadd, D.A., Hillary, R.F., Kuncheva, Z. et al. Blood protein assessment of leading incident diseases and mortality in the UK Biobank. Nat Aging 4, 939–948 (2024).


