
Immune dysregulation cuts across oncology, autoimmunity, and inflammatory disease. When projects move from exploratory signals to decisions that affect a development plan, protein-level immune profiling becomes the practical lens: it captures secreted cytokines, chemokines, and immune checkpoints that aren't reliably inferred from RNA alone. This article focuses on the translational question that decides whether discovery work holds up in the real world: how to maintain cross-batch consistency and reproducibility as you advance an immune signature from discovery to validation—using the Olink proteomics assay as the working platform and immunotherapy response/resistance stratification as the running example.
![]()
Key takeaways
- Treat immune profiling as a decision-support workflow, not a one-off screen: plan discovery→verification→validation with bridging and predefined acceptance checks.
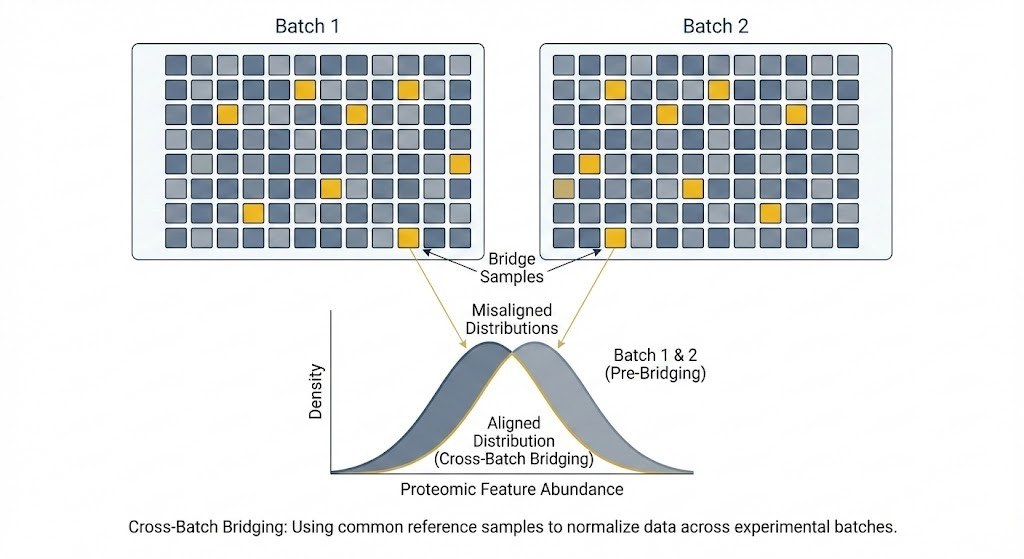
- Design cross-batch bridging up front. Anchor each new batch with 8–12 well-chosen biological bridge samples per plate, then verify success with PCA and per-assay shift diagnostics.
- Prefer robust bridge-based normalization (e.g., MOD or BAMBOO) over blind batch correction; evaluate residual batch signal before trusting downstream p-values, as detailed in the OlinkAnalyze bridging tutorial and the BAMBOO method paper.
- Stabilize the matrix and preanalytical variables (plasma vs serum, hemolysis, freeze–thaw). Hemolysis alone can perturb a large fraction of immune analytes, according to a 2025 study in Journal of Proteome Research.
- Narrow from "immune axes" (pathways) to a small, interpretable panel during verification; set reproducibility gates (e.g., effect direction consistency, acceptable CVs, %>LOD).
- Preserve platform continuity into validation. If you must switch technologies, predefine cross-platform concordance checks.
Beyond discovery: the translational questions PIs actually face
The hardest part of translational immune profiling isn't generating differential proteins—it's proving those signals survive new batches, new centers, and new timepoints, which is why you must plan bridging, panel selection, and cohort design up front; see How to Choose the Right Olink Panel for Your Biomarker Study and Designing a Large-Scale Proteomics Study with Olink: Cohorts, Power, and QC Strategy for practical guidance.
Immune signatures vs single markers
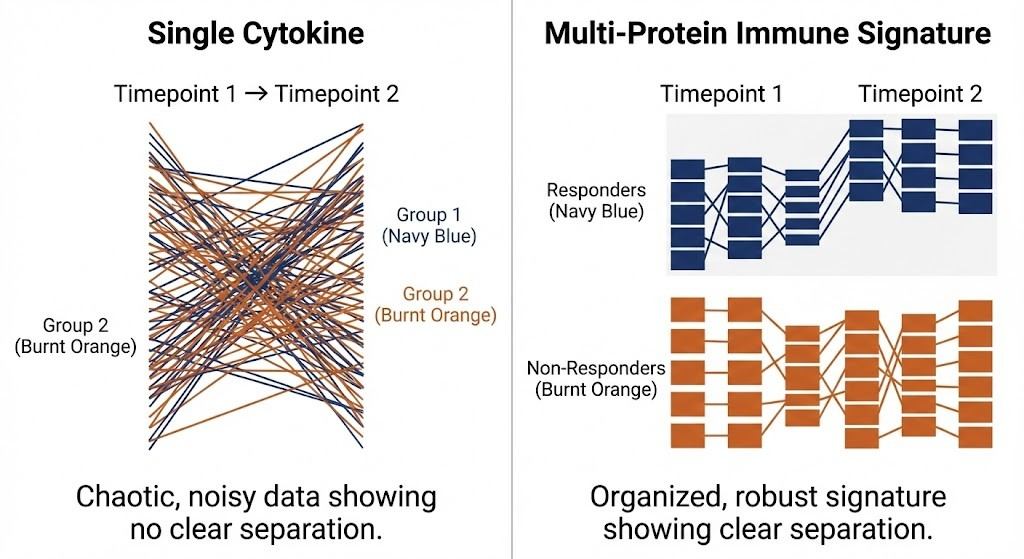
Single cytokines are tempting but brittle. Translational teams increasingly lean on multi-protein immune signatures that reflect an axis (e.g., interferon response, myeloid activation, T-cell exhaustion) rather than a single analyte. Why? Cytokine redundancy and pathway overlap mean multiple proteins co-move; a signature can be more robust against assay-specific noise or missingness. Think of a signature like a braided rope: if one strand frays, the rope still holds.
 Robustness of multi-protein immune signatures versus single analytes.
Longitudinal change vs snapshots
For immunotherapy, time matters. Baseline differences can predict response, but early on-treatment shifts often carry stronger pharmacodynamic information. Longitudinal sampling (e.g., baseline, week 3, first restaging) allows delta-based signatures that cancel person-specific baselines and reduce between-subject variability. That said, longitudinal designs amplify the importance of consistent preanalytics and bridging—because you'll merge data across plates and timepoints.
What often goes wrong in real projects
- Discovery panels look great in a single batch but flatten when merged with a second cohort because batch correction wasn't planned or validated.
- Platforms are mixed midstream (e.g., ELISA or a different multiplex) without a cross-platform agreement plan, making validation results uninterpretable.
- Over-paneling wastes volume and budget in early discovery while under-powering the number of subjects, leading to unstable effect estimates.
- Cytokines with high below-LOD rates drive spurious findings; LOD handling wasn't pre-specified.
According to the OlinkAnalyze vignette and UK Biobank's Olink documentation, NPX is a relative log2 unit and requires careful within-batch normalization and cross-batch bridging before you trust any downstream tests. The plan must be explicit, not retrofitted.
Why the Olink proteomics assay fits translational immune profiling
The Olink proteomics assay employs dual-antibody proximity extension with DNA-tag readout, delivering high multiplexing from minimal volume. Used well, it suits the translational constraints of immune work—small clinical samples, immune proteins at low abundance, and the need to scale from discovery to validation.
Sensitivity and dynamic range for low-abundance immune proteins
Cytokines, chemokines, and immune checkpoints often sit near detection limits. Olink PEA's specificity and amplification underpin reliable detection from microliter inputs, documented across platform materials and validation datasets for Explore HT and related panels; see Olink's platform documentation and validation data for NPX characteristics and internal controls described in the NPX ecosystem and Explore HT materials, including the NPX software and Explore HT validation data.
Matrix choice matters: plasma vs serum can shift detectability for some proteins. Large comparisons show matrix-dependent detectability patterns, reinforcing the need to pick one matrix and stick with it during a project. For background on matrix effects, see a serum–plasma comparison in open-access literature.
If you're new to the underlying mechanics and NPX interpretation, a quick refresher is available in the Olink PEA technology explainer and "Interpreting Olink serum proteomics" resources.
Multiplexing immune pathways without signal compression
PEA's design helps reduce non-specific cross-reactivity compared with some legacy multiplex immunoassays. In practice, that means you can read out coordinated changes across immune pathways with less fear that one extremely abundant analyte will swamp others—a recurring issue with some array formats. Head-to-head studies in disease contexts often show positive but protein-specific agreement patterns across platforms; for one example in inflammatory settings, see a COVID-19 comparison where fold-change patterns were broadly comparable between an Olink panel and another multiplex immunoassay in a 2024 study.
Data consistency enables discovery-to-validation workflows
Discovery and validation should feel like the same study continued—not two different experiments stitched together. The combination of internal controls, defined LOD handling, and bridge-based normalization enables that continuity. UK Biobank's Olink normalization notes outline a two-step approach (intensity normalization, then bridging), with pre/post diagnostics to verify success; see the program's normalization strategy for a concrete reference.
Readers interested in panel composition and immune-pathway coverage can explore How to Choose the Right Olink Panel for Your Biomarker Study.
Designing an Olink-based immune profiling strategy
A good plan saves samples, money, and time. Here's how we structure advanced translational projects.
Designing an Olink-based immune profiling strategy: match panels to objectives—and avoid over-paneling
- Oncology: emphasize tumor immunity axes—interferon signaling, cytotoxic activity, myeloid inflammation, immune exhaustion, and checkpoint biology. Start broad enough to capture axes, then plan to narrow after verification.
- Autoimmune disease: clarify whether systemic (circulating) or tissue-local immune processes drive your question. Circulating panels can miss tissue-restricted signals; design cohorts accordingly.
- Early discovery benefits from breadth, but don't max out every panel at once. It's often better to run more subjects on a focused set than to spread thin over too many proteins.
If you want a concise primer on PEA basics, see the Olink PEA technology explainer. For panel-selection logic, see How to Choose the Right Olink Panel for Your Biomarker Study.
Cohort design: case–control vs longitudinal; sample size; biological over technical replicates
- Case–control designs are efficient for baseline stratification (responder vs non-responder), but longitudinal cohorts unlock delta-based signatures that often stabilize effects.
- Sample size for immune signatures depends on expected effect sizes and variance. Without bespoke formulas, simulation-based planning using pilot NPX variance is the most honest route. The OlinkAnalyze ecosystem facilitates QC and variance estimation; general R packages can run power simulations.
- In practice, biological replicates (more subjects) beat technical replicates. Use technical replicates only to quantify precision and tune QC thresholds.
Readers who want a deeper dive into cohorts, power, and QC can see Designing a Large-Scale Proteomics Study with Olink: Cohorts, Power, and QC Strategy.
Bridging and QC: a reproducible checklist and micro-workflow
What actually works in multi-batch immune studies?
In our experience, stable discovery-to-validation performance correlates with three decisions: 1) sufficient, well-chosen bridge samples; 2) robust, bridge-aware normalization; and 3) explicit diagnostics to prove success.
- Bridge samples: Place 8–12 overlapping biological bridges per plate across batches. Select samples with low missingness and QC-passing internal controls. Distribute across wells. The BAMBOO method research suggests 10–12 bridge controls per plate as a sweet spot for robust adjustment, as shown in the BAMBOO method publication.
- Normalization: Start with within-batch intensity normalization, then apply bridge-based adjustments (MOD or BAMBOO). Avoid applying ComBat blindly in NPX contexts where non-Gaussian noise and outliers are common; BAMBOO/MOD were built for PEA-like data.
- Diagnostics and acceptance checks: Run PCA before/after bridging; batch clusters should collapse post-bridging without erasing biology. Inspect per-assay shifts; confirm %>LOD and missingness patterns are reasonable. Use internal control ranges as sanity checks; large cohorts such as the UK Biobank Olink program provide example thresholds and warning logic.
R pseudo-code (illustrative; adapt to your pipeline):
library(OlinkAnalyze)
# 1) Import + initial QC
npx <- read.csv("npx_input.csv")
qc <- olink_qc_summary(npx)
# 2) Within-batch normalization
npx_norm <- olink_normalization(npx, method = "intensity")
# 3) Define bridge samples across batches
bridges <- read.csv("bridge_map.csv") # sample IDs and plate/batch mapping
# 4) Bridge-based normalization (MOD-like)
npx_bridged <- olink_normalization_bridge(
npx_norm,
bridge_df = bridges,
method = "median_of_differences" # use BAMBOO if available in your environment
)
# 5) Diagnostics
olink_pca_plot(npx_norm, color_by = "batch")
olink_pca_plot(npx_bridged, color_by = "batch")
assay_shift <- olink_assay_shift(npx_norm, npx_bridged)
# 6) LOD and missingness
lod_tbl <- olink_lod(npx_bridged)
For conceptual and function references, see the OlinkAnalyze vignette and the bridging tutorial. For a population-scale example of normalization pathway and diagnostics, consult the UK Biobank Olink normalization documentation.
 Cross-batch bridging strategy for reproducible immune profiling
From discovery to validation: how immune signatures mature
Discovery: map immune axes, not singletons
Start broad and look for coherent axes: interferon-related proteins rising together, or a myeloid activation module linked to non-response. Use dimensionality reduction to visualize patterns, then test multivariate signatures rather than betting on one cytokine.
Verification: narrow to reproducible, interpretable proteins
Cut to a leaner panel with proteins that show consistent directionality across resampling and bridge-normalized subsets. Favor markers with acceptable missingness and biology you can explain. This step is where you eliminate fragile hits.
Validation: demand cross-batch consistency and platform continuity
Your final gate is reproducibility across an independent batch/center/time window. Predefine success: concordant effect directions, acceptable variance after bridging, and stability in sensitivity analyses (e.g., excluding high-hemolysis samples). Ideally, stay on the same platform to avoid cross-technology confounds; if you must switch, pre-register cross-platform checks.
Practical example: tumoral immunotherapy response stratification (disclosure)
Disclosure: Creative Proteomics is our product.
In a multi-center immunotherapy cohort, a discovery batch (n≈120) on an Olink immune-focused panel suggested a responder-associated axis enriched for interferon-inducible proteins. Before moving to verification, we planned bridging and acceptance checks for a second batch (n≈150) from additional sites. We placed 10–12 biological bridge samples per plate, balanced by site and disease stage. After within-batch normalization, we applied a MOD-like bridge adjustment and confirmed success via PCA (batch clusters collapsed, biological separation by response class preserved) and per-assay shift diagnostics. Proteins with >20% below-LOD were flagged and either down-weighted in the signature model or excluded.
During verification, we reduced the signature to a small set of interpretable proteins that retained effect direction and magnitude within predefined tolerance. In validation, we required concordant direction, confidence interval overlap, and stable performance in sensitivity analyses excluding hemolyzed or high-missingness samples. The end result was a compact immune signature that survived cross-batch integration and informed responder-enrichment hypotheses for a subsequent study phase. This is a RUO example; it illustrates workflow logic rather than clinical guidance.
Practical challenges in Olink immune profiling—and how to fix them
Sample-related issues
Hemolysis, freeze–thaw cycles, and matrix effects are the top preanalytical threats. A 2025 study showed hemolysis can perturb a substantial share of PEA probes, while freeze–thaw has a smaller but non-trivial effect; see details in Journal of Proteome Research (2025). Practical guardrails: index hemolysis (visual or spectrophotometric), cap freeze–thaw to ≤2, and predefine exclusion or sensitivity analyses based on hemolysis indices.
Immune-specific interpretation challenges
Many immune proteins are tightly correlated. That's helpful for robust signatures but tricky for single-protein conclusions. Use regularized models and report pathway context. Distinguish biological from technical variability by reviewing %>LOD, replicate CVs, and batch-adjusted residuals.
QC checkpoints that matter most
Instead of a long checklist, prioritize three checkpoints you will actually enforce. First, monitor internal controls (incubation/extension/amplification) and set explicit warning thresholds; large cohorts such as the UK Biobank Olink program use rules on the order of ±0.3 NPX deviations from plate medians. Second, verify replicate precision and document accept/reject gates so reviewers can audit your process. Third, predefine LOD handling and treat proteins with high below-LOD proportions cautiously, as outlined in vendor LOD guidance.
For day-to-day interpretation best practices, see Interpreting Olink serum proteomics.
Integrating immune profiling with multi-omics for translational decisions
Protein-level immune data often re-frames RNA interpretations. Secreted proteins can diverge from transcriptional signals due to post-transcriptional control and compartmentalization. If RNA suggests T-cell activation but circulating checkpoints don't move, the net pharmacodynamic readout may be muted. Conversely, strong protein-level shifts with modest RNA changes can still be actionable if they track response over time. For project teams planning integrated strategies, see Integrating Olink Proteomics with Genomics and Transcriptomics for Better Biomarker Decisions and the Olink + mass spectrometry integration overview.
When to scale to high-throughput immune profiling
Early discovery benefits from targeted panels and careful longitudinal sampling. When you need population-scale stratification or to power subgroup analyses, high-throughput formats become attractive. The tipping points include: stable preliminary signatures, secured budget for scale, and a bridging plan that can be executed across many plates.
Cost/throughput considerations at a glance (order-of-magnitude planning; adjust to vendor and contract specifics):
| Format | Typical use | Subjects per month (illustrative) | Per-sample budget (relative) | Notes |
| Targeted immune panels | Discovery/verification | 100–200 | $$ | Depth on immune pathways; good for longitudinal deltas |
| Expanded multiplex (mixed immune + systemic) | Late discovery/early validation | 200–400 | $$–$$$ | Wider coverage; higher bridging overhead |
| High-throughput (e.g., Explore HT scale) | Large-cohort validation/stratification | 500–1,500 | $$$ | Requires rigorous bridging logistics and automated QC |
Related discussions on large cohort immune profiling are expanded in Systemic Immune Profiling: Optimizing Large Plasma Cohorts for Biomarker Discovery.
FAQ: Olink immune profiling in translational research
How is immune profiling with Olink suited to translational work?
The platform's small volume, high multiplexing, and bridge-aware normalization ecosystem support discovery-to-validation continuity. Vendor vignettes and large-cohort norms outline practical steps, including within-batch normalization and cross-batch bridging.
How many samples are typically needed to detect stable immune signatures?
It depends on effect sizes and variance. Use pilot NPX variance to simulate power for your endpoints. Prioritize more subjects over technical replicates; longitudinal deltas can reduce required N by stabilizing within-person effects.
Can Olink immune panels support longitudinal studies?
Yes. Longitudinal sampling is often preferable in immunotherapy because early on-treatment shifts carry pharmacodynamic insight. Just ensure consistent preanalytics and explicit bridging across timepoints.
How does immune profiling differ between oncology and autoimmune research?
Oncology often targets tumor–immune interplay and exhaustion pathways; autoimmune research may emphasize systemic inflammatory tone vs tissue-local signals. Matrix and timepoint strategy can differ accordingly.
What are common reasons immune biomarkers fail validation?
Missing or inadequate bridging, matrix inconsistency, high below-LOD rates for key proteins, and unplanned cross-platform switches. Predefining acceptance checks mitigates these failure modes.
Conclusion: turn immune data into translational decisions
Immune profiling isn't an endpoint—it's a decision-support tool. If you plan bridging, normalize with bridge-aware methods, and predefine acceptance checks, the probability that discovery survives validation rises sharply. Keep platform continuity where possible, design cohorts for the biology you expect to see, and interpret proteins as pathways, not isolated peaks. If you're aligning an immune profiling plan with upcoming translational milestones, an early consult can save cycles and samples.
For newcomers to PEA mechanics, see the Olink PEA technology explainer. For design details on cohorts, power, and QC, see Designing a Large-Scale Proteomics Study with Olink: Cohorts, Power, and QC Strategy. For integrated strategies, see Integrating Olink Proteomics with Genomics and Transcriptomics for Better Biomarker Decisions.
RUO: All content here is for research use only and not for diagnostic purposes.
FAQ: Olink immune profiling in translational research
Q1 — What makes Olink immune panels suitable for translational studies?
A1 — Small-volume input, dual-antibody PEA specificity, and an established NPX/bridge-normalization workflow make Olink panels practical for discovery→validation pipelines where cross-batch continuity matters.
Q2 — How many samples do I need to detect a stable immune signature?
A2 — There is no universal N. Use pilot NPX variance to run simulation-based power calculations; as a practical rule, prioritize more biological replicates over technical repeats and consider longitudinal sampling to reduce required N.
Q3 — Can Olink panels support longitudinal (on-treatment) profiling?
A3 — Yes. Longitudinal designs are often preferable in immunotherapy for delta-based signatures, but they increase bridging and preanalytic consistency requirements across timepoints.
Q4 — Plasma or serum — which should I choose?
A4 — Pick one matrix and keep it consistent across the study. Matrix choice can change detectability for some proteins; if mixed matrices are unavoidable, treat matrix as a covariate and predefine sensitivity analyses.
Q5 — Why do immune biomarkers fail validation, and how do I reduce that risk?
A5 — Common failure modes include inadequate bridging, matrix inconsistency, high below-LOD rates for key proteins, and unplanned cross-platform switches. Reduce risk by predefining bridge design, QC gates, LOD handling, and cross-platform concordance checks.
Next steps
If you're planning a multi-batch translational cohort, contact our team to review bridging, QC, and panel strategy or visit the Creative Proteomics Olink services page to explore options and timelines.


