
The Growing Need for Better Cancer Biomarkers
Cancer remains a major challenge for research organisations and pharma R&D groups. Genomic tools provide strong insight into risk and mutation, but proteins measured in blood offer a complementary, dynamic snapshot of biological processes. Reliable, non-invasive biomarkers are essential for early detection, cohort stratification, or monitoring in oncology research.
Traditional proteomic methods often struggle in key areas: detecting low-abundance proteins, handling small sample volumes, and keeping assay variability low. These limitations slow biomarker discovery or make findings hard to reproduce across labs.
A recent landmark study using the UK Biobank and Olink Explore platform showed what's possible when you combine scale, long follow-up, and multiplex proteomic measurements (Papier et al., 2024; DOI: 10.1038/s41467-024-48017-6). Researchers measured 1,463 plasma proteins in over 44,000 participants and followed up for a median of ~12 years. They found 618 protein-cancer associations, of which 107 remained significant for cancers diagnosed more than seven years after blood was drawn.
Some proteins illustrated especially strong evidence. For example:
- CD74 and TNFRSF1B were associated with risk of non-Hodgkin lymphoma.
- ADAM8 linked to leukemia risk.
- SFTPA2 associated with lung cancer risk.
These findings show Olink proteomics (particularly large-scale panels like Explore) can detect signals years before diagnosis, offering a powerful tool for cancer research. This helps set the stage for the rest of this article: showing how Olink proteomics analysis can be used in practice, what kinds of biomarker signals emerge, and how research groups can apply these insights in their own projects.
For readers new to Olink: Introduction to Olink Proteomics: What You Need to Know
What Makes Olink's Approach Stand Out in Proteomic Research
To understand how Olink proteomics can transform biomarker discovery, it helps to see its technical strengths and how these solve common bottlenecks in protein-based studies.
Dual-Antibody + DNA Barcoding for High Specificity
Olink's Proximity Extension Assay (PEA) uses two antibodies per target. Each is tagged with a unique DNA oligonucleotide. Only when both antibodies bind the same protein do the DNA tags come together, hybridise, extend, and produce a barcode.
This dual-binding requirement greatly reduces background noise from non-specific antibody binding. The matched oligo system ensures only correct pairs contribute to signal.
Exceptional Sensitivity, Even with Small Sample Volumes
- Olink's PEA technology can detect proteins present at very low concentrations (low picogram-to femtogram per mL range), useful when dealing with rare proteins or limited sample availability.
- Panels such as Olink Explore 3072 allow measurement of nearly 3,000 proteins using just ~6 µL of plasma or serum per sample.
Wide Dynamic Range & Multiplexed Throughput
- In biological fluids (e.g. plasma), protein concentrations span over 10 orders of magnitude. Detecting both abundant and rare proteins is non-trivial. Olink PEA achieves this range without sacrificing sensitivity.
- Depending on the panel/readout, you can profile from a few dozen to thousands of proteins in parallel. This multiplexing speeds discovery, reduces cost per protein, and allows researchers to test wider hypothesis sets.
Compatibility & Robustness Across Sample Types
- Though serum and plasma are the most common sources, PEA has been validated for many sample types. It is robust to matrix effects because of its dual-antibody specificity and DNA barcoding.
- Assay reproducibility is high. Internal controls, standardized workflows, and quality control measures help ensure consistency across batches and panels.
Comparison with Other Proteomic Methods
| Feature | Olink PEA | Mass Spectrometry / MS-based Assays | Traditional Antibody Methods (e.g. ELISA, Luminex) |
| Sensitivity for low-abundance proteins | Very high | Good, often after depletion/fractionation | Variable; often lower for rare proteins |
| Sample volume required | Very low (µL scale) | Moderate to high | Moderate to high |
| Multiplexing | From small panels up to thousands of proteins | Increasingly high, but often more complex sample prep | Moderate number of targets; cross-reactivity issues scale up badly |
| Throughput & Cost per Protein | Efficient especially at scale | Can be cost-effective for discovery, but complex workflows | Lower cost per assay but less scalable and more hands-on per target |
How These Advantages Address Key Pain Points for Research Teams
- Limited sample volume: Small animal models, rare patient cohorts, or precious archival samples often limit how much material is available. Olink PEA works well with low input.
- Detecting early or subtle changes: Biomarkers for early risk or pre-diagnosis often exist at very low plasma concentrations. High sensitivity and low noise help detect those.
- Scaling up discovery: With large multiplex panels and robust QC, one lab or CRO can process many samples and many proteins without losing reliability.
- Cross-lab reproducibility & validation: Standardized protocols, internal controls, and panel-based designs help ensure findings replicate across studies.
Case Study Overview – Blood Proteins as Early Cancer Risk Signals
The study "Identifying proteomic risk factors for cancer using prospective and exome analyses of 1,463 circulating proteins and risk of 19 cancers in the UK Biobank" (Papier et al., 2024. DOI: 10.1038/s41467-024-48017-6) provides a compelling example of how Olink proteomics enables discovery of early biomarkers across multiple cancer types.
Study Design & Cohort
- The research examined 44,645 UK Biobank participants, aged approximately 39-73 years at baseline.
- Blood samples were collected between 2006-2010, and participants were followed for a mean of ~12 years.
- During follow-up, about 4,921 individuals developed malignant cancer. The study considered 19 cancer types and 9 cancer subsites.
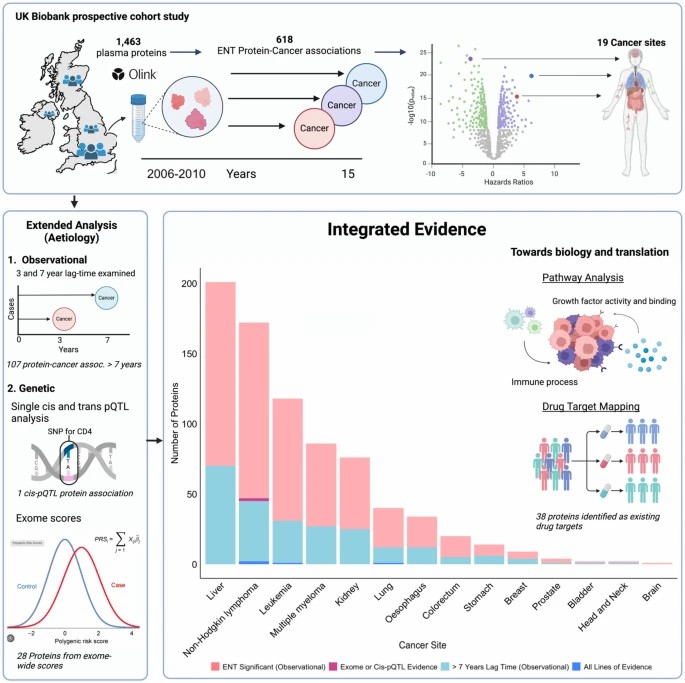 Fig. 1: Summary of study design, observational and genetic protein-cancer associations, and pathway analyses and drug target mapping.
Proteomic Measurements & Statistical Methods
- The study used the Olink Explore platform to measure 1,463 plasma proteins via proximity extension assay (PEA).
- Primary analyses were observational: multivariable Cox proportional hazards models tested association between each protein and cancer incidence, adjusting for age, sex, lifestyle, and other covariates.
- To reduce risk of reverse causation, the study assessed whether protein-cancer associations held for cancers diagnosed more than seven years after baseline sampling.
Genetic Triangulation
- Genetic analyses complemented observational results via cis-pQTL (protein quantitative trait loci located near the gene encoding the protein) to establish genetic control over protein levels.
- An exome-wide protein genetic score (exGS) was also constructed, integrating cis and trans pQTLs, to test whether genetically predicted variation in protein levels associated with cancer risk.
Key Findings
- The study identified 618 protein-cancer associations in total. Among these, 107 remained significant for cancers diagnosed more than seven years after baseline.
- Of the 618, 29 associations were supported by genetic analyses (cis-pQTL or exGS).
- Four proteins had strong, multi-axis support:
- CD74 and TNFRSF1B for non-Hodgkin lymphoma risk
- ADAM8 for leukemia risk
- SFTPA2 for lung cancer risk
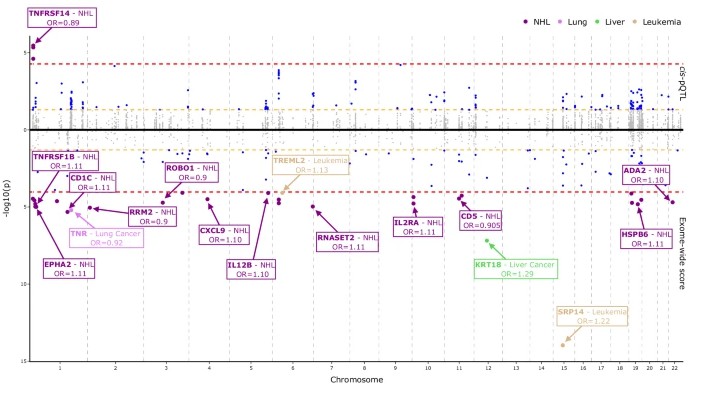 Fig. 2: Mirror Manhattan plot for the association of genetically predicted protein concentrations and cancer risk using cis-pQTL and exome scores.
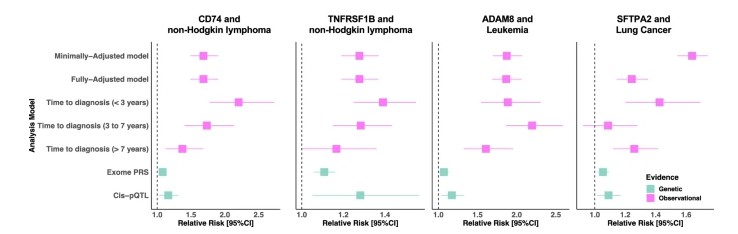 Fig. 3: The prospective and genetic associations of SFPTA2 with lung cancer risk, CD74 and TNFRSF1B with risk of non-Hodgkin lymphoma, and ADAM8 with risk of leukaemia.
Relevance for Proteomic Biomarker Discovery
- This investigation demonstrates that Olink serum/plasma proteomics with large, well-characterised cohort data can identify early biomarker candidates long before clinical diagnosis.
- The combination of observational, time-lagged (7+ years), and genetic validation increases confidence that some proteins are more likely to represent etiological risk markers rather than secondary effects.
- The method shows how high-plex protein panels like Olink Explore can scale across many cancer types, offering broad opportunity for discovery across oncology research.
For comparisons to conventional tools: The Benefits and Innovation of Olink Proteomics Compared to Traditional Methods (No. 2)
Methodology – How Olink Was Applied
This section breaks down how UK Biobank and the UKB-PPP consortium used Olink's proteomic technology (especially Olink Explore PEA) for large-scale biomarker discovery. It covers sample preparation, assay design, quality control, and data normalization.
Sample Collection & Panel Selection
- Blood plasma samples from ~54,219 individuals were profiled using the Olink Explore 3072 PEA platform. The assay includes panels for Cardiometabolic, Inflammation, Neurology, and Oncology, among others.
- The cohort was composed largely of samples taken at baseline during UKB visits, plus a subset (≈6,300) pre-selected by member companies for traits of interest (e.g. cases or by genetic ancestry).
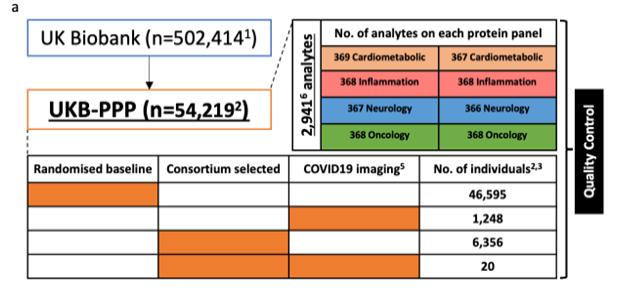 Figure 4. UKB-PPP sub-cohort composition, adapted from Sun et al., 2022
Assay Workflow & Controls
- The PEA workflow involves binding of dual-antibody pairs to each target protein in plasma, followed by DNA barcode extension, amplification, and readout of Normalized Protein Expression (NPX), in log2 scale.
- In each 96-well plate: up to 88 UKB samples, plus external controls (e.g. pooled plasma), negative controls (in triplicate), and overlapping samples for monitoring batch effects.
- Limit of detection (LOD) is estimated per assay per plate using negative controls. Assays below LOD or with missing NPX values are flagged in downstream QC.
Quality Control & Data Filtering
After raw data generation, several QC steps are performed:
- Removal of control samples – eliminate Olink-supplied control wells or samples from analysis of real participants.
- Exclude participants who withdrew consent or whose samples weren't processed.
- Outlier detection via principal component analysis (PCA) and median/IQR distributions of NPX values. Samples with principal component 1 or 2 > 5 standard deviations from the mean, or whose NPX median or IQR across proteins are extreme, are removed (panel-by-panel).
- Remove QC/assay warnings flagged by Olink (automatic or manual).
- Identify and remove likely sample swaps or mislabelled samples, including sex mismatches, problematic plates, etc.
- After QC, dataset contained ~58,227 to 58,353 samples from ~54,150-54,220 individuals (depending on exact filtering) measuring ≈ 2,923 distinct proteins.
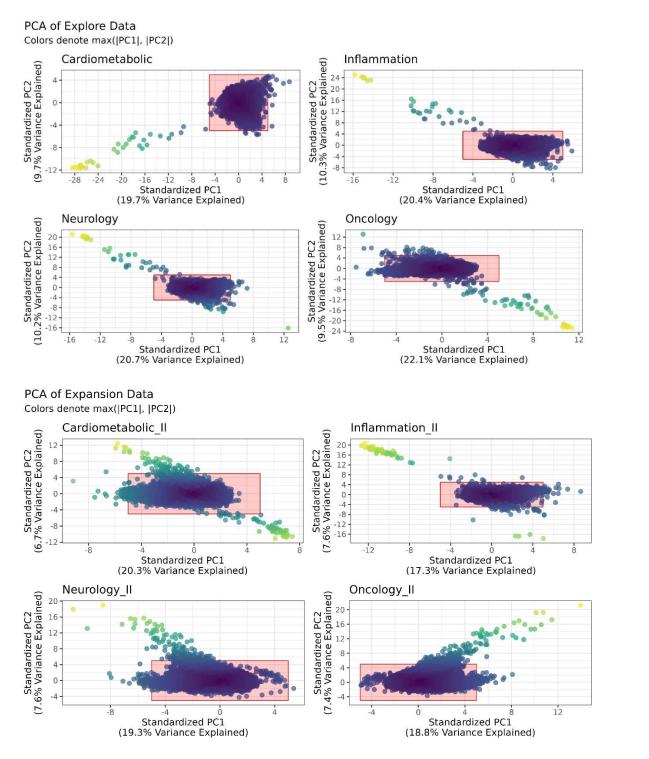 Figure 5. PCA of Olink proteins in UK Biobank.
Batch Effects, Normalization, & NPX Data Handling
- Samples were processed in batches and plates. There are 7 batches (BatchIDs B1–B6 + Pilot), each comprising many 96-well plates. UK Biobank randomised sample allocation across plates to reduce confounding.
- Overlapping samples between batches (UKB samples carried over) were used to monitor batch-to-batch variation. External pooled plasma controls also used across plates to adjust inter-plate and inter-batch variation.
- NPX (Normalized Protein Expression) values represent relative protein abundance in log2 scale; raw readouts are transformed and normalized according to the internal controls and plate/assay calibration. Missing values (NPX = NA), values below LOD, or flagged assays are treated conservatively (filtered or excluded).
Statistical Analysis Strategies
- Associations were tested with time-to-event models (e.g., Cox proportional hazards), adjusting for age, sex, lifestyle covariates (smoking, BMI, socioeconomic status), and other relevant confounders. (Seen in the UKB-PPP studies using Olink data)
- Stratification by time to diagnosis (for example >7 years after blood draw) was applied to reduce reverse causation — ensuring that protein levels are truly preceding disease onset rather than reflecting subclinical disease activity. (From Sun et al., Papier et al.)
- Genetic approaches: cis-pQTL mapping and exome-wide variant analysis were used to validate that variations in protein levels are under genetic control, increasing confidence in specificity and potential causal relevance.
Data Access & Reproducibility
- UK Biobank provides these proteomics datasets via the Research Analysis Platform (RAP) and Showcase. Metadata includes plate, batch, assay IDs, lot numbers, limits of detection, QC flags.
- QC pipelines, versioning, and code are often made available (e.g. R scripts in UKB-PPP Quality Control companion documents). This supports reproducibility of results in downstream biomarker discovery.
For full details on Olink NPX data interpretation: How to Interpret Results from Olink's Serum Proteomics Panels
For selecting correct Olink panel and throughput: Exploring the Olink 96 and 48-Plex Panels: Key Differences
Key Findings – Protein Biomarker Signals for Cancer Risk
The UK Biobank Pharma Proteomics Project (UKB-PPP) pilot data revealed many promising associations between blood protein levels and future cancer risk. Below are some of the most valuable signals, especially cytokines and immune mediators, including effect sizes, significance, and how they might guide future biomarker work.
Notable Protein-Cancer Associations
From UKB-PPP proteomics data (over 50,000 samples measured, ~3,000 proteins per participant) several specific proteins stood out with statistically strong links to later cancer incidence.
Some examples:
| Protein / Molecule | Cancer Type(s) Associated | Hazard Ratio (HR) & Significance* | Notes on Novelty or Strength of Signal |
| IL-6 | Lung/bronchus cancer | HR ~1.2; p ~1.6×10⁻⁵ | Known inflammatory marker; confirms prior work but with stronger population evidence. |
| IL-1β | Lung cancer | HR ~1.2; p ~0.019 | Supports role of IL-1 pathway in lung cancer risk. |
| IFN-γ | Prostate cancer | HR ~0.92 (suggests slightly protective / inverse association); p ~0.036 | Interesting because IFN-γ is often considered pro-immune; inverse association may reflect complex immune balance. |
| M-CSF | Kidney / bronchus lung cancers | HR ~1.9 (kidney), ~2.9 (kidney/renal pelvis); significant p-values | Growth factor / immune cell regulator; a strong effect size makes it a possible target for further validation. |
| PD-L1 | Lung (bronchus) cancer | HR ~1.6; p ~0.00011 | Immune checkpoint protein; expected to be relevant, but this quantifies prospective risk in non-clinical samples. |
*Significance reported after adjustment for multiple comparisons; hazard model adjusted for demographic, lifestyle covariates.
Emerging or Less-Studied Signals
In addition to well-known players, some proteins that are less common in conventional panels showed up as significantly associated in UKB-PPP data:
CCL22, CCL17, CCL11 (chemokines linked to immune regulation and tumour microenvironment) showed associations with lung cancer (bronchus) with HRs between ~1.2 to ~1.4, p-values ranging from ~10⁻⁶ to ~10⁻².
CXCL9 and CX3CL1 (chemokine family) also associated with lung cancer risk.
FGF-21 (Fibroblast Growth Factor 21) had a strong association with lung cancer risk (bronchus). HR ~2.0; p ~5.6×10⁻⁸.
These emerging markers may offer novel leads for biomarker panels, especially for lung cancer risk stratification.
Immune / Inflammation Pathways
Analysis of UKB-PPP data emphasizes that many of these associations converge around immune modulation and inflammation:
Elevated cytokines (IL-6, IL-1β) and chemokines correspond with higher cancer risk, suggesting systemic inflammation may precede tumour development by years.
Immune checkpoint proteins (e.g., PD-L1) show association even in pre-diagnostic samples, implying immune suppression or immune evasion processes may begin well before clinical detection.
Effect Sizes, Lead Time & Robustness
Lead times: Many associations remain significant even when cancer is diagnosed more than ten years after sample collection, supporting their potential as early risk biomarkers. UKB-PPP analyses allow stratification by lead time to assess how early in disease trajectory these signals emerge.
Effect sizes are modest (HRs ~1.2-2.0) for most proteins, which is expected for risk biomarkers in large, diverse cohorts. Exceptions with higher HRs, like for M-CSF, indicate stronger signals worth further validation.
Multiple comparison correction and inclusion of many covariates strengthen confidence in these findings. Nevertheless, replication in independent cohorts (or validation panels) remains essential.
Implications for Biomarker Discovery
These findings suggest that Olink proteomics, especially via cytokine panels and high-plex Explore data, can reveal preclinical risk markers, not just markers of existing disease.
Panels integrating both canonical inflammatory markers (IL-6, IL-1β) and newer chemokines or growth factors (FGF-21, CCL22 etc.) may provide better risk stratification for certain cancer types (especially lung).
Researchers focusing on lung cancer or immune-modulated cancers may prioritize certain proteins for follow-up studies or inclusion in assay panels.
From Discovery to Translation — Turning Signals Into Research Impact
Olink proteomics analysis, Olink Cytokine panels, and Olink serum proteomics enable a practical path from discovery to translational research outcomes. Large, prospective cohorts show that blood proteins can flag cancer risk years in advance. These signals help researchers design smarter studies, enrich cohorts, and prioritise targets—without making clinical claims.
1) Cohort enrichment for hypothesis-driven studies
- Proteomic risk markers can pre-select subgroups with stronger biology.
- Enriched cohorts improve power and reduce sample size in exploratory trials.
- Regulatory guidance recognises enrichment designs for demonstrating effects. Use this to shape preclinical-to-clinical translational plans, not clinical care.
How it translates here:
The UK Biobank Olink study linked 1,463 proteins with risk across 19 cancers, with 107 associations persisting beyond seven years. Such durable signals are suited for non-clinical stratification, longitudinal registries, and pre-screening frameworks.
2) Target triage and mechanism hypotheses
- Proteins supported by observational and genetic evidence rise in priority.
- The UK Biobank work combined time-to-diagnosis and pQTL/exome scores to strengthen causal inference.
- Examples include CD74, TNFRSF1B, ADAM8, and SFTPA2 as risk-linked proteins. These inform pathway hypotheses and preclinical models.
3) Multi-marker panels for risk modelling and monitoring studies
- Sparse proteomic signatures can enhance risk prediction when combined with clinical data.
- UKB-PPP analyses show proteomic models improving prediction for common and rare diseases, supporting research on panel design and validation.
Cytokine-centric angles:
Cytokine and chemokine signals (for example IL-6, PD-L1, CX3CL1) appear in prediagnostic blood. These insights motivate panel compositions and sampling schedules for immune-oncology research projects.
4) Bridging discovery with early translational endpoints
- Independent studies are leveraging liquid-biopsy proteomics to understand response biology.
- In head and neck cancer, a 2025 study integrated peripheral blood immune profiling with an Olink cytokine panel to predict neoadjuvant PD-1 response, illustrating feasible translational endpoints for research-use programs.
5) Cross-cohort generalisation and scale
Population-scale proteogenomics shows how discovery can scale to validation.
The UKB-PPP processed >50,000 samples on Olink Explore, demonstrating robust QC, batch design, and reproducibility standards that research teams can emulate.
Practical next steps for research teams (non-clinical use only)
- Define the question first: risk stratification, target triage, or exploratory endpoints.
- Select an appropriate panel: start with Explore for discovery, then refine to cytokine or focused panels for follow-up.
- Plan enrichment and power: align inclusion criteria with biomarker signals; review enrichment design principles early.
- Pre-register analysis plans: specify lead-time strata and covariates to reduce bias, following the UKB-PPP examples.
- Prioritise replication: test top proteins across independent cohorts or biobanks where feasible.
Beyond Cancer — Scaling Olink for Broader Studies
Olink proteomics analysis scales well beyond oncology. Population-level projects now pair Olink serum proteomics with genetics and clinical registries to study cardiovascular, metabolic, infectious, and ageing-related conditions at unprecedented resolution—often across tens of thousands of participants. These designs demonstrate how Olink Cytokine and high-plex Explore panels generalise to multi-disease discovery, risk modelling, and target triage in research-use-only settings.
Population cohorts enable multi-disease risk models
- In UK Biobank, protein-based scores trained on ~1,461–1,468 Olink proteins predicted the incidence of 23 age-related diseases and mortality across ~47–52k participants, supporting broad utility outside cancer.
- A cardiovascular consortia analysis spanning UK Biobank and China Kadoorie Biobank linked measured and genetically predicted Olink proteins to major cardiovascular outcomes, illustrating cross-population replication and causal inference strategies.
Scale is accelerating: from tens of thousands to hundreds of thousands
- The UK Biobank Pharma Proteomics Project (UKB-PPP) is expanding to ~600,000 samples and >5,400 proteins on Olink Explore HT—designed specifically to power pan-disease discovery and validation at population scale.
Generalising immune insights beyond oncology
- Immune and cytokine signals captured on Olink panels (e.g., IL-6, chemokines, checkpoint-related proteins) also stratify risk for respiratory and cardiometabolic endpoints in pre-diagnostic blood, underscoring the translational value of immune profiling outside cancer.
Cross-platform and cross-cohort triangulation
- Population-scale proteogenomics resources use Olink data alongside genetics (pQTLs, exome-based scores) to prioritise causal pathways and refine drug target hypotheses, with emerging comparisons to other large cohorts and technologies to assess robustness.
Practical guidance for scaling studies (research-use only)
- Choose scope intentionally: Use high-plex Olink Explore for discovery; refine to focused or Olink Cytokine panels for targeted follow-ups and longitudinal sampling.
- Design for heterogeneity: Combine proteomics with genomics and detailed phenotypes; plan for site/batch effects with standardised QC and overlapping controls, as demonstrated in UKB-PPP.
- Prioritise portability: Favour signals replicated across cohorts and supported by genetics; elevate those with consistent effects in different ancestries or environments.
- Integrate multi-omics: Recent UKB work shows that combining metabolomics with Olink proteomics improves prediction for diverse incident diseases—useful when building multi-endpoint research models.
Why this matters for an enterprise content hub
- Articles that cover large-scale, non-oncology use cases help readers see Olink's platform relevance across disease areas and study designs.
- Link from this section to resources that discuss scale, population design, and translational strategy.
Key Takeaways
Olink proteomics, especially using high-plex platforms and cytokine panels, can identify protein signals in blood many years before cancer diagnoses. This provides strong lead time for research-use biomarker discovery.
Integrating observational associations, long lead time stratification (e.g. >7 years before diagnosis), and genetic validation (cis-pQTL or exome scores) enhances confidence in which proteins are likely risk indicators rather than secondary effects.
Immune mediators (cytokines, chemokines, checkpoint-related proteins) emerge repeatedly as early markers. These are useful in designing research panels and in understanding mechanistic pathways.
Study designs with large cohorts (tens of thousands), rigorous QC, thoughtful statistical modeling, and replication across cohorts or populations are essential for robustness.
Applications beyond oncology—from ageing studies to cardiovascular disease—show Olink's broader relevance. Scaling up to large sample numbers increases discovery power and generalisability.
For research teams, discovery → follow-up pipelines work best when early discovery is paired with focused follow-ups, proper panel choice, and replication or validation work.
Conclusion
The recent large-scale studies make it clear: Olink proteomics is not just a promising tool—it already delivers real, reproducible biomarker signals with long lead times. For non-clinical research groups, this means earlier hypothesis generation, smarter cohort design, and better resource allocation.
If your lab, CRO, or research institute wants to explore how Olink proteomics (Olink proteomics analysis, Olink Cytokine Panel, serum proteomics) can help accelerate your biomarker discovery efforts:
- Review your research goals: risk prediction, immune profiling, translational biology.
- Talk with technical experts to select the right Olink panel for your needs.
- Plan your study with adequate sample size, long follow-up if possible, and rigorous QC standards.
- Consider using our service for sample processing, Olink panel selection, and data interpretation.
Let's collaborate. Reach out today to schedule a free consultation. We can assess your project, recommend optimal panel design, and discuss how our Olink proteomics services can help you unlock early biomarker signals.
References
- Magis, A.T., Rappaport, N., Conomos, M.P. et al. Untargeted longitudinal analysis of a wellness cohort identifies markers of metastatic cancer years prior to diagnosis. Sci Rep 10, 16275 (2020). https://doi.org/10.1038/s41598-020-73451-z
- Papier, K., Atkins, J.R., Tong, T.Y.N. et al. Identifying proteomic risk factors for cancer using prospective and exome analyses of 1463 circulating proteins and risk of 19 cancers in the UK Biobank. Nat Commun 15, 4010 (2024). https://doi.org/10.1038/s41467-024-48017-6
- Athanasiou A, Kureshi N, Wittig A, Sterner M, Huber R, Palma NA, King T, Schiess R. Biomarker Discovery for Early Detection of Pancreatic Ductal Adenocarcinoma (PDAC) Using Multiplex Proteomics Technology. J Proteome Res. 2025 Jan 3;24(1):315-322. doi: 10.1021/acs.jproteome.4c00752. Epub 2024 Dec 19. PMID: 39699878; PMCID: PMC11705213.
- UK Biobank Pharma Proteomics Project Quality control of Olink NPX dataset • November Data Release Benjamin B. Sun, Kyle Ferber and Tinchi Lin (Biogen); Christopher D. Whelan (Janssen)
- Papaccio F, Della Corte CM, Viscardi G, Di Liello R, Esposito G, Sparano F, Ciardiello F, Morgillo F. HGF/MET and the Immune System: Relevance for Cancer Immunotherapy. Int J Mol Sci. 2018 Nov 14;19(11):3595. doi: 10.3390/ijms19113595. PMID: 30441809; PMCID: PMC6274701.
- Korbecki, J.; Kojder, K.; Simińska, D.; Bohatyrewicz, R.; Gutowska, I.; Chlubek, D.; Baranowska-Bosiacka, I. CC Chemokines in a Tumor: A Review of Pro-Cancer and Anti-Cancer Properties of the Ligands of Receptors CCR1, CCR2, CCR3, and CCR4. Int. J. Mol. Sci. 2020;21(21):8412. doi: 10.3390/ijms21218412.
- Wu T, Yang W, Sun A, Wei Z, Lin Q. The Role of CXC Chemokines in Cancer Progression. Cancers (Basel) 2022 Dec 28;15(1):167. doi: 10.3390/cancers15010167. PMID: 36612163; PMCID: PMC9818145.
- Lu W, Li X, Luo Y. FGF21 in obesity and cancer: New insights. Cancer Lett 2021 Feb 28;499:5-13. doi: 10.1016/j.canlet.2020.11.026. PMID: 33264641; PMCID: PMC7779663.
- Jagodzińska A, Chudecka-Głaz A, Michalczyk K, Pius-Sadowska E, Wieder-Huszla S, Jurczak A, Machaliński B. The Diagnostic Role of FGF 21 in Endometrial Cancer and Other Pathologies of the Uterine Corpus. Diagnostics (Basel) 2023 Jan 22;13(3):399. doi: 10.3390/diagnostics13030399. PMID: 36766504; PMCID: PMC9914808.
- Papaccio F, Della Corte CM, Viscardi G, Di Liello R, Esposito G, Sparano F, Ciardiello F, Morgillo F. HGF/MET and the Immune System: Relevance for Cancer Immunotherapy. Int J Mol Sci. 2018 Nov 14;19(11):3595. doi: 10.3390/ijms19113595. PMID: 30441809; PMCID: PMC6274701.
- Vinokurova, D.; Apetoh, L. The Emerging Role of IL-9 in the Anticancer Effects of Anti-PD-1 Therapy. Biomolecules. 2023;13:670. doi: 10.3390/biom13040670.


