
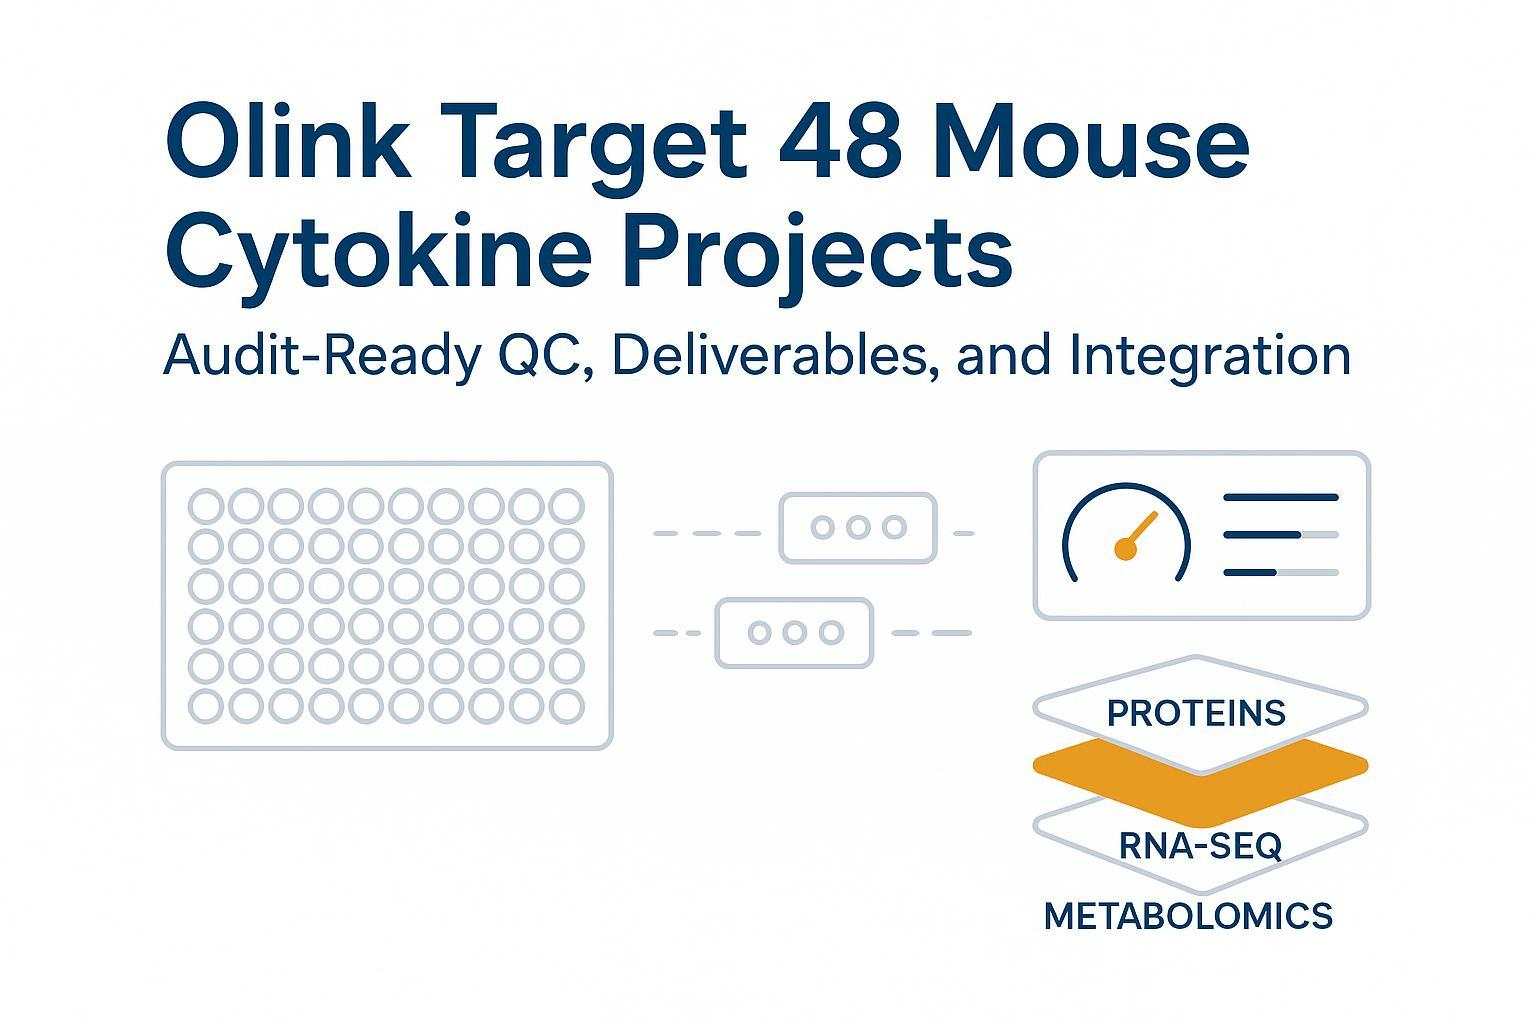
Choose a partner for your Olink Target 48 mouse cytokine work by verifying what really matters upfront: an Olink PEA QC workflow designed to reduce batch effects, a documented NPX deliverables and QC report package, and clear options for multi-omics integration—supported by audit‑ready documentation. For research use only (RUO). Not for diagnostic or clinical use. Performance depends on sample matrix, signal levels, and study design. Project scope and delivery milestones are defined after sample readiness and QC requirements are confirmed. Client data remain confidential. Data ownership and access are defined in the SOW.
If you're evaluating providers, here's the deal: insist on evidence you can audit before you commit—bridge‑first plate discipline, defined QC gates with sign‑off, and a deliverables checklist that publishing teams and modelers can use without back‑and‑forth.
Key takeaways
- What to verify upfront: bridge sample strategy, plate randomization discipline, QC gates and sign‑off, and a concrete NPX data + QC report bundle you can review.
- Audit‑ready SOP nodes you should see named explicitly: SOP‑01 to SOP‑08 covering acceptance, plate planning, bridging, run controls, QC gates, reruns/deviations, data packaging, and data security.
- Deliverables that reduce rework: NPX matrix, QC summary pack, plate maps, detection rates, flagged samples/deviations log, and analysis‑ready files; optional integration modules on request.
- Responsible reporting: NPX supports relative comparisons; absolute pg/mL may be feasible in targeted contexts with proper calibration (RUO, study‑design dependent).
- Integration that actually ships: model‑ready feature tables, correlation modules, pathway overlays, and responder stratification—if you provide aligned RNA‑seq/metabolomics inputs.
Quick decision snapshot for Olink Target 48 mouse cytokine studies
A two‑minute checklist of what you can validate before you commit: batch‑effect controls, QC gates and sign‑off, deliverables content, and integration outputs. Scope and timelines are project‑dependent (RUO).
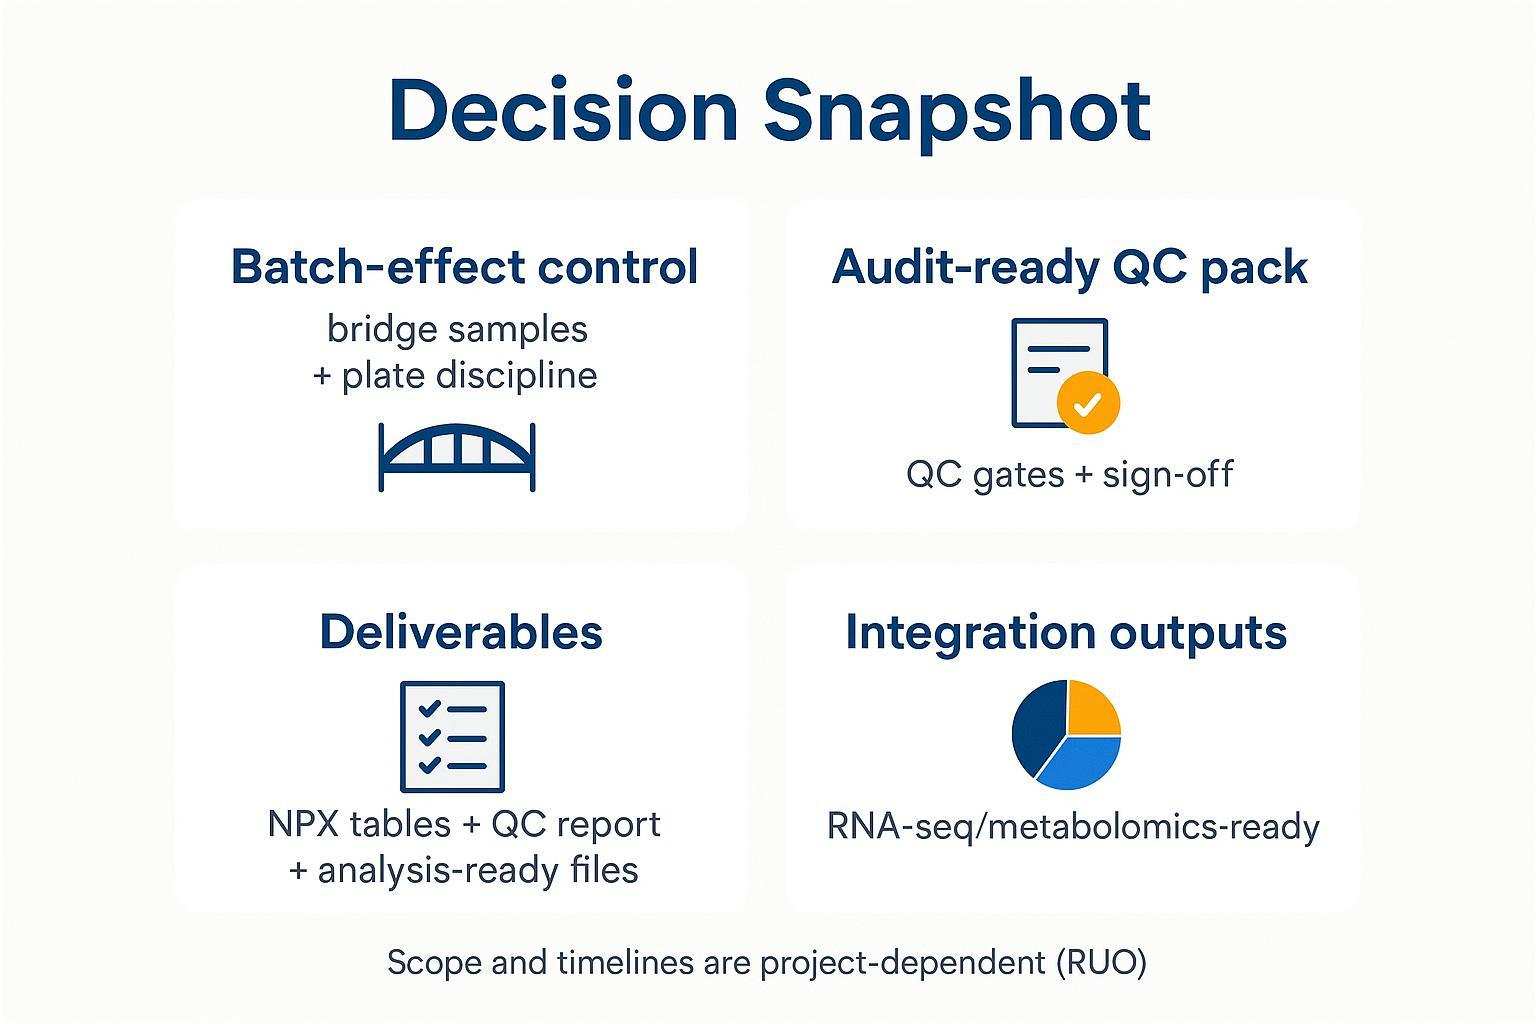 A decision snapshot of what you can verify upfront—QC discipline, deliverables, and integration outputs for mouse Target 48 studies.
Batch‑effect control you can check includes the use of bridge samples across plates and documented plate discipline. An audit‑ready QC pack should list named QC gates with Pass/Review/Rerun outcomes and sign‑off. Deliverables typically include NPX tables, a QC summary/report, and analysis‑ready files (CSV/Excel) with a field dictionary. Integration outputs should be RNA‑seq/metabolomics‑ready handoffs and model‑ready feature tables.
For panel context, see the Mouse panel overview on our site: Olink Target 48 Mouse Panel overview .
Why mouse cytokine projects derail—and how audit‑ready QC prevents it
Most failures are preventable. Drift across plates and batches blurs biological signals; low‑volume constraints in murine matrices push sensitivity; a subset of proteins sits near LOD/LLOQ; and undocumented rerun decisions create long‑tail interpretation disputes.
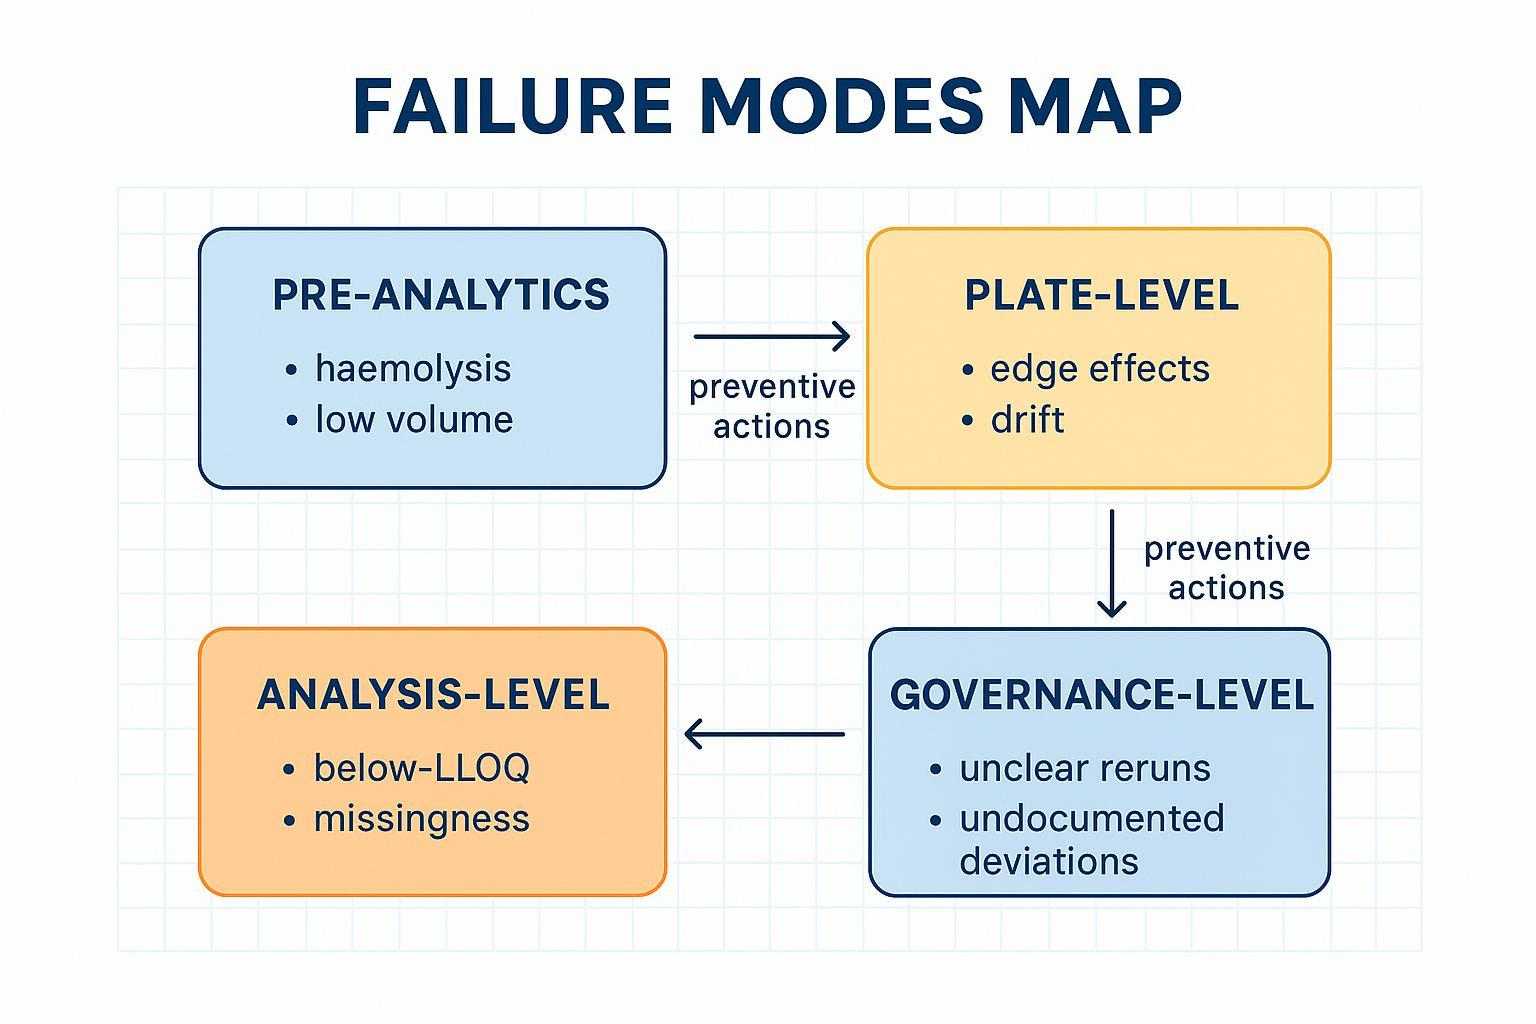 Most project risk comes from preventable failure modes—especially drift, low signal, and undocumented rerun decisions.
Audit‑ready quality governance mitigates these risks. A bridge‑first design normalizes multi‑plate runs and helps reduce batch effects; plate randomization prevents confounding group effects; and predefined QC gates with sign‑off constrain rerun decisions to documented criteria. Olink's own guidance emphasizes bridging and randomization, and tools like the Olink Analyze R package provide pre/post‑normalization QC plots and outlier identification. Peer‑reviewed approaches such as the BAMBOO method for PEA batch correction (Olink, 2023) show how multiple bridges per plate can stabilize inference.
How PEA SOPs reduce batch effects: bridge samples, plate discipline, and QC gates
A bridge‑first logic protects longitudinal comparability. Think of bridge samples as the reference seams that stitch plates together. When they recur at planned frequency and positions, you can adjust NPX across plates without overfitting to noise. Randomization ensures group balance so plate artifacts don't masquerade as biology. Finally, QC gates define when you accept, review, or rerun.
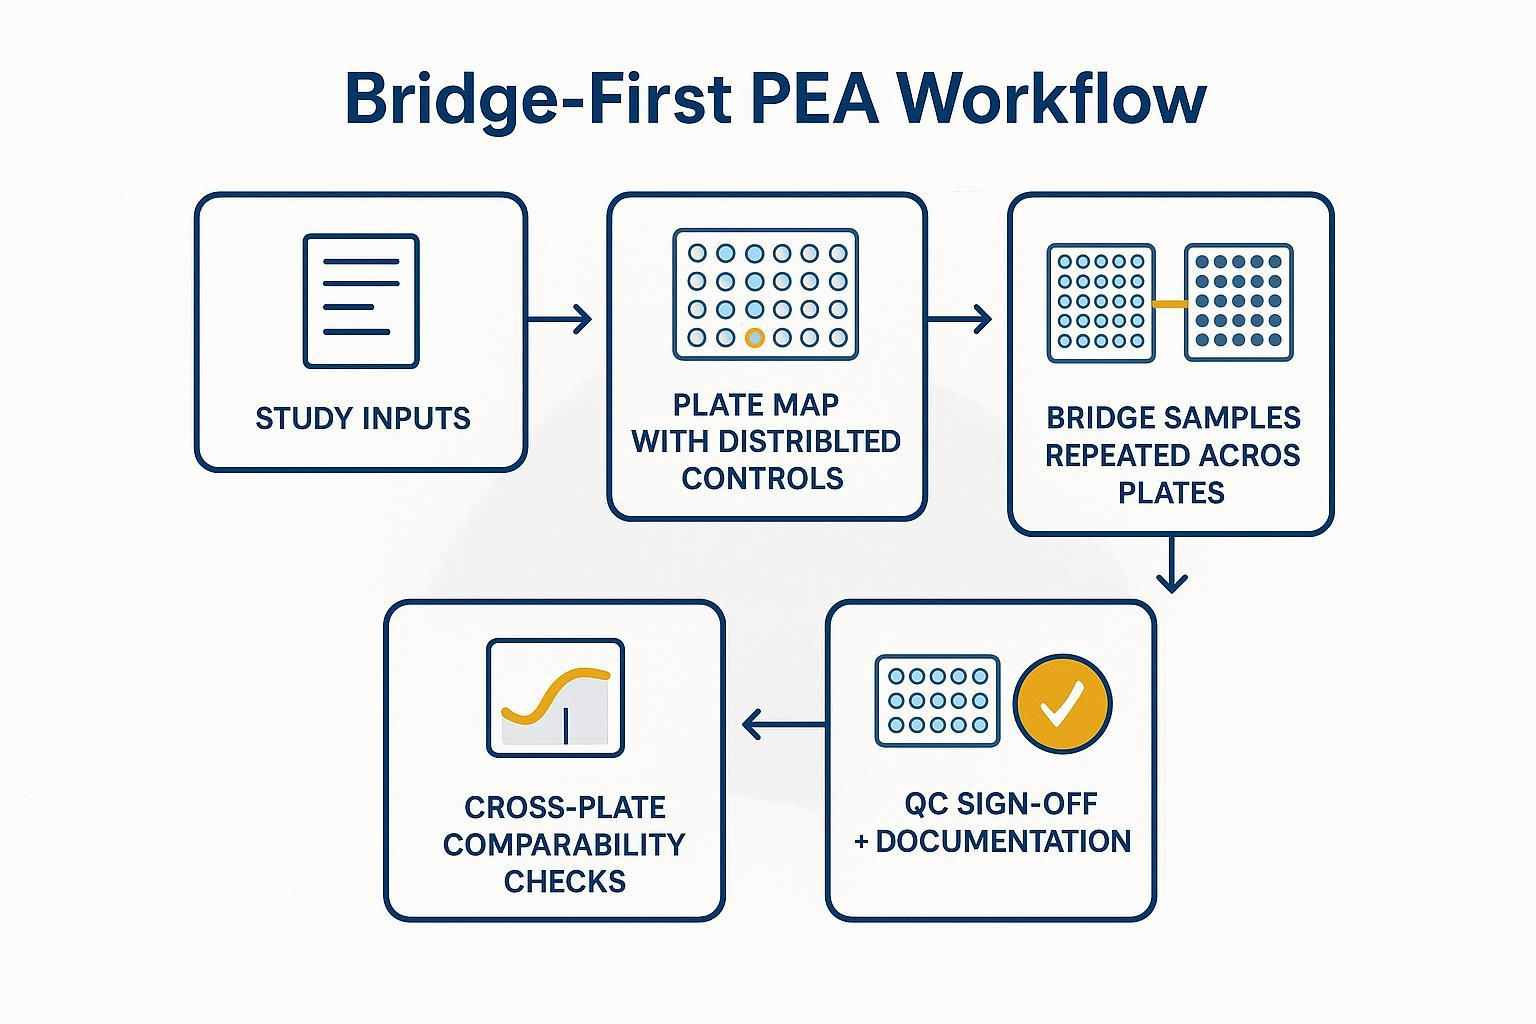 A bridge‑first workflow creates an auditable backbone for cross‑plate comparability in longitudinal studies.
Named SOP nodes you should be able to audit (titles only, without exposing proprietary parameters):
- SOP‑01 Sample Readiness Check (intake QA/QC and risk grading)
- SOP‑02 Plate Planning & Randomization (allocation and block design)
- SOP‑03 Bridge Sample Strategy (cross‑plate recurrence plan)
- SOP‑04 Run Execution & Control Monitoring (traceability of controls and bridges)
- SOP‑05 QC Gates & Sign‑off (Pass/Review/Rerun outcomes and signers)
- SOP‑06 Rerun & Deviation Management (documented triggers and CAPA‑lite)
- SOP‑07 Data Packaging & Field Dictionary (NPX export spec and codes)
- SOP‑08 Data Security, Retention & Transfer (governance and access)
Illustrative example (de‑identified): Disclosure: Creative Proteomics is our product. In a bridge‑first Olink PEA QC workflow for a murine cytokine pilot, we share a masked 96‑well plate map with control legend (SOP‑04), a Bridge Sample Distribution Plan showing the planned per‑plate recurrence (SOP‑03), and a QC Gates Checklist with sign‑off fields (SOP‑05). This is an illustrative example (RUO) and does not imply performance guarantees.
For a deeper look at NPX normalization and bridging concepts, see our article on the Olink data analysis process.
KPI discipline: what we track, what you can audit, and what triggers action
Without promising fixed values (they're matrix‑ and signal‑dependent), you should be able to review precision categories (intra‑plate, inter‑plate, and bridge‑to‑bridge variability), control stability across plates, QC outcomes (Pass/Review/Rerun) at sample and plate levels, and documentation completeness (sign‑off trail, deviation logs, rerun rationales).
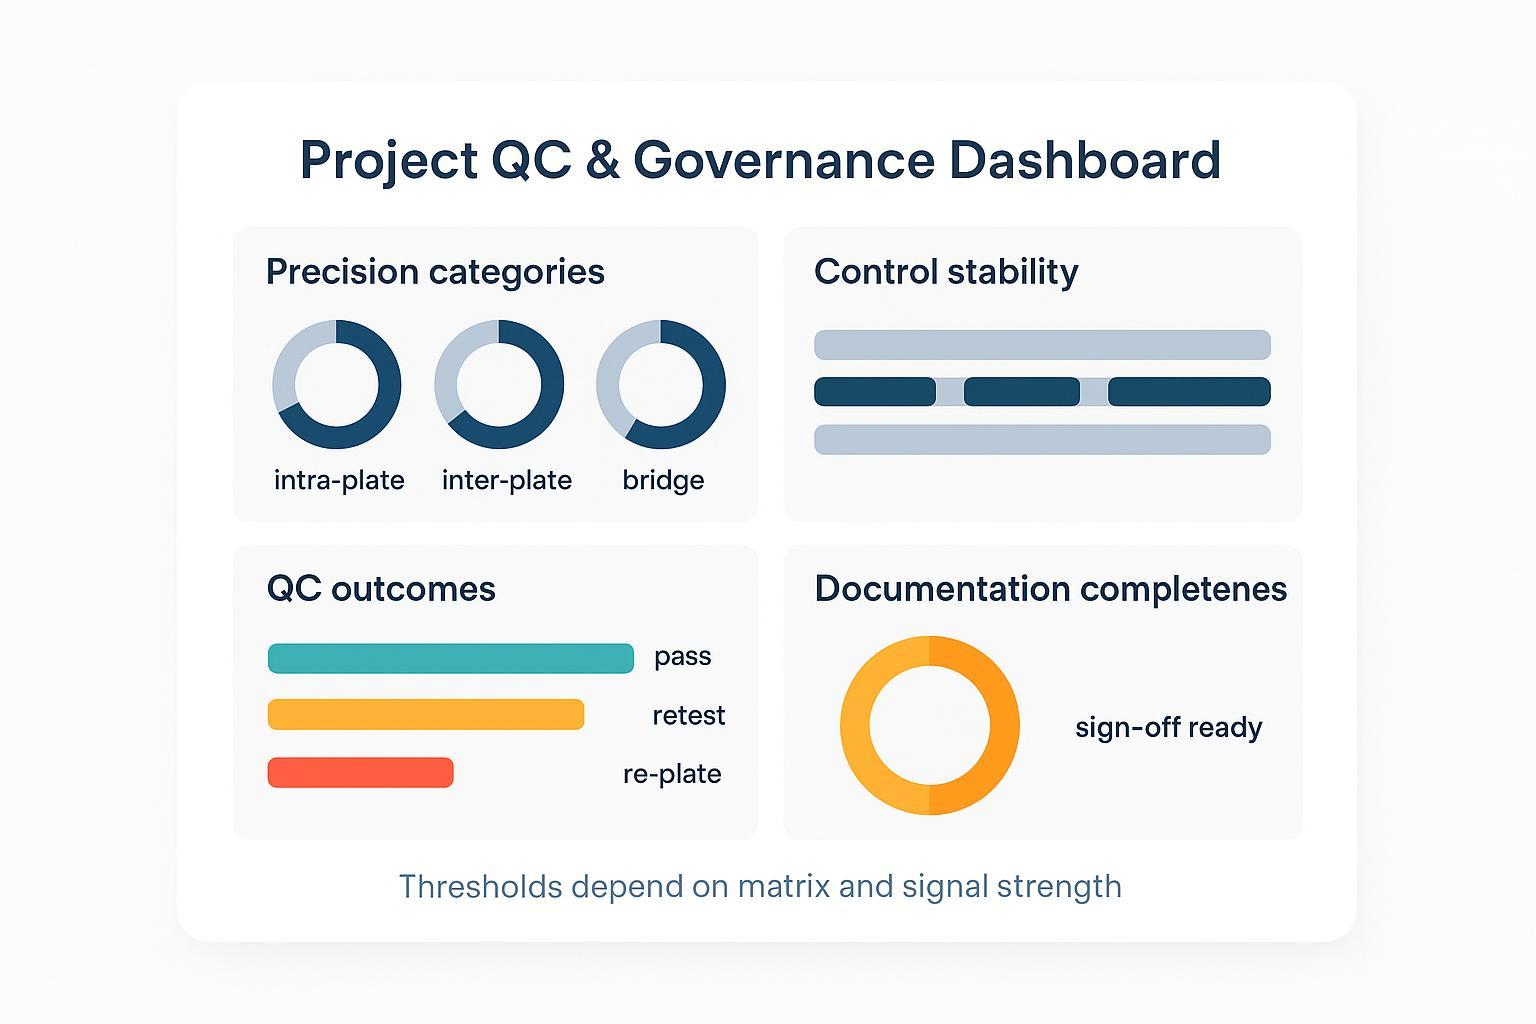 KPI discipline makes QC decisions consistent and reviewable—without relying on hidden judgment calls. Thresholds depend on matrix and signal strength.
Olink's software stack (e.g., NPX Software for qPCR/NGS QC) and Olink Analyze provide standardized QC outputs you can incorporate into governance dashboards.
Deliverables: what you receive and why it cuts review time
If a provider can't name the files, you can't audit them. Here's a package structure that reduces back‑and‑forth and supports publications:
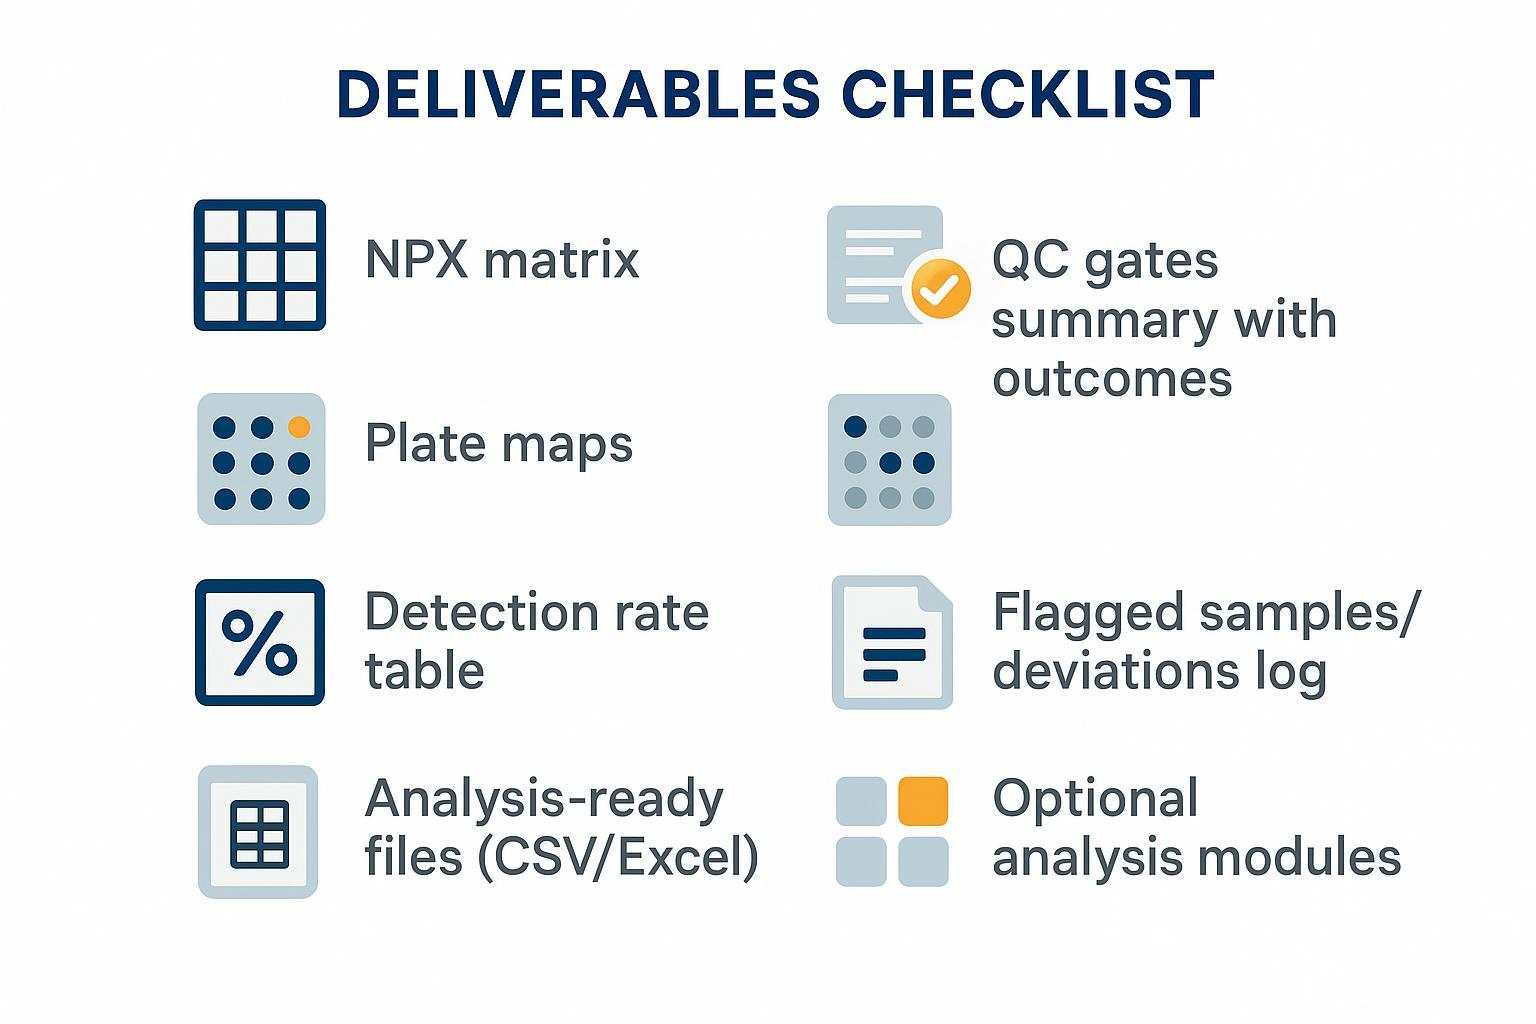 A clear deliverables checklist prevents scope misunderstandings and speeds internal review and publication readiness.
- NPX matrix (log2, normalized) with versioning, missing codes, and protein metadata.
- QC summary pack: outlier plots, detection rates, and control/bridge behavior.
- Plate maps: 96‑well layouts with control legend and bridge sample markers.
- Detection rate table: protein‑ and group‑level detection % (LOD/LLOQ contexted).
- Flagged samples/deviations log: documented exceptions and actions.
- Analysis‑ready files (CSV/Excel): field dictionary with units/scales and codes.
For context on NPX fields and QC, see our overview of the Olink data analysis process .
NPX vs absolute outputs: what's appropriate to report for RUO studies
NPX values are normalized, log2‑relative units intended for comparisons within the study design. Absolute pg/mL can be feasible in specific targeted contexts with proper calibrators and assay configuration; availability and appropriateness are study‑design and calibration‑context dependent (RUO).
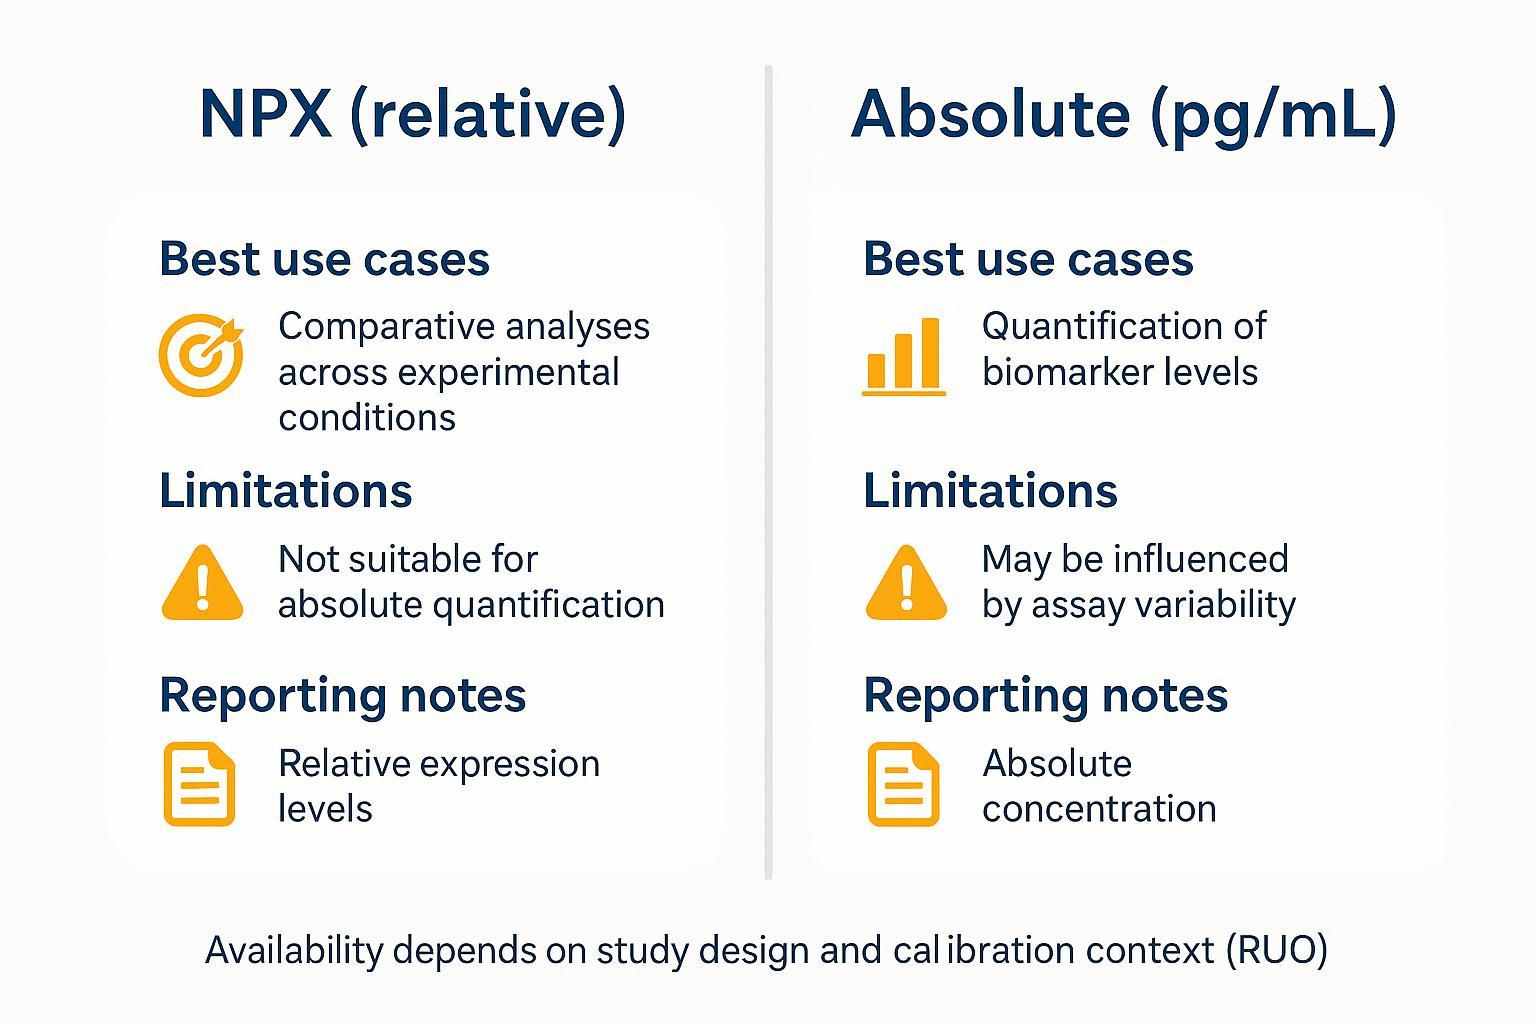 Choose the output format that matches your scientific question and reporting requirements—without overclaiming precision.
According to Olink's FAQ, NPX is designed for relative interpretation, and converting NPX directly to pg/mL isn't appropriate without proper calibration; see Olink's NPX and reporting FAQ . Olink assay pages also caution that plasma NPX can't be converted to absolute concentrations using reference figures; for an example of this cautionary note, see Angiopoietin‑2 assay guidance (Olink, 2024).
Multi‑omics integration: what "integration" means as a deliverable
"Integration" should produce outputs your team can model and interpret: model‑ready feature tables aligning protein NPX with RNA‑seq counts and metabolomics features via a clean sample‑ID key; correlation modules (protein–gene, protein–metabolite) with multiple‑testing controls; pathway overlays linking differentially abundant proteins to gene networks and metabolic pathways; and responder stratification summaries suitable for preclinical decision gates.
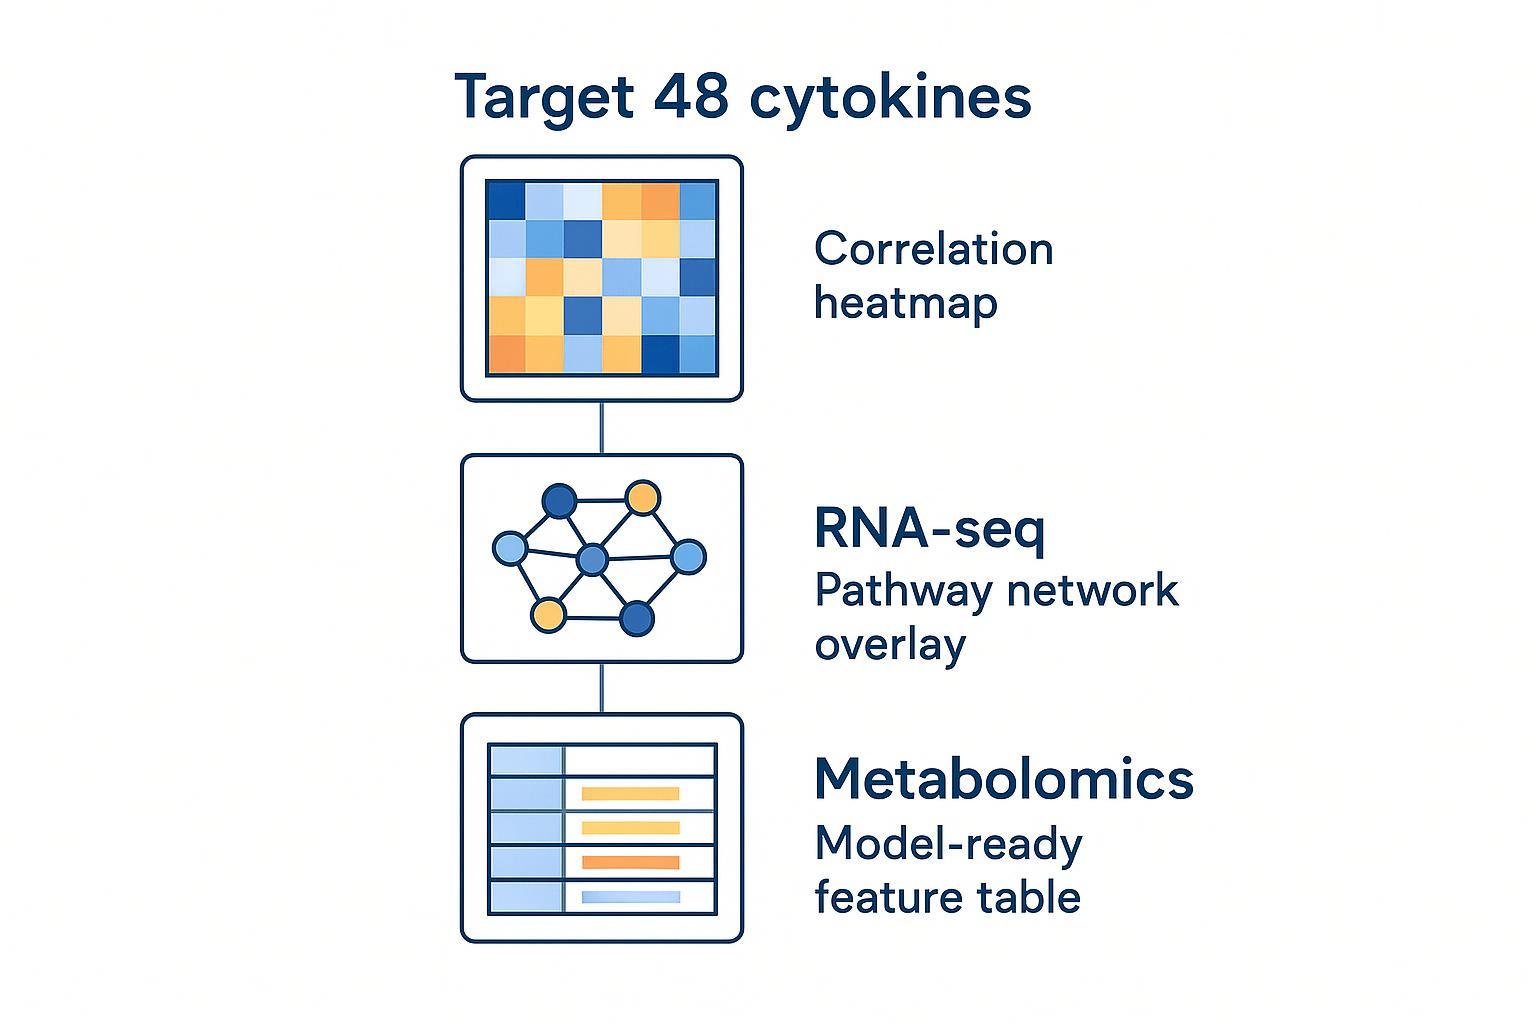 Caption: Integration only matters when it produces outputs your team can model, interpret, and act on.
Required inputs to do this well: an RNA‑seq count matrix (samples × genes) with matched sample IDs; a metabolomics feature table with identifiers and normalization notes; and a documented alignment key. For background reading on panel scope, see our Target 48 Cytokine panel overview and our high‑throughput proteomics overview. For real‑world context on proteogenomics deliverables, Olink's application articles discuss model‑ready outputs in population‑scale projects, for example the population‑scale proteogenomics overview (Olink, 2023).
Project planning without fixed timelines: milestone‑based execution and QC sign‑off gates
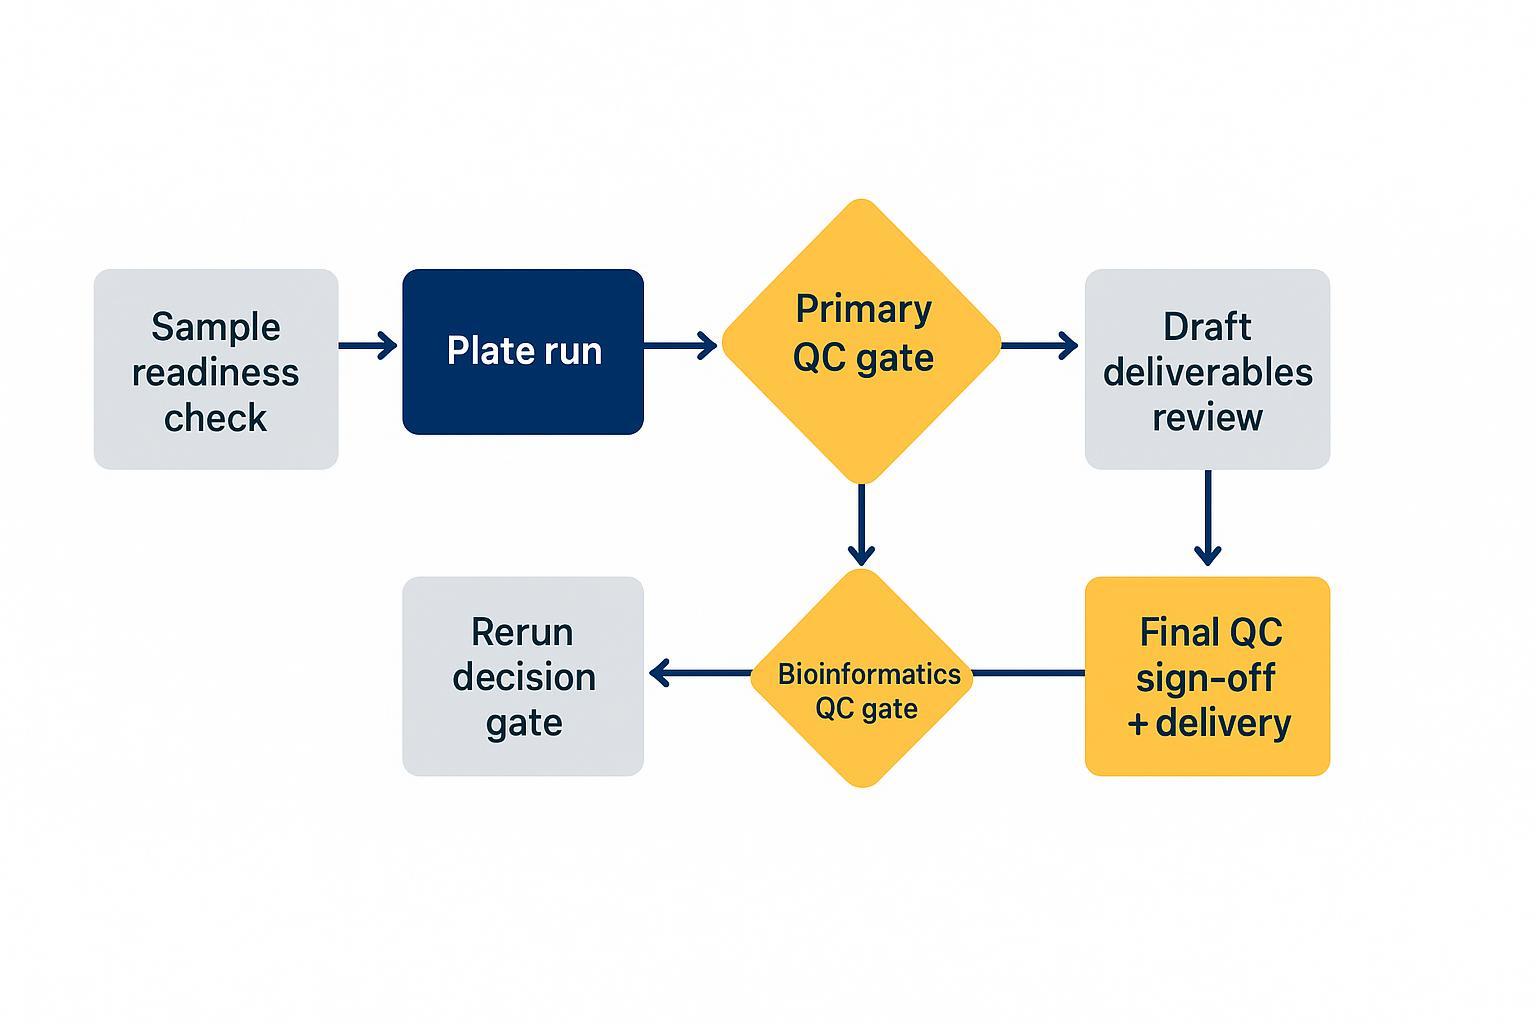
Replace timeline promises with visible gates. Work typically progresses as: sample readiness check → plate run → primary QC gate → rerun decision gate (if triggered) → bioinformatics QC gate → draft deliverables review → final QC sign‑off and delivery. The main sources of delay are sample issues, required reruns, and scope changes—but durations vary and aren't promised.
 A milestone‑based plan keeps progress transparent without making unrealistic time promises.
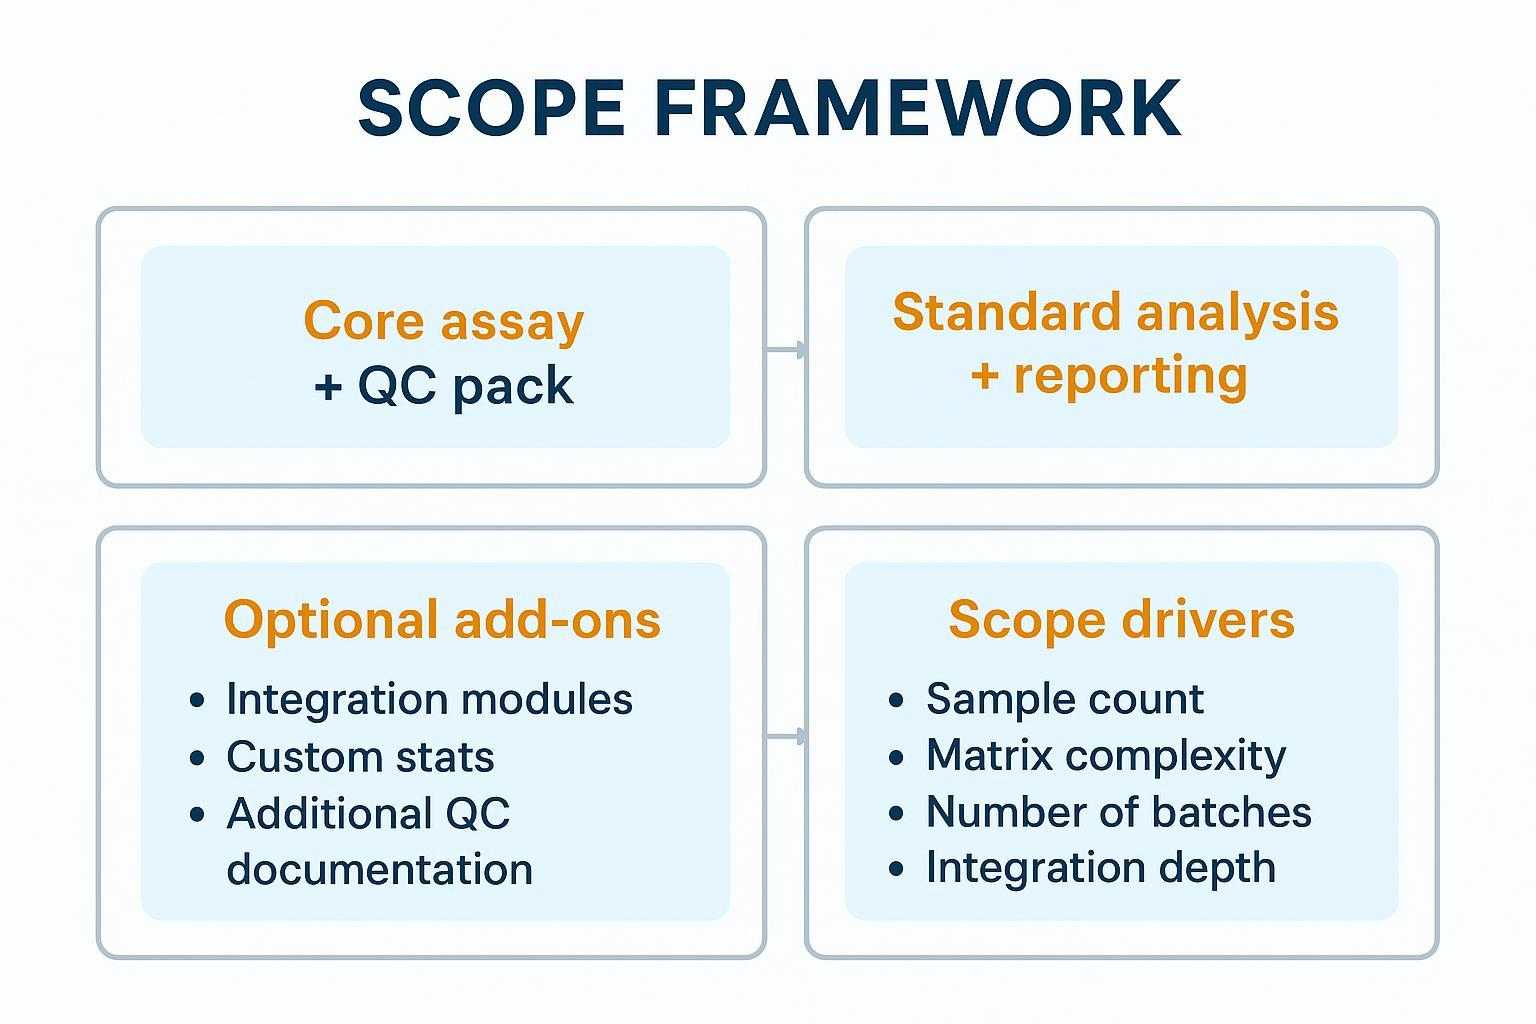
Scope and quote structure (no prices): what's included vs optional
Procurement‑friendly structure without price anchors:
 A clear scope framework helps stakeholders align before procurement—without relying on price anchors.
- Core assay + QC pack: Target 48 Mouse Cytokine run, controls/bridges, QC gates, and sign‑off.
- Standard analysis + reporting: NPX normalization, basic statistics, QC summary pack, and deliverables.
- Optional add‑ons: integration modules (RNA‑seq/metabolomics), custom statistics, additional QC documentation.
- Scope drivers (influence effort): sample count, matrix complexity, number of batches, integration depth, governance requirements.
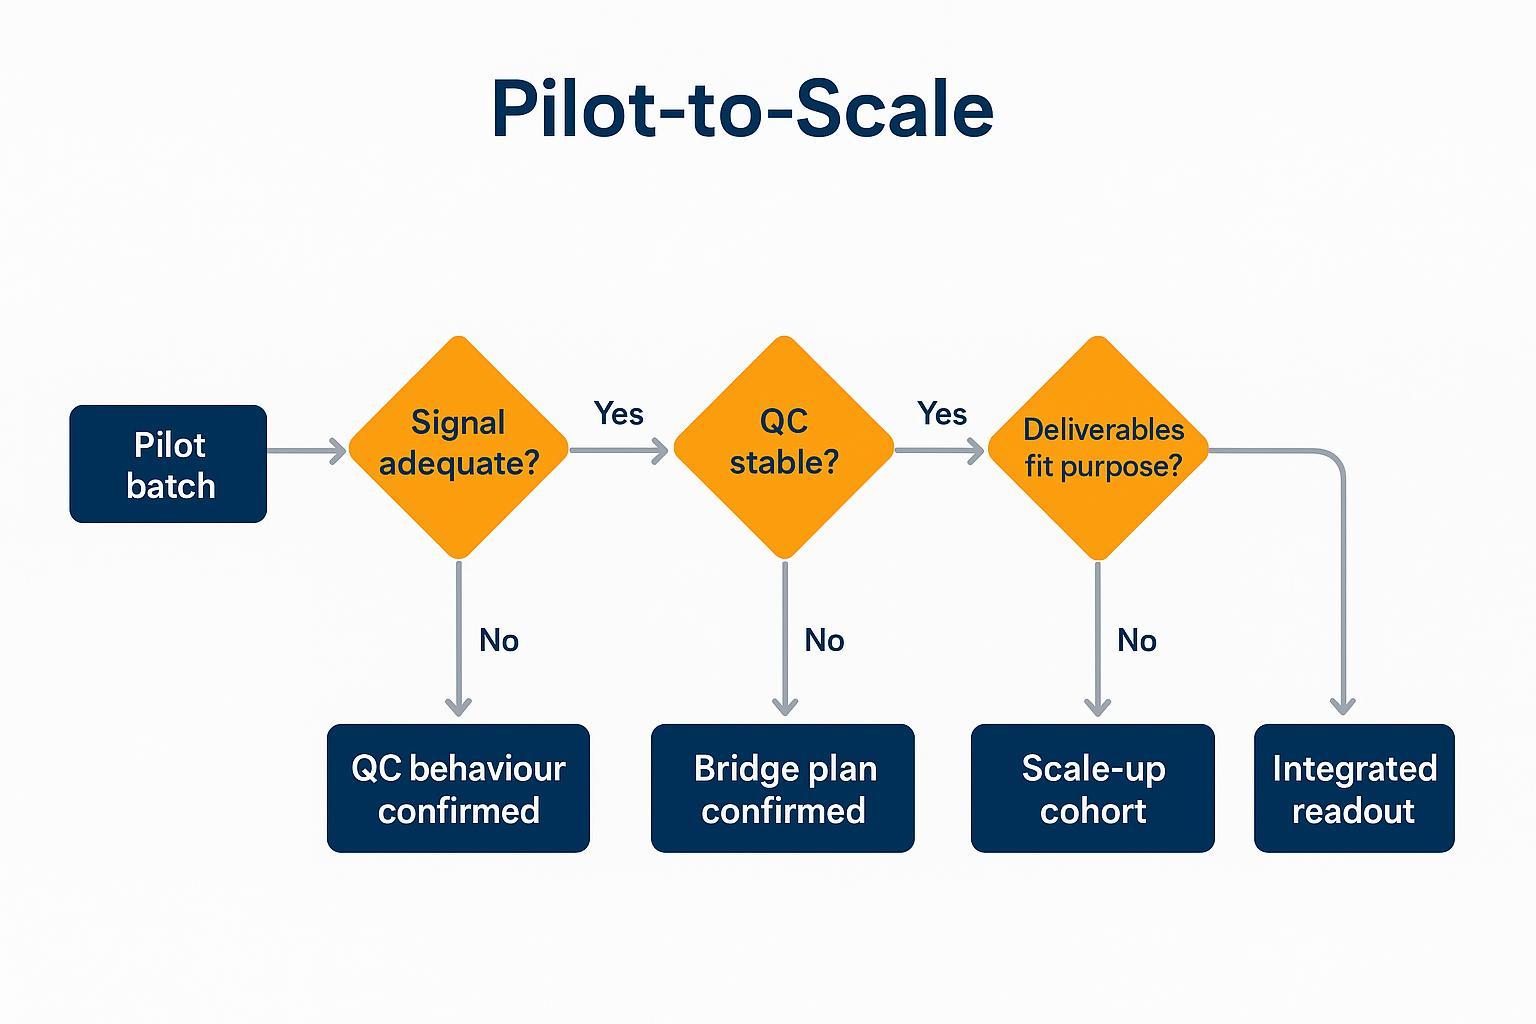
Pilot‑to‑scale pathway: reduce risk before expanding the cohort
Confirm signal, confirm QC behavior, confirm deliverables format—then scale. A pilot de‑risks longitudinal investments by validating plate discipline, bridge performance, and the usefulness of the NPX + QC bundle for your internal review and publication needs. This guidance applies directly to Olink Target 48 mouse cytokine programs considering multi‑plate expansion.
 A pilot‑to‑scale pathway reduces risk and improves confidence before committing the full longitudinal cohort.
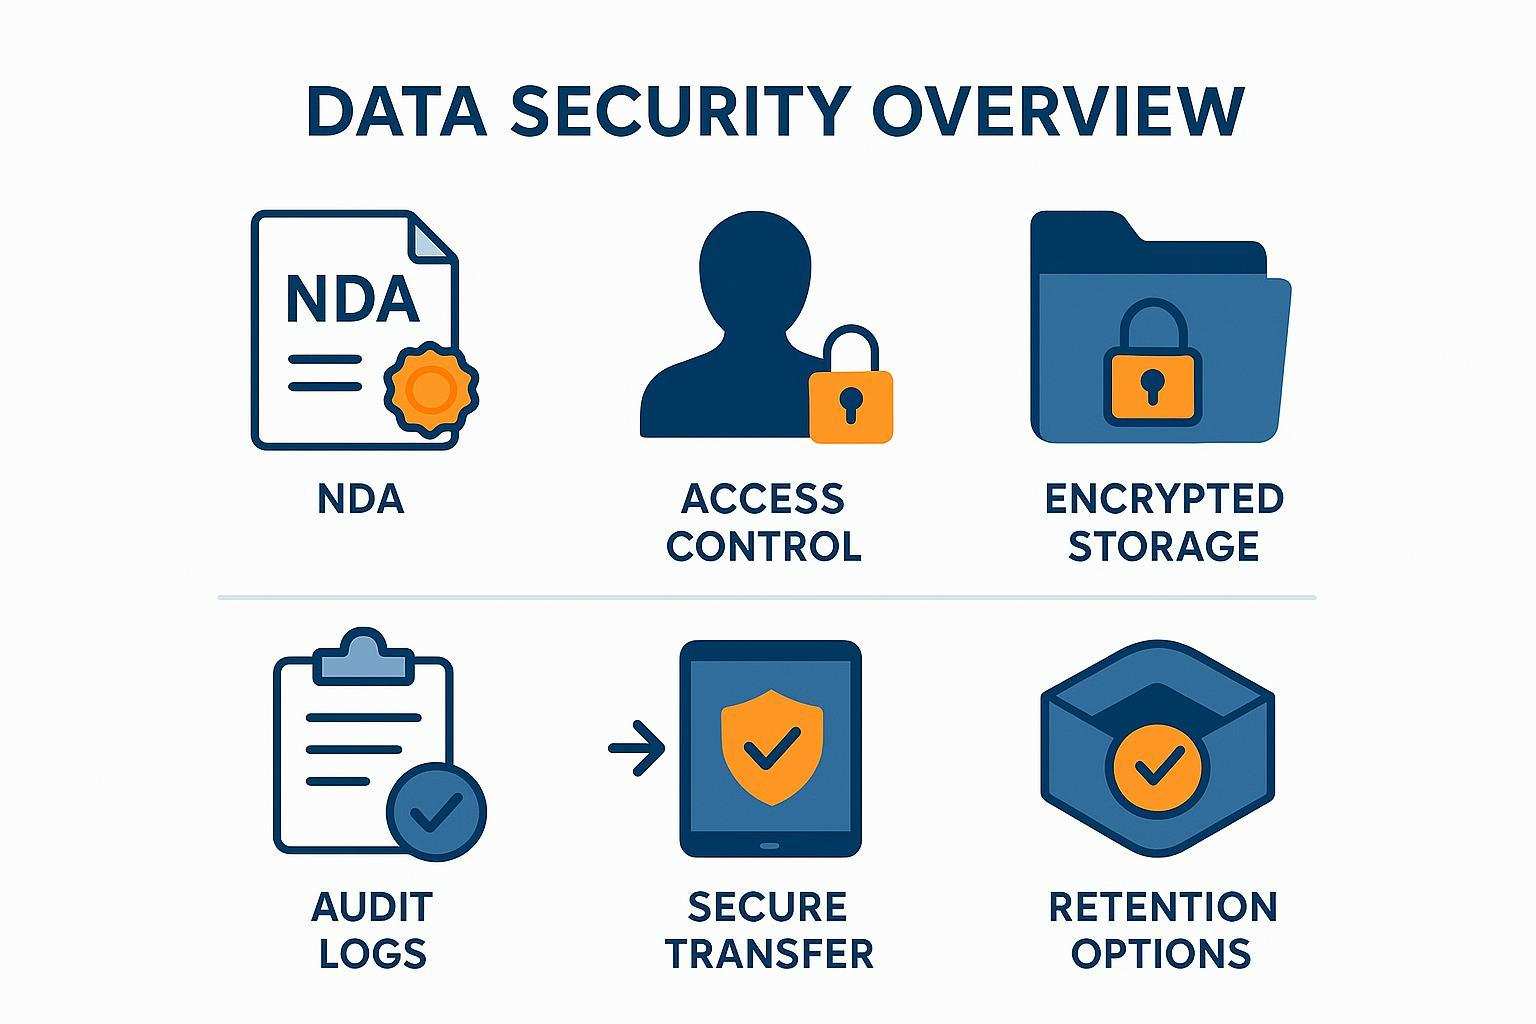
IP, confidentiality, and data security: what to expect in a standard SOW
Governance should be easy for procurement to evaluate: confidentiality terms, data ownership, access control, secure transfer, encrypted storage, audit logs, and retention options—summarized in the SOW and supported by SOP‑08.
 Clear data governance terms reduce procurement friction and protect your study before publication.
Mandatory statements (RUO): For research use only (RUO). Not for diagnostic or clinical use. Client data remain confidential. Data ownership and access are defined in the SOW.
Reference‑style use cases: what questions Target 48 can answer in murine models
Use cases should avoid clinical claims and focus on mechanism and decision support in preclinical contexts:
 Common murine model scenarios where Target 48 cytokine signatures support mechanism and decision‑making.
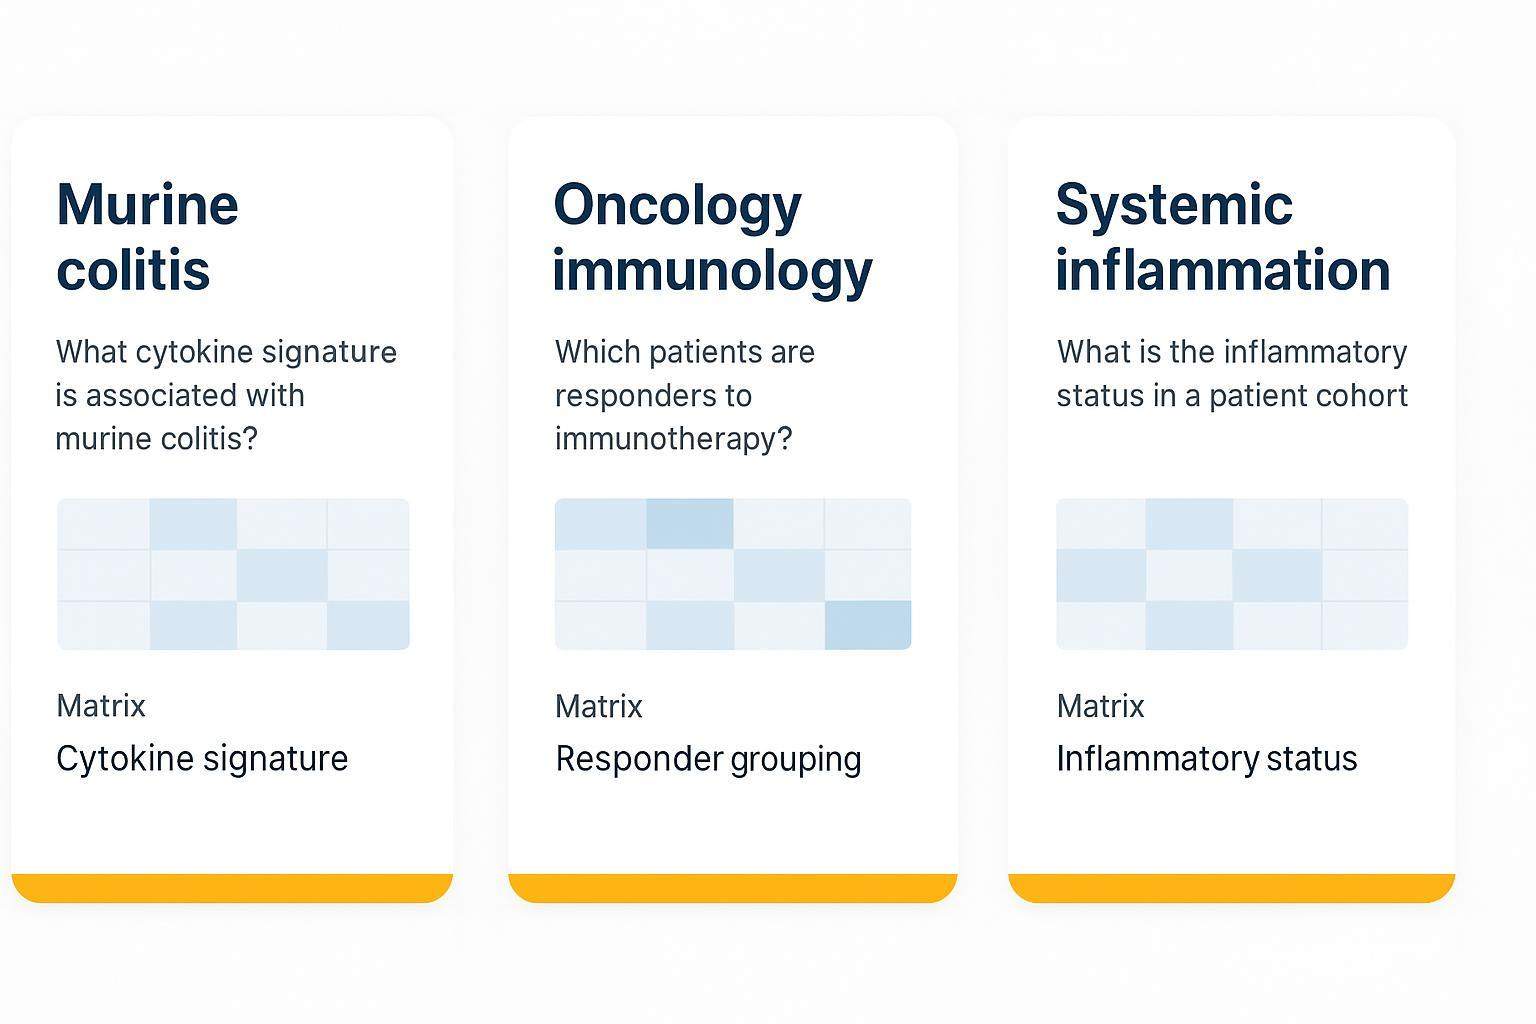
- Murine colitis: Which cytokine patterns distinguish severity classes in plasma/serum? Output: signature candidates and group‑level detection summaries.
- Oncology immunology: Do bridge‑normalized cytokines distinguish responders in a syngeneic model? Output: responder grouping table and protein–gene pathway overlay.
- Systemic inflammation: Are interferon‑related signals detectable above LLOQ across timepoints? Output: detection‑rate tables with below‑LLOQ handling notes.
Buyer FAQ (answers without overpromising)
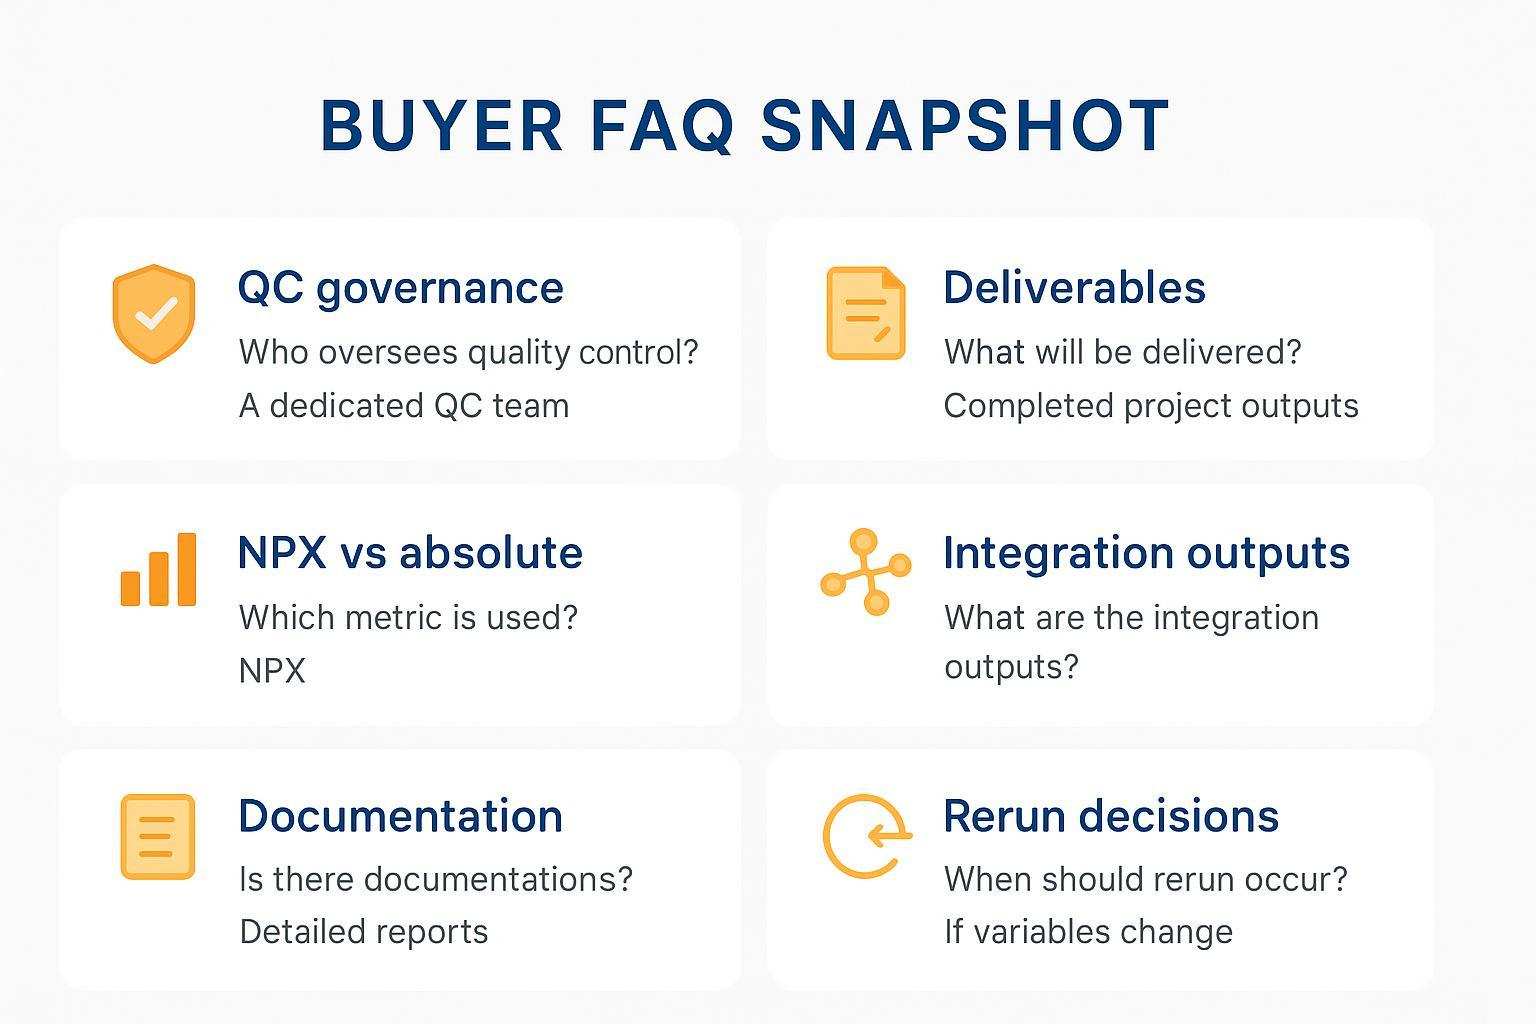 Fast answers to decision‑stage questions—focused on QC, deliverables, and governance.
How do you reduce batch effects?
We design bridge‑first plate layouts with randomized group placement and apply bridge‑based normalization supported by pre/post QC plots.
What exactly do we receive?
NPX matrix, QC summary pack, plate maps, detection rates, flagged sample/deviation log, and analysis‑ready CSV/Excel with a field dictionary.
NPX or absolute?
NPX supports relative comparisons. Absolute pg/mL may be feasible with calibrators in targeted contexts; availability depends on study design and calibration (RUO).
What inputs do you need for integration?
Matched sample‑ID keys, RNA‑seq count matrix (samples × genes), metabolomics feature table with identifiers/normalization notes.
How are reruns governed?
Triggers and actions are documented in SOP‑06 via a Rerun Decision Tree and Deviation Log (CAPA‑lite), with sign‑off records.
Can I audit the QC process?
Yes—SOP‑01 to SOP‑08 headings and de‑identified templates (e.g., plate map, QC checklist) are available for review.
Compliance reminders: For research use only (RUO). Not for diagnostic or clinical use. Performance depends on sample matrix, signal levels, and study design. Project scope and delivery milestones are defined after sample readiness and QC requirements are confirmed.
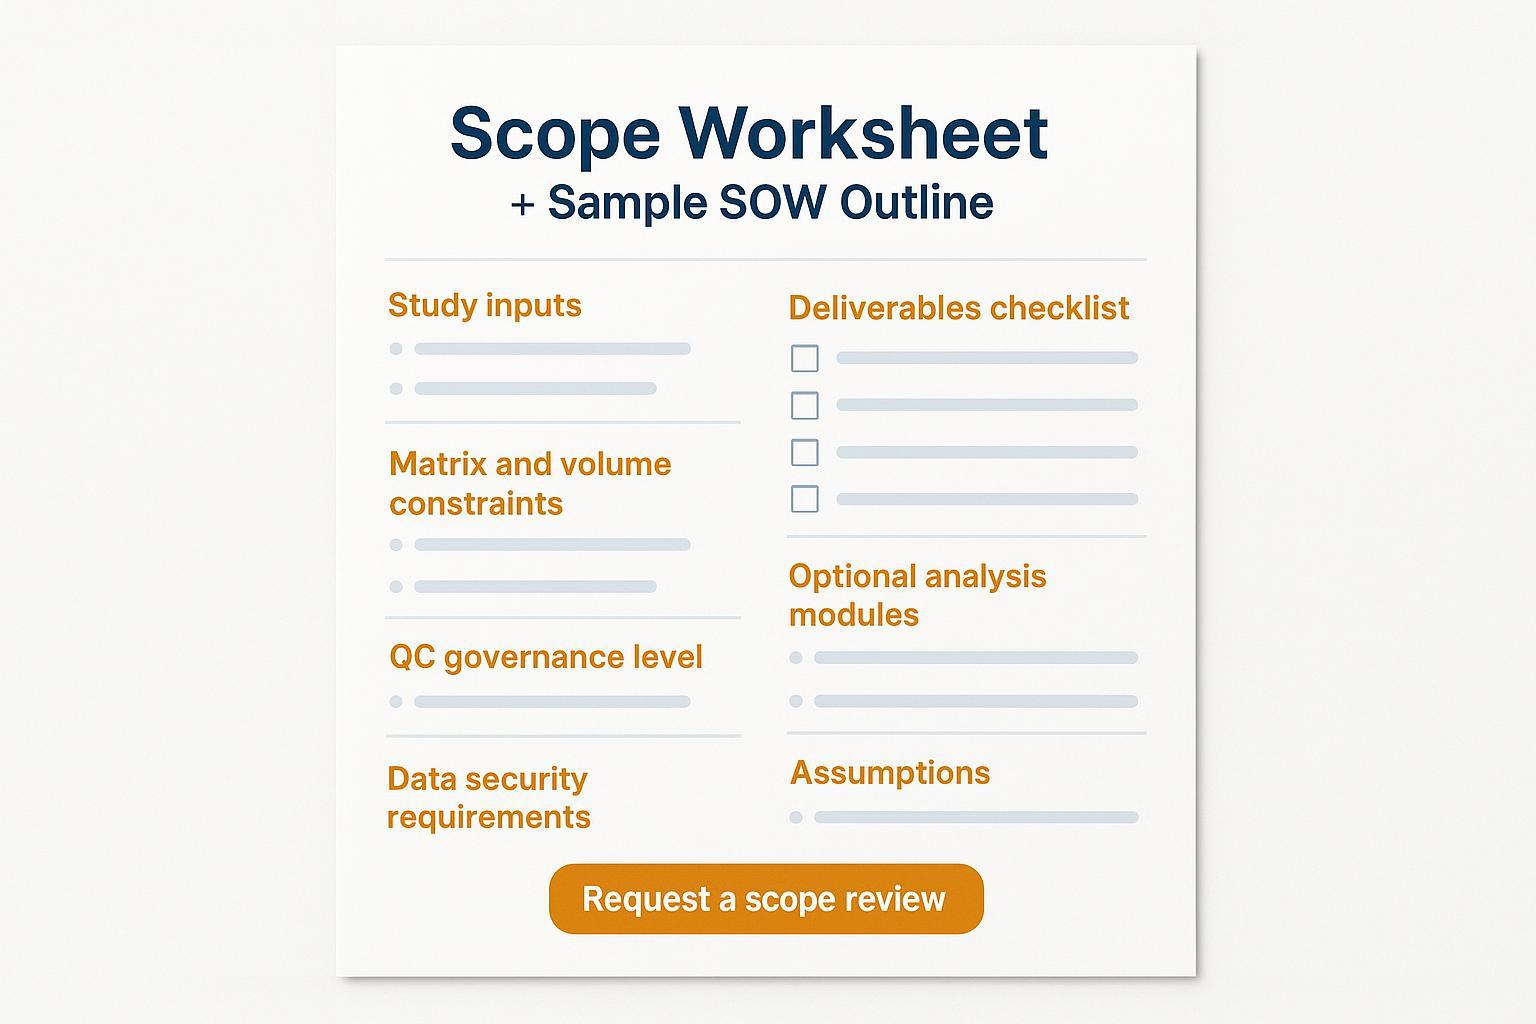
Next step: request a scope worksheet + sample SOW + deliverables checklist
If you'd like a de‑identified example of the QC pack and a scope worksheet to align stakeholders, request a scope review.
 A scope worksheet and SOW outline help you align stakeholders and move from interest to a defined project.
- You'll receive: a request form that captures matrix and volume constraints, governance expectations, and integration goals; a sample SOW outline; and a deliverables checklist. For research use only (RUO). Not for diagnostic or clinical use.
- Soft CTA: Request a scope review and receive a de‑identified QC pack example (RUO).
Appendix: audit‑ready file names and templates you can verify (illustrative)
To keep procurement and methods teams aligned, the following template/file names are commonly provided in de‑identified form:
- Bridge Sample Distribution Plan (Template)
- Batching & Plate Allocation Sheet (Template)
- 96‑well Plate Map Template (with control legend)
- QC Gates Checklist & Sign‑off Form (Sample)
- QC Summary Report (De‑identified Example Page)
- Rerun Decision Tree (Flowchart)
- Deviation Log Template (CAPA‑lite for RUO)
- Detection Rate Report Format (Template)
- Below‑LLOQ Handling Statement (Methods snippet)
- NPX Export Field Dictionary (Excerpt)
- Analysis‑ready Output Specification (CSV/Excel)
- Data Ownership & Access Statement (SOW section)
- Secure Transfer & Retention Options (One‑pager)
Notes on evidence disclosure: Where performance visuals are shown, they're presented as ranges or distributions and labeled as illustrative examples from internal feasibility runs (not client projects). Numeric thresholds and gates are matrix‑ and signal‑dependent and defined after sample readiness review.
Compliance statements (to be included on this page): For research use only (RUO). Not for diagnostic or clinical use. Performance depends on sample matrix, signal levels, and study design. Project scope and delivery milestones are defined after sample readiness and QC requirements are confirmed. Client data remain confidential. Data ownership and access are defined in the SOW.
References and further reading:
- Olink Analyze R package (bridging and QC visuals): Olink Analyze
- Batch‑effect correction with bridges (PEA): BAMBOO method (Olink, 2023)
- NPX software for standardized QC: NPX Software
- NPX vs absolute reporting guidance: Olink FAQ; Angiopoietin‑2 assay caution
- Proteogenomics deliverables context: Population‑scale proteogenomics overview
- Bridge-first normalization in practice: Nature Medicine 2021 "Next generation plasma proteome profiling" (Zhong et al.) — reports reference/bridge sample–based normalization to minimize between-batch variation in Olink PEA.
- Multi-cohort batch correction with bridges: Nature Communications 2024 "Synthetic plasma pool cohort correction (SPOC)" (Heylen et al.) — details Olink-recommended biological bridging samples for inter-plate correction and introduces SPOC for cross-cohort harmonization.
- Information security certification scope: ISO/IEC 27001:2022 Information security management systems — ISO — official overview of ISMS requirements commonly used for external InfoSec certification.
- Quality management overview: ISO 9001:2015 quality management systems — ISO explainer — official introduction to QMS principles and certification context.

