Why Setting Up Olink Panels and Protocols Matters
Many labs today struggle to obtain reproducible proteomics data. That often stems from unclear sample handling, uncalibrated equipment, or gaps in the protocol. Setting up a reliable Olink protocol in‐house can solve these issues by reducing inter-lab variability, cutting turnaround time, and improving sensitivity—all while using very small sample volumes.
In this guide, you will learn how to establish the core lab infrastructure for Olink panels, master pre-analytical sample preparation, run the Olink workflow correctly, and implement quality controls. If your institution runs proteomics, or you are considering bringing Olink in-house, this article gives you the confidence and steps to do it well. We focus purely on setting up and operating the Olink protocol—not on specific panel applications or disease claims.
What Is Olink Proteomics and Core Advantages
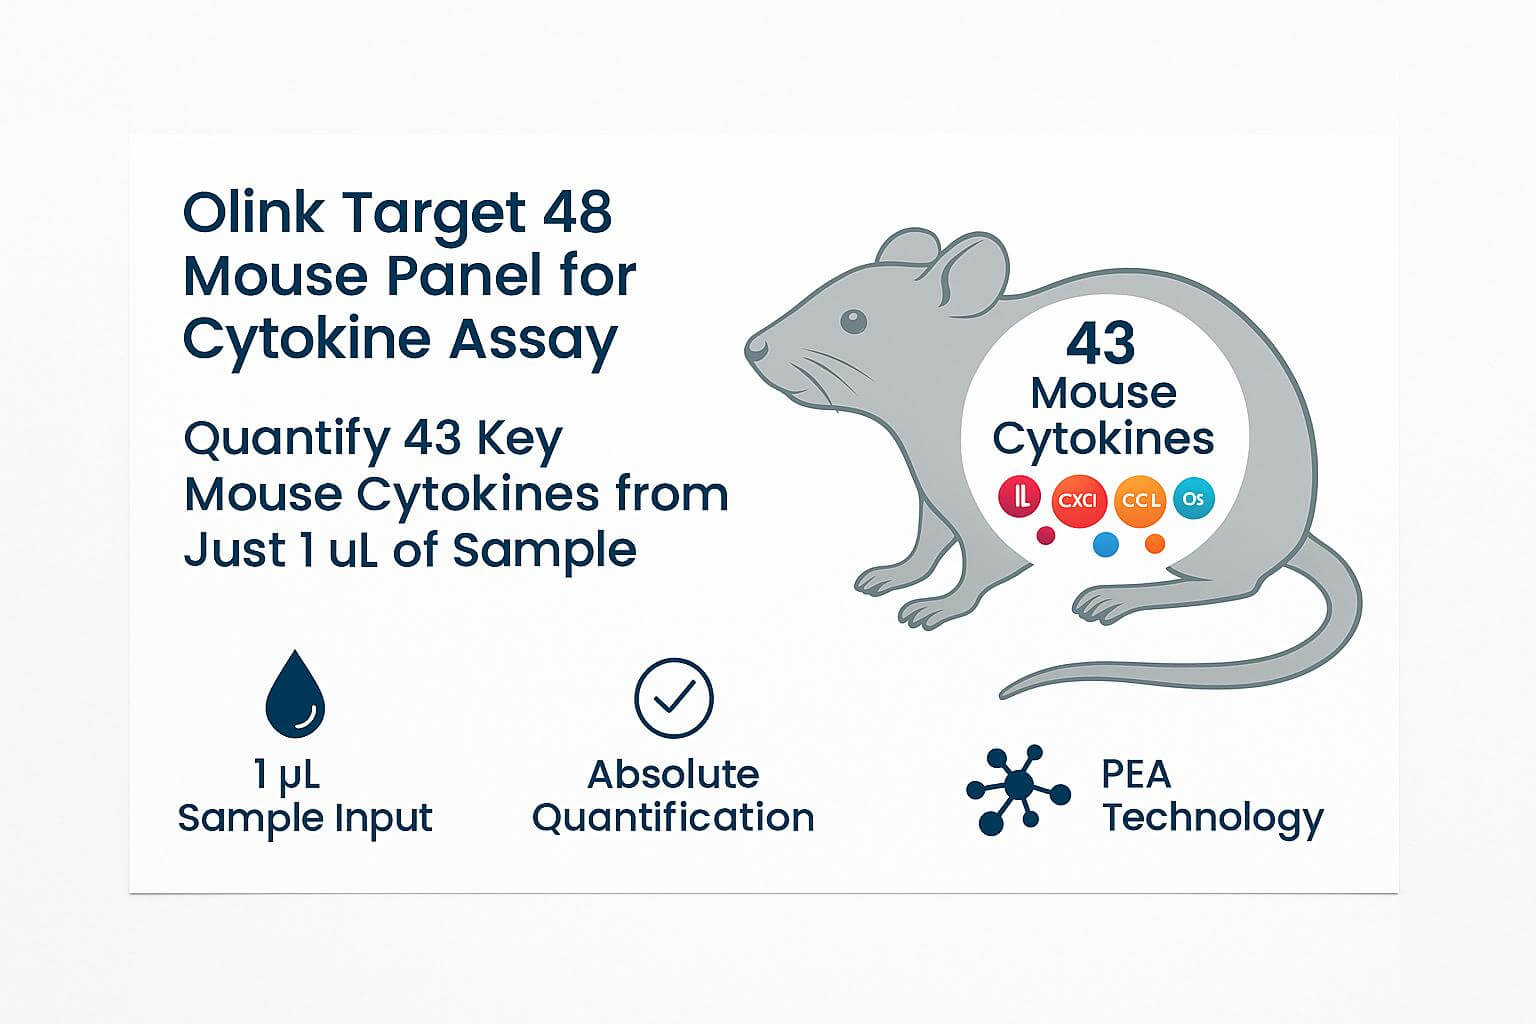
Olink Proteomics uses a technology called the Proximity Extension Assay (PEA) to measure proteins in biological samples. In PEA, two different antibodies bind to the same target protein. Each antibody is attached to a unique DNA oligo. When the antibodies are sufficiently close (i.e. bound to the same protein), their attached oligos hybridize and are extended by a DNA polymerase. This extension yields a DNA barcode specific to that protein, which is then amplified and quantified by either qPCR or next-generation sequencing (NGS).
Below are the major strengths of Olink panels and protocols compared to traditional proteomics or immunoassays methods:
Key Advantages
| Advantage | What It Means in Practice |
| High specificity | Because two matched antibodies must bind and their oligos must hybridize, false positives are much less common. Cross-reactivity is minimised. |
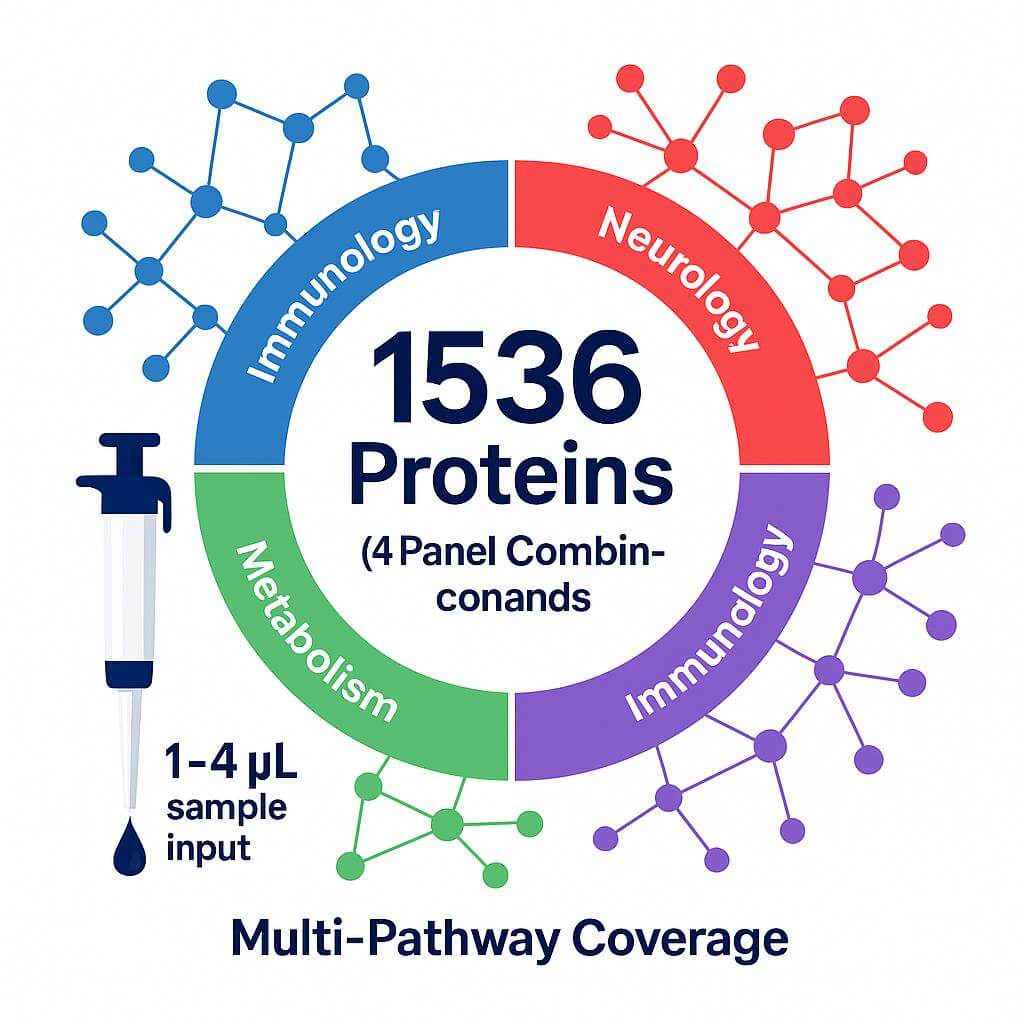
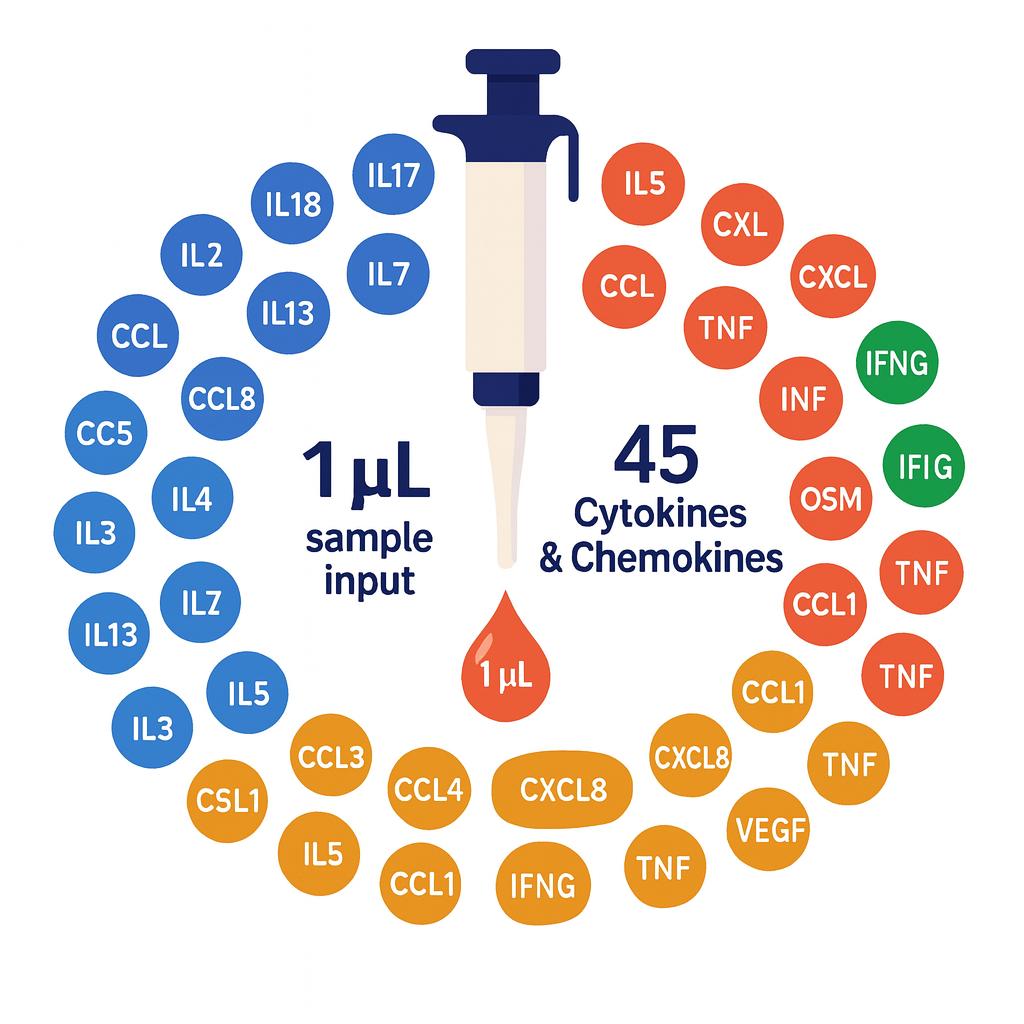
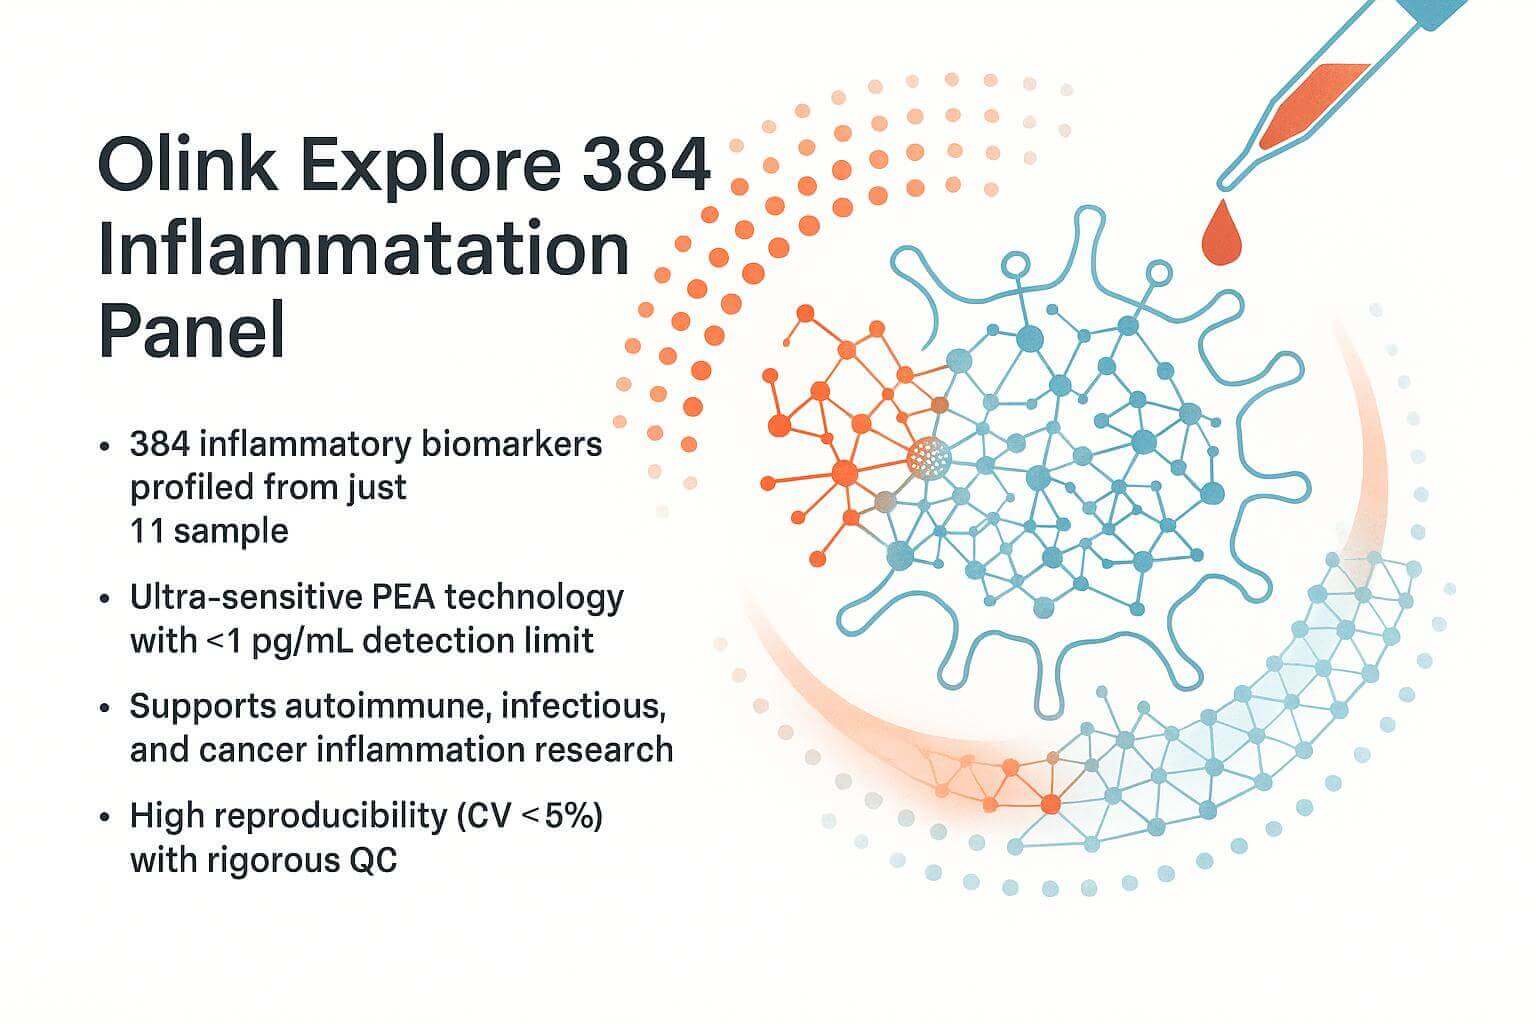
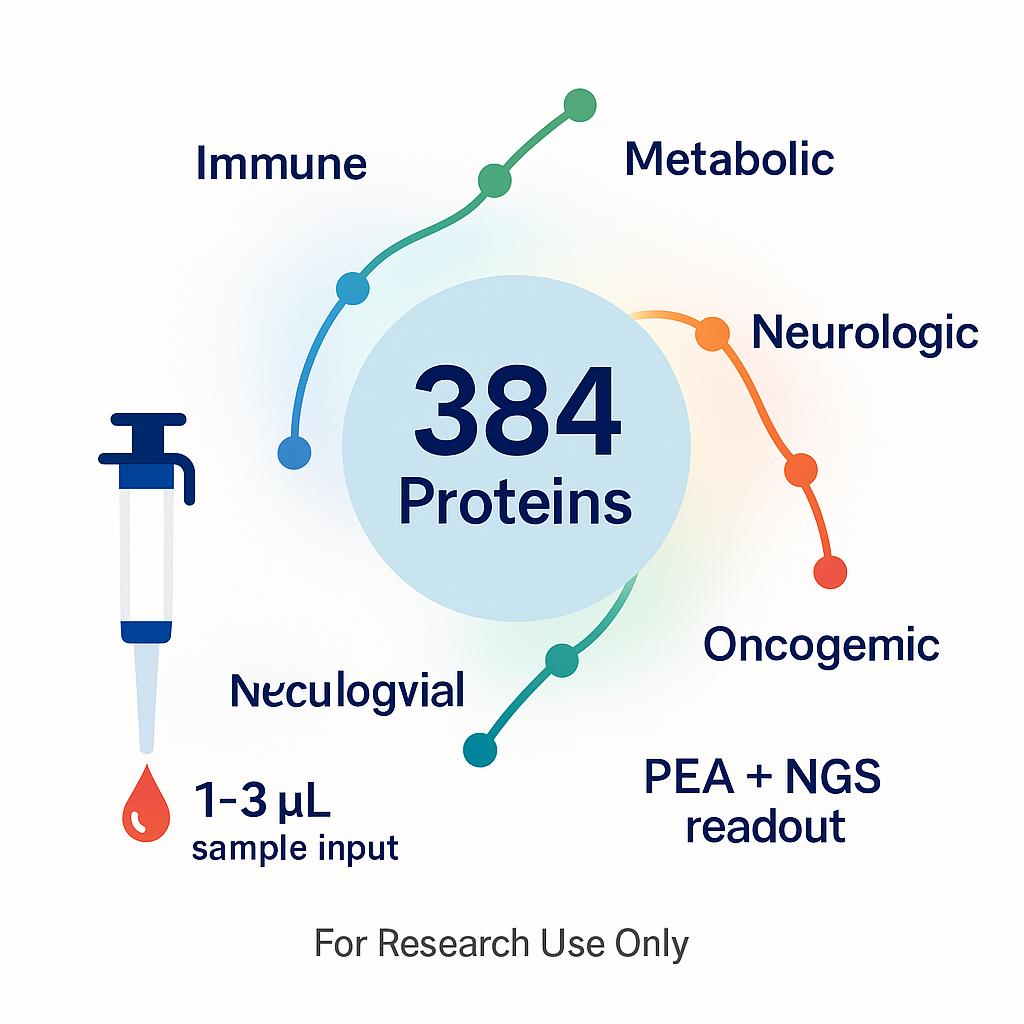
| Low sample volume required | Olink panels often require only 1-2 µL of plasma or serum per assay, even when measuring dozens to thousands of proteins. Ideal for scarce or precious samples. |
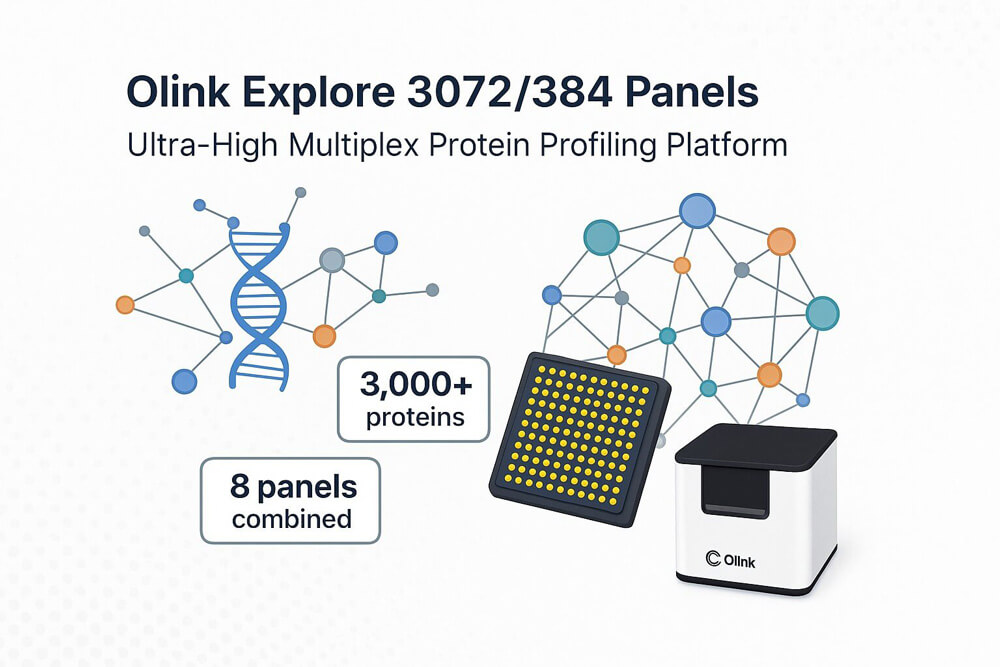
| Wide multiplexing | You can measure many proteins in parallel — ranging from a few tens (e.g. 48 or 96-plex) to thousands (in Explore platforms) — without needing dozens of separate immunoassays. |
| High sensitivity & dynamic range | PEA combined with PCR/NGS amplifies low abundance proteins while still quantifying abundant ones, covering several orders of magnitude in concentration. |
| Faster throughput & scalability | Small sample volumes + multiplexing allow more samples per run. Labs can scale up to process many samples per day or week, depending on instruments. |
Contextual Comparison with Other Methods
Versus ELISA / classical immunoassays: ELISA is limited in multiplexing and often needs larger sample volumes when multiplexed. It may also have more cross-reactivity and lower sensitivity for very low abundance proteins.
Versus mass spectrometry (MS / LC-MS): LC-MS allows discovery of many proteins (untargeted), but often needs sample depletion, fractionation, or more starting material; throughput and reproducibility can suffer under high sample load. PEA offers better reproducibility for low to moderate plex, especially in plasma or serum.
Adoption & Evidence Base
Olink's PEA technology has been cited in over 2000 peer-reviewed publications across many research areas.
The platform is used globally by academic institutions, biotech, and CRO labs, demonstrating its utility for non-clinical, discovery, and translational biology.
For readers new to Olink proteomics, we recommend checking our "Introduction to Olink Proteomics: What You Need to Know" for foundational background. This helps set context before moving into lab setup and operational detail.
Infrastructure & Lab Requirements for Olink Setup
Setting up Olink panels in your lab requires more than just reagents—you'll need proper space, instruments, and environmental controls. Below are the essential infrastructure and equipment components, drawn from Olink technical notes and published workflows. (For Research Use Only; this is non-clinical.)
Key Laboratory Infrastructure
Clean, temperature-stable workspace: Maintain bench areas free of vibrations and drafts. Fluctuations in temperature can degrade probes or affect the PEA hybridisation step.
Cold storage: Freezer(s) at −80 °C for long-term sample archiving; −20 °C storage for intermediate reagents or libraries, if required. Refrigerated centrifuges (4 °C) for sample processing.
Dedicated sample prep area: Separation of sample processing from amplification/readout zones minimizes contamination risk.
Essential Equipment
| Function | Required Instrument / Tool | Purpose & Minimum Spec |
| Sample processing | Refrigerated centrifuge (4 °C) capable of reaching ~10,000 × g (or per panel's instructions), balanced rotors. | To separate serum/plasma cleanly; to remove debris in tissue lysate or other biofluids. |
| Pipetting & liquid handling | Adjustable pipettes (single- and multichannel), ideally including low-volume (µL) or nanolitre capacity; certified filter tips. Optional: automated liquid handlers. | Accurate, precise dispensing is crucial especially when sample volume is small. |
| Thermal control / incubation | Thermomixer / hybridisation incubator maintaining stable temperature (e.g. 4 °C for incubations, 37 °C where needed). Thermal cycler for probe extension / amplification. | To control PEA probe binding, oligo extension, PCR steps. |
| Readout platforms | Depending on panel type: qPCR instrument for Target/Flex panels; sequencer (Illumina NextSeq, NovaSeq, etc.) for high-plex Explore panels. | If using NGS readout, you'll need sequencer capacity and related reagents + flow cells. From technical note: for Olink Explore 3072, NovaSeq 6000 / NextSeq systems are compatible. |
| Library prep equipment (for NGS workflows) | PCR thermal cyclers, magnetic bead-based purification tools (e.g. AMPure beads), QC devices like Bioanalyzer or TapeStation (for fragment size, library integrity). | Ensures high quality of library before sequencing. |
| Data handling infrastructure | A workstation / server with bioinformatics tools; software for NPX normalization; computing power for handling NGS data if doing high throughput. | For example, Olink provides NPX Manager and other software tools for data QC and normalization. |
Environmental & Operational Considerations
Contamination control: Separate pre-amplification and post-amplification areas to avoid carry-over of amplified DNA. Use aerosol-resistant tips. Clean workbenches and equipment regularly.
Temperature & humidity stability: Maintain consistent room temperature; avoid high humidity which can interfere with assay reagents.
Calibration & maintenance schedules: Regular calibration of pipettes, thermal cyclers, qPCR machines, sequencers. Ensure centrifuges are balanced. Maintain instrument logs.
Personnel training: Staff must be familiar with low-volume pipetting, strict avoidance of cross-contamination, handling of PCR/NGS workflows. Standard operating procedures (SOPs) documented and adhered to.
Case Study Snapshot
In the Olink technical note "Multiplex High-Throughput Proteomics with Exceptional Analytical Specificity" (Olink & Illumina, 2022), labs running the Explore 3072 panels needed ~6 µL of plasma per sample, used NovaSeq / NextSeq instruments, and required validation of library QC (size profiles) before sequencing. The workflow also emphasized using −80 °C storage for sample conservation and implementing both pre- and post-PCR physical separation.
Once your lab infrastructure is ready, you may want to see how Olink panels perform specifically in plasma matrices. Check out our article "Olink's Plasma Proteomics: Unlocking Insights for Disease Research". This will help you anticipate sample-type challenges even before assay setup.
Sample Collection, Handling, and Pre-Analytical Considerations
Getting sample collection and pre-analytical steps right is key for reliable results with any Olink panel. Errors here ripple through the workflow and can reduce sensitivity, increase background, or introduce batch effects. Below are best practices drawn from Olink-validated protocols and peer-reviewed literature.
Sample Types & Choosing Plasma vs Serum
Olink panels are validated primarily on plasma and serum. Other matrices (e.g., cerebrospinal fluid, tissue lysates, supernatants) can work, but require pilot testing.
Plasma vs serum:
Plasma (with anticoagulants like EDTA, citrate, or heparin) prevents clotting but may include more platelets.
Serum involves clotting and removal of clot, which can alter levels of certain proteins activated or consumed during clot formation. Consistency is important: use the same sample type across all experiment arms.
Blood Collection & Tubes
Use standard collection tubes appropriate for your sample type (EDTA, citrate, or serum-separation tubes). Each batch should use the same tube brand and anticoagulant type to reduce variability.
Venepuncture guidelines: avoid prolonged tourniquet time, use proper gauge needles, avoid hemolysis (gently invert tubes rather than shaking). Hemolysed or lipemic samples may introduce artifacts.
Timings & Temperatures during Handling
Time from draw to centrifugation should be minimised. For plasma, many protocols aim for processing within 4 hours of draw; for serum, allow clotting (typically 15-30 min) but avoid leaving clot too long (>60 min) before centrifugation.
All steps until freezing should be done at 2-8 °C (on ice / refrigerated centrifuge) when possible. Keeping samples cold reduces proteolysis and degradation.
Centrifugation & Clarification
First spin: remove cells via centrifugation at ~ 1,000-2,000 × g for 10 minutes at 2-8 °C. This applies to both plasma and serum (post-clot).
For plasma, a second centrifugation or platelet depletion may be required if plates or cellular contamination interfere with results. Some plasma proteomics workflows use ~2,000-2,500 × g for additional spin.
When removing supernatant, handle gently to avoid disturbing the buffy coat layer. Use clean, non-protein-binding tubes or wells.
Aliquoting, Labeling & Freeze-Storage
After clarification, immediately aliquot into clean, labelled tubes. Use permanent markers or labels that survive low temperatures. Avoid freeze/thaw by minimising number of aliquots needed.
Long term storage should be at −80 °C. Intermediate reagents or short-term storage may use −20 °C or 4 °C, but only if validated for your target proteins.
Transport on dry ice when frozen; if using cold transport for fresh/freshly processed samples, maintain 2-8 °C.
Avoiding Pre-Analytical Variability & Batch Effects
Process case / control samples using identical protocols (same tube types, same centrifuge settings, same personnel if possible). Randomise sample positions in plates to avoid positional bias.
Use batch control or bridge samples when you must run samples across multiple plates or time points. These can help normalise between batches later.
Record metadata: time of draw, time to processing, temperature at each step, collection tube type, sample volume. This helps downstream QC and troubleshooting.
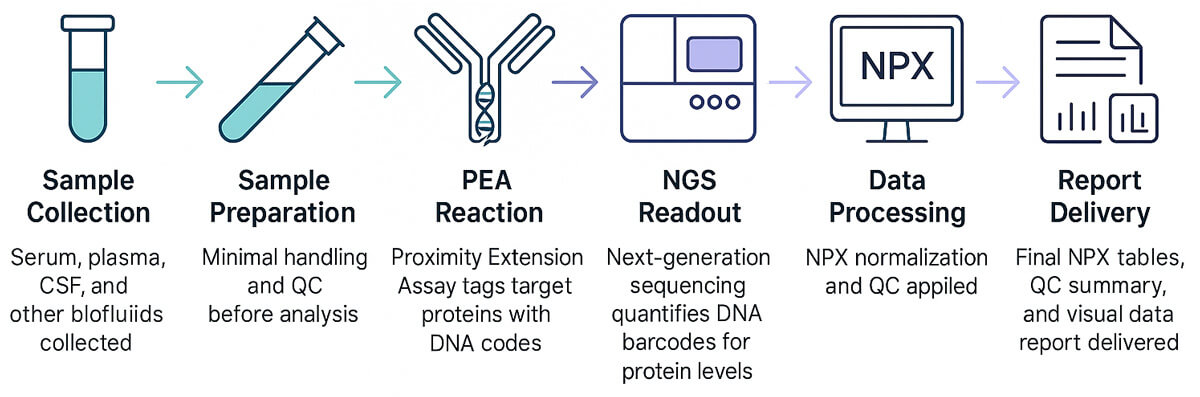
Protocol Workflow: From Sample to Data (Olink Protocol Steps)
This section walks you through each step of a typical Olink proteomics run—from sample prep through to data output. The exact schedule depends on whether you're using qPCR readout (e.g. Target, Flex, Focus panels) or NGS readout (e.g. Explore).
Step 1: Incubation / Antibody Binding (Immunoreaction)
Dilute samples if needed, per panel instructions. For high-plex panels (e.g. Olink Explore), protein concentration or sample matrix might require dilution. Mix sample (e.g. plasma/serum) with the matched antibody pair probes, each conjugated to distinct DNA oligonucleotides. These probes bind to the target protein.
Incubate (often overnight) at ~4°C to allow antibody binding and DNA-oligo proximity. For Explore NGS workflows, this overnight incubation is standard.
Step 2: Proximity Extension & Pre-Amplification
After incubation, oligonucleotides hybridise when the bound antibodies are in "proximity" (i.e. both bound to the same protein target). This leads to a DNA extension event via a DNA polymerase.
Some workflows include a pre-amplification step (especially in qPCR-based panels), to boost signal before the main amplification/detection. This pre-amplification helps with low abundance targets.
Step 3: Amplification & Readout (qPCR or NGS)
qPCR Readout Path (Target / Flex / Focus panels):
Use a thermal cycler with the plate/readout instrument (e.g. Signature Q100) to perform amplification.
Real-time qPCR quantifies the DNA amplicons. The cycle threshold (Ct) values reflect the amount of target protein (after proper normalization).
NGS Readout Path (Explore panels):
After extension, samples are pooled (often plate wise), libraries are prepared with adapters and indices.
Purify libraries (e.g. magnetic beads), QC them (size profile, integrity). Instruments like Bioanalyzer / TapeStation help here.
Sequence on Illumina platforms (NovaSeq, NextSeq, etc.) using recommended flow cells / cycles.
Step 4: Controls & Quality Assurance
Internal controls are included in every sample:
Incubation controls: ensure the antibody binding step works correctly.
Extension control: monitors that the DNA probes are extended properly.
Detection control: verifies the amplification/detection step independent of binding.
Negative controls (buffer only) included to measure background signal / limit of detection.
Inter-plate / batch control samples ("bridge samples" or pooled samples) when multiple plates or batches are involved. Helps correct for plate-to-plate variation.
Step 5: Data Processing & NPX Normalization
For qPCR-based panels: raw Ct (or Cq) data is processed applying QC filters, then normalized (inter- and intra-assay). Olink uses NPX (Normalized Protein eXpression) values to represent relative protein abundance.
For NGS-based readouts: sequencing counts are mapped to probes, with similar normalization and QC steps; includes adapter trimming or index-bias correction.
Identify failed samples or proteins based on control metrics, remove or flag assays below limit of detection or with inconsistent replicate behavior.
Example: Olink Explore 3072 Workflow Snapshot
To illustrate, the Olink Explore 3072 panel with NGS readout performs as follows: sample incubation with probes overnight, ∼6 µL plasma per sample, pooling of amplified material, library prep with magnetic bead purification, QC of library size (∼150 bp peak), and sequencing on NovaSeq or NextSeq platforms. Data is then processed to generate NPX values with high analytical specificity (≈ 99.7%).
Environmental & Operational Best Practices
Controlling your lab environment and operations ensures consistent results with the Olink protocol. Small deviations in temperature, contamination, or workflow scheduling often lead to large variability in protein measurements.
Maintaining a Stable Lab Environment
Place incubators, PCR machines, and readout instruments away from heavy vibration sources (e.g., centrifuges, foot traffic).
Keep temperature fluctuations minimal. For the Olink Explore workflow, the immunoreaction incubation is done overnight at ~4 °C, so room cold chain must be reliable.
Use cold rooms or cooled benches for sample prep and reagent setup if ambient lab temperature is high.
Workflow Organization & Contamination Avoidance
Physically separate pre-amplification and post-amplification zones. Use dedicated pipettes, consumables for each zone.
Clean benches and tools with DNA-/RNase-/protein-decontaminating solutions. Ensuring sealing of plates during incubation or PCR to avoid evaporation.
Regular calibration of pipettes, thermostats, centrifuges. Logs for maintenance help track when performance drops.
Staff Training and Standard Operating Procedures (SOPs)
Ensure all operators are trained in low-volume pipetting, handling of viscous fluids (plasma, serum), and protocol timing.
Document SOPs for each critical step: incubation, extension, amplification. Include timing for thawing, mixing, sealing, centrifugation.
Use checklists. For example: "Plate sealed? Vortexed? Centrifuged? Reagent lot recorded?"
Cost, Throughput, and Scaling for CROs & Biotech Labs
Scaling Olink in your lab demands attention to cost per sample, reagent logistics, and how many samples you can process per run without losing quality.
Cost Drivers & Budgeting
Major cost components: reagents (probe/oligo pairs), consumables (tips, plates, filtration), instrument use (PCR, NGS), cold storage, and labor.
NGS-based workflows (Explore panels) have additional costs: library prep, bead cleanup, sequencer flow cells, indexing kits. These can make per-sample cost higher than qPCR-based panels.
Throughput Considerations
qPCR-based panels (Target, Flex, Focus) generally allow smaller sample batches (e.g., 48 or 96 samples) per run with relatively short turnaround.
High-plex NGS-based panels (Explore 3072, Explore HT etc.) enable hundreds of samples per flow cell, but require more time in library prep, QC, and sequencing. In the Olink Explore workflow, up to 384 samples can be pooled for a panel run.
Scaling & Automation
Consider automated liquid handlers for dilution, probe mixing, and library prep, particularly with high sample numbers. Automation reduces hands-on time and operator variation.
Plan for sufficient cold storage, reagent inventory, lot tracking — delays in reagent availability or inconsistent reagent lots can introduce batch effects.
Use bridge or batch control samples (same sample(s) run across plates or batches) so that data across different runs can be normalized and compared.
Troubleshooting Common Pitfalls in Olink Setup
Even with a solid setup, issues occur. Here are common problems, their probable causes, and how to address them.
Problem: Low or Absent Signal
Possible Causes
- Sample degradation (proteases, freeze-thaw cycles)
- Antibody probes degraded or improperly stored
- Incorrect dilution or too low input material
Fixes
- Validate sample integrity before assay (e.g., measure total protein concentration)
- Use fresh probes; adhere to storage recommendations (cold, avoid freeze-thaw)
- Pilot with higher sample input or less dilution
Problem: High Background or Non-Specific Binding
Possible Causes
Contaminants in reagents or consumables
Cross-plate contamination (e.g. aerosols, improperly sealed wells)
Non-ideal blocking or washing
Fixes
- Replace consumables with low binding, certified clean tips and plates
- Ensure strict separation pre-/post-amplification zones
- Verify that wash steps or buffers are as per Olink protocol
Problem: QC Controls Fail
Possible Causes
- Poor handling of control reagents or calibrators
- Unstable instrument performance (PCR, sequencer)
- Inconsistent incubation or extension conditions across plates or runs
Fixes
- Monitor control performance (Incubation, Detection, Extension controls) every plate
- Implement instrument calibration / maintenance schedule
- Use same personnel, reagents, timing to reduce variation
Conclusion
Setting up Olink proteomics in your lab is an investment—in infrastructure, workflow discipline, and quality control—but when done correctly it delivers powerful returns. You gain high sensitivity for low-abundance proteins, multiplex capability, and consistency in results, even with tiny sample volumes. These advantages help academic researchers, biotech teams, and CROs accelerate discovery, improve reproducibility, and make the most of precious biological materials.
If you're ready to bring Olink panels into your lab—or optimise an existing setup—here are your next steps:
Contact our team to discuss how our Olink proteomics services can support your protein biomarker discovery, mechanism studies, or translational research.
References
- How Olink® technology complements mass spectrometry
- Multiplex high-throughput proteomics with exceptional analytical specificity
- Zhan, H., Cammann, D., Cummings, J.L. et al. Biomarker identification for Alzheimer's disease through integration of comprehensive Mendelian randomization and proteomics data. J Transl Med 23, 278 (2025).
- Yarbro, J.M., Shrestha, H.K., Wang, Z. et al. Proteomic landscape of Alzheimer's disease: emerging technologies, advances and insights (2021 – 2025). Mol Neurodegeneration 20, 83 (2025).
- Dammer, E.B., Ping, L., Duong, D.M. et al. Multi-platform proteomic analysis of Alzheimer's disease cerebrospinal fluid and plasma reveals network biomarkers associated with proteostasis and the matrisome. Alz Res Therapy 14, 174 (2022).
- Wei J, Ni H, Liu W, Xu H, Wang C, Geng G, He Z, Chen G. Biomarkers and therapeutic targets in early Alzheimer's disease: an Olink proteomics study. Front Neurol. 2025 Jul 17;16:1615152. doi: 10.3389/fneur.2025.1615152. PMID: 40746641; PMCID: PMC12310730.