
Overview
Olink Explore's Proximity Extension Assay (PEA) technology has revolutionized proteomics by enabling high-throughput, high-sensitivity measurement of thousands of proteins from minimal sample volumes. However, even with this robust platform, researchers may encounter technical challenges that can compromise data quality and reliability. This comprehensive guide addresses the most common issues—experimental failures, low signal, and cross-reactivity—providing practical solutions to ensure the success of your proteomic studies. By understanding the root causes and implementing systematic troubleshooting, researchers can optimise their Olink experiments and generate high-quality data for biological discovery and clinical translation.
Experimental Failures and Low Signal: Addressing Core Technical Issues
Experimental failures and low signal intensity are among the most frustrating challenges in Olink Explore assays. These issues can manifest as high limits of detection (LOD) ratios, poor reproducibility, or excessive background noise, potentially rendering data unusable. Understanding the multifaceted causes behind these problems is essential for effective resolution.
1. Sample Quality and Integrity
Before applying any normalization technique, it is crucial to understand the distribution properties of your Olink data. Proteomic data often exhibits right-skewness due to the presence of high-abundance proteins, and normalization methods must account for this characteristic. Begin by visualising your data using density plots or histograms to assess the overall distribution. This preliminary step informs the choice of normalization method and helps identify potential outliers that might disproportionately influence the normalization process:
- Sample degradation and improper handling: Implementing strict standard operating procedures for sample collection, processing, and storage is crucial for maintaining sample integrity, as outlined in consensus guidelines for serum and plasma collection that address variables like clotting time and temperature control (Tuck, M. K. et al., 2009).
- Hemolyzed or lipemic samples: Visual inspection of samples is a critical but often overlooked step. Hemolyzed (reddish) or lipemic (milky) samples can interfere with the PEA technology by obstructing antibody binding or generating non-specific signals. These sample abnormalities significantly increase background noise and reduce the assay's effective sensitivity. Establishing pre-analytical quality control checkpoints to identify and exclude compromised samples can prevent these issues from undermining entire experiments.
- Insufficient sample volume: While Olink assays require only 1-3 μL of plasma per measurement, researchers should prepare adequate volume for potential repeats or confirmatory tests. Inadequate volume planning may force undesirable compromises in experimental design or necessitate the exclusion of valuable samples from analysis.
2. Assay Procedure and Technical Execution
- Pipetting inaccuracies and contamination: The PEA technology relies on precise liquid handling for optimal antibody-antigen binding and subsequent DNA amplification steps. Minor pipetting errors can accumulate through the multi-step procedure, significantly impacting results. Regular calibration of pipettes, the use of low-retention tips, and the implementation of liquid-handling automation for large-scale studies can dramatically improve reproducibility.
- Incomplete hybridization or extension: Suboptimal conditions during the proximity extension and amplification steps can lead to inefficient DNA reporter molecule formation. This may result from expired reagents, improper thermal cycling conditions, or contaminants inhibiting enzymatic reactions. Strict adherence to recommended protocols, including the use of fresh reagents and verified equipment, is essential for assay success.
- Plate washing inefficiencies: Incomplete removal of unbound probes during washing steps increases background noise, while excessive washing may elute specifically bound probes. Both scenarios negatively impact the signal-to-noise ratio. Optimising washing parameters, including incubation time, volume, and wash buffer composition, can significantly improve data quality.
3. Detection Sensitivity and Dynamic Range Considerations
- Protein abundance below detection limit: Some biologically important proteins, particularly certain cytokines, hormones, and tissue-specific markers, may naturally occur at concentrations below the assay's detection limit in certain sample types. Researchers should consult Olink's panel specifications to set realistic expectations for their experimental system. For critical low-abundance targets, enrichment strategies or alternative platforms with higher sensitivity for specific analytes may be necessary.
- Suboptimal panel selection: The Olink Explore platform offers specialized panels targeting different biological pathways. Selecting an inappropriate panel for the research question can lead to a high proportion of proteins with expression levels below the quantitation limit. Careful consideration of panel composition, based on biological context and expected protein expression patterns, is crucial for maximising data yield.
Table: Troubleshooting Experimental Failures and Low Signal Issues
| Problem Phenomenon | Potential Root Causes | Recommended Solutions |
| High LOD percentage | Protein abundance below detection limit, sample degradation, improper sample handling | Pre-screen samples for quality; use recommended collection tubes; avoid repeated freeze-thaw cycles; consider sample concentration if appropriate |
| Low signal across all samples | Improper reagent storage or expiration, instrumentation calibration issues, protocol deviations | Verify reagent integrity; calibrate instruments; strictly follow standardized protocols; include positive controls |
| High background noise | Incomplete washing, non-specific antibody binding, sample interference (hemolysis, lipids) | Optimize washing procedures; include blocking steps; pre-clear samples with debris; filter samples if particulate matter present |
| Inconsistent replicates | Pipetting inaccuracies, inadequate mixing, edge effects on plates | Use calibrated pipettes; mix reagents thoroughly; utilize plate seals; randomize sample placement |
| Plate-to-plate variation | Batch effects, reagent lot differences, environmental fluctuations | Include inter-plate controls; use same reagent lots; maintain consistent laboratory conditions |
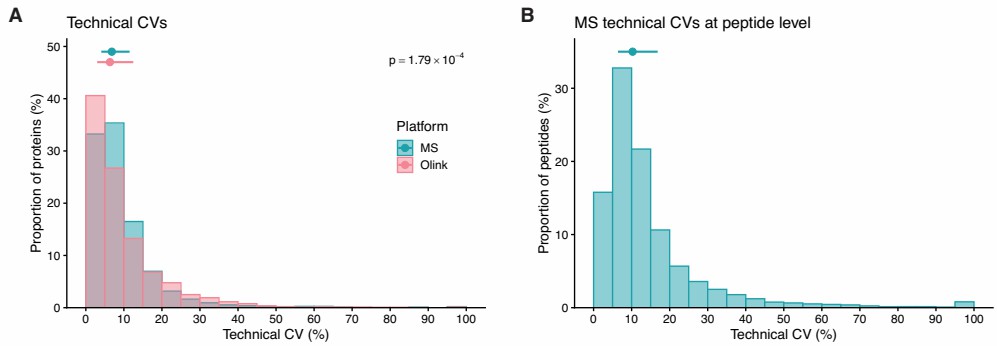 Figure 1: Technical coefficients of variation (CVs) per protein for HiRIEF LC-MS/MS and Olink Explore 3072. (Sissala, N. et al., 2025)
Cross-Reactivity and Specificity Challenges
The multiplex nature of Olink Explore assays, while powerful, introduces the potential for cross-reactivity, as detection reagents may recognise non-target molecules. This can lead to false positive signals, inaccurate quantification, and erroneous biological interpretations. Addressing specificity challenges requires a multifaceted approach spanning experimental design, validation, and data analysis.
1. Antibody Specificity Issues
- Shared epitopes and structural homologs: Antibody pairs used in PEA assays may exhibit affinity for structurally similar proteins or shared epitopes within protein families. This is particularly problematic when measuring proteins with high sequence homology, such as isoforms or members of signaling cascades. While Olink rigorously validates antibody specificity, unusual sample types or specific biological contexts may reveal unanticipated cross-reactivities.
- Antibody polymorphisms and genetic variants: Genetic variations between populations can affect antibody binding sites, potentially leading to differential recognition of target proteins across individuals. This issue may manifest as inconsistent results in diverse cohorts or unexpected correlations with genetic backgrounds. Confirming findings through orthogonal methods or utilizing genetic data to identify potential confounding variants can mitigate this risk.
2. Sample-Derived Interferences
- Heterophilic antibodies and autoantibodies: Human serum may contain endogenous antibodies that recognize animal immunoglobulin fragments used in assay reagents, leading to bridge formation between detection antibodies without the target protein present. This results in falsely elevated signals that can be mistaken for true biological findings. The inclusion of specific blocking reagents or animal sera in the assay buffer can minimise these effects by occupying nonspecific binding sites.
- Matrix effects and protein complexes: The complex composition of biological samples, especially plasma and serum, can influence antibody binding kinetics through non-specific interactions or by sequestering target proteins in complexes. The use of appropriate diluents and sample dilution protocols helps mitigate matrix effects, while dissociation steps may be necessary to access bound targets in protein complexes.
3. Analytical Approaches for Specificity Confirmation
- Orthogonal validation techniques: Findings from Olink Explore assays, particularly for novel or unexpected results, should be confirmed using orthogonal methods based on different detection principles. Techniques such as ELISA, Western blotting, or targeted mass spectrometry provide independent verification and help rule out platform-specific artifacts. This step is especially critical for biomarker candidates advancing toward clinical applications.
- Genetic correlation analyses: Protein quantitative trait loci (pQTL) mapping, particularly cis-pQTLs, offers strong evidence for assay specificity by linking genetic variants to protein abundance, as demonstrated in genomic studies of the plasma proteome (Sun, B. B. et al., 2018).
Table: Addressing Cross-Reactivity and Specificity Challenges
| Specificity Issue | Identification Methods | Resolution Strategies |
| Antibody cross-reactivity | Incongruent results with orthogonal methods; lack of genetic correlation; inconsistent expression patterns | Use validated panels; incorporate genetic data; employ alternative detection methods for critical targets |
| Heterophilic antibody interference | Unusually high signals for multiple analytes; inconsistency with clinical picture; dilution tests | Include blocking reagents; use sample diluents with animal Ig; employ specialized heterophilic antibody blocking tubes |
| Matrix effects | Spike-recovery experiments show poor recovery; dilution linearity issues | Optimize sample dilution; use matrix-matched calibrators; employ sample purification or enrichment techniques |
| Protein complex interference | Discrepancies between different measurement platforms; inconsistent biological interpretations | Incorporate dissociation steps; validate with alternative epitope-targeting antibodies; use cross-linking methods |
| Structural homolog interference | Unexpectedly high correlation between homologous proteins; absence of genetic association | Target different protein domains; use orthogonal verification; employ selective enrichment techniques |
Batch Effects and Reproducibility Concerns
Batch effects pose a critical challenge in Olink Explore experiments, particularly in large-scale studies spanning multiple plates or time points. These technical variations can introduce systematic biases that obscure biological signals, compromise data quality, and potentially lead to false conclusions. Implementing strategic approaches to minimise, detect, and correct for batch effects is essential for generating reliable, reproducible protein data.
1. Sources of Batch Variation
- Reagent and plate lot differences: Variations in manufacturing batches of key reagents, antibodies, or microplates can introduce systematic shifts in protein measurements. While Olink maintains rigorous quality control standards, subtle differences between lots are inevitable. When possible, using reagents from a single lot throughout an entire study minimises this source of variation. For extended studies requiring multiple lots, careful experimental design that distributes biological groups across lots facilitates statistical correction of lot effects.
- Temporal and operator influences: Experiments conducted over extended periods may exhibit drifts in measurements due to changes in environmental conditions, reagent stability, or subtle modifications in technique between operators. These temporal effects can confound biological comparisons, especially in longitudinal studies. Randomising sample processing across time points and implementing standardisation protocols ensure that technical variability does not confound biological factors of interest.
- Instrument-based variability: Different instruments or performance drifts in a single instrument over time can contribute to batch effects. Regular calibration and maintenance of laboratory equipment, including liquid handlers, thermocyclers, and reading instruments, help maintain consistency. Additionally, tracking which samples were processed on which instruments provides crucial metadata for downstream batch effect correction.
2. Experimental Design Strategies for Batch Effect Minimization
- Sample randomization and blocking: Perhaps the most powerful approach to managing batch effects is through careful experimental design. Rather than processing all samples from a single experimental group together, researchers should randomly distribute them across plates and process batches. This approach ensures that technical variability is distributed independently of biological factors, preventing confounding. Implementing a balanced block design, where each batch contains representative samples from all experimental groups, enables statistical methods to separate technical noise from biological signal effectively.
- Reference samples and QC materials: Incorporating well-characterized reference samples or quality control materials in each processing batch provides a direct means to monitor and correct for technical variation. Pooled plasma samples, commercial quality control materials, or internal standard proteins can be included as anchors for normalization. The consistency of measurements for these reference materials across batches serves as a quality metric and provides the basis for statistical adjustment methods.
3. Statistical Approaches for Batch Effect Correction
- Normalization methods: Olink's proprietary normalization algorithm generates Normalized Protein eXpression (NPX) values, which facilitate comparison across samples and batches. The NPX system employs internal controls and extension controls to adjust for technical variability while maintaining the relative nature of the data. Understanding that NPX represents a log2-scale relative measurement is crucial for appropriate interpretation and avoids the pitfall of treating it as an absolute quantitative value.
- Post-hoc batch effect adjustment: Despite optimal experimental design, residual batch effects often require statistical correction during data analysis. Methods such as Combat, Remove Unwanted Variation (RUV), or surrogate variable analysis (SVA) can effectively adjust for batch effects while preserving biological signals. However, these methods require careful implementation to avoid over-correction and removal of genuine biological variability. Including batch metadata in statistical models provides a more straightforward approach to batch adjustment.
Table: Strategies to Mitigate Batch Effects and Improve Reproducibility
| Batch Effect Source | Preventive Measures | Corrective Approaches |
| Plate-to-plate variation | Randomize samples across plates; include inter-plate controls; use the same plate lots | Normalize using control samples; apply batch correction algorithms; include plate as covariate in models |
| Reagent lot differences | Use a single lot for the entire study; document lot numbers meticulously; plan purchases strategically | Include lot information in statistical models; bridge lots with control samples; validate critical findings across lots |
| Operator variability | Standardize protocols; train all operators; implement competency assessments | Record operator information; include as covariate in analysis; blind operators to sample groups |
| Temporal drift | Complete studies in the shortest feasible time; randomize processing dates for sample groups | Include processing date in statistical models; use time-adjusted algorithms; validate temporal stability of key findings |
| Instrument variability | Regular maintenance and calibration; use the same instruments for the entire study | Track instrument usage; include as a factor in analysis; validate across instruments if necessary |
Systematic Troubleshooting Workflow and Best Practices
Implementing a systematic approach to troubleshooting Olink Explore assays significantly enhances efficiency and success rates. This section outlines a step-by-step framework for identifying, investigating, and resolving common technical challenges, emphasizing proactive quality management rather than reactive problem-solving.
1. Pre-Experimental Planning and Quality Assessment
- Sample quality assessment: Prior to initiating Olink experiments, conduct preliminary quality assessments on a subset of samples. Simple metrics such as protein concentration, hemoglobin content (for hemolysis), and visual inspection for turbidity (indicating lipemia) can identify samples that may require special handling or exclusion. Establishing predetermined quality thresholds ensures consistent sample evaluation and prevents the unnecessary consumption of valuable reagents on compromised samples.
- Experimental design optimization: Adequate sample size and randomization are essential to minimize confounding, as emphasized in proteomics guidelines that advocate for power analysis and replication to ensure reliable biomarker discovery (Wilkins, M. R. et al., 2006).
- Pilot studies: For large or complex studies, conducting a small-scale pilot experiment can identify potential issues before committing extensive resources. Pilot studies assessing technical variability, sample quality effects, and reproducibility provide valuable data for optimizing protocols and estimating statistical power for the full-scale experiment.
2. Quality Control During Assay Execution
- Internal controls and standards: Meticulously track the performance of internal controls included in each assay run. Significant deviations in control values may indicate technical problems requiring investigation. Establish quality control charts for control samples to monitor assay performance over time and identify trends suggesting reagent degradation or instrument drift.
- Process documentation: Maintain detailed records of all experimental procedures, including reagent lot numbers, instrument identifiers, processing times, and any deviations from standard protocols. This documentation is essential for troubleshooting specific runs and identifying patterns in assay performance associated with particular reagents, instruments, or conditions.
- Real-time monitoring: Implement real-time quality metrics during assay execution rather than waiting until completion to assess quality. Monitoring parameters such as amplification curves, signal intensities, and background levels as the experiment progresses allows for early detection of issues and potentially enables corrective action before assay completion.
3. Post-Experimental Data Quality Assessment
- Comprehensive QC metrics: After data generation, conduct systematic quality assessment using multiple metrics, including signal-to-noise ratios, limit of detection percentages, sample-wise and protein-wise coefficients of variation, and association with technical covariates. Modern bioinformatic tools, such as Olink NPX Software and Olink Analyze R package facilitate standardized quality assessment and flag potential quality issues.
- Batch effect evaluation: Assess the magnitude and impact of batch effects using principal component analysis, correlation heatmaps, and visualization tools to identify patterns associated with technical factors. Strong clustering by processing date, plate, or operator indicates significant batch effects requiring correction before biological interpretation.
- Biological validation: Confirm that results align with established biological knowledge where applicable. For example, proteins with well-established expression patterns (e.g., gender-specific markers) should show expected distributions. Unexpected findings should be rigorously validated before biological interpretation, using orthogonal methods when possible.
Table: Systematic Troubleshooting Workflow for Olink Explore Assays
| Stage | Key Activities | Quality Indicators |
| Pre-analysis planning | Sample quality screening; panel selection; power calculation; randomization scheme | Sample quality metrics meet thresholds; appropriate panel selected; statistical power >80% |
| Assay execution | Protocol adherence; control performance; environmental monitoring; documentation | Controls within expected range; amplification curves optimal; technical metadata recorded |
| Initial data QC | NPX distribution assessment; LOD calculation; sample-wise CV analysis; outlier detection | >80% samples pass QC; LOD <20% for majority of proteins; CVs <15% for technical replicates |
| Batch effect assessment | PCA visualization; correlation analysis; technical covariate association testing | Biological groups cluster rather than technical batches; minimal association with technical factors |
| Biological validation | Comparison with expected expression patterns; orthogonal confirmation; genetic correlation | Known biomarkers show expected patterns; genetic correlations support specificity; orthogonal methods confirm key findings |
Conclusion
Proteomic profiling using Olink Explore technology offers unprecedented insights into biological systems and disease processes when performed optimally. While technical challenges, including experimental failures, low signals, cross-reactivity, and batch effects, can compromise data quality, the systematic troubleshooting approaches outlined in this guide provide a roadmap for identifying, resolving, and preventing these issues. The cornerstone of success lies in meticulous attention to sample quality, rigorous experimental design, consistent execution, and comprehensive data quality assessment. By adopting these best practices, researchers can maximize the value of their Olink Explore data, accelerating the discovery of robust biological insights and clinically applicable biomarkers.
FAQs
1. What are the primary causes of low signal or experimental failure in Olink Explore assays?
Low signal or failure often stems from issues prior to the assay itself. Key culprits include:
- Sample Degradation: Improper handling or multiple freeze-thaw cycles of plasma/serum samples can degrade proteins, particularly affecting low-abundance analytes.
- Sample Quality: Hemolyzed (red) or lipemic (milky) samples can cause significant interference, leading to high background noise or non-specific signals.
- Pipetting Inaccuracies: The multi-step PEA protocol is sensitive to pipetting errors, which can compound and lead to poor reproducibility.
- Suboptimal Assay Conditions: Inefficient hybridization/extension during the DNA amplification step, often due to expired reagents or incorrect thermal cycling, can cause low signal.
2. How should I handle proteins where many measurements are below the Limit of Detection (LOD)?
The approach depends on the proportion of samples below LOD:
- Low LOD Proportion: If only a small percentage of samples are below LOD for a specific protein, a common practice is to impute the values using half the LOD value to minimize statistical bias.
- High LOD Proportion: If a high percentage (e.g., >20%) of measurements for a protein are below LOD, it is often recommended to exclude that protein from the analysis. However, for critical biomarkers, it may be retained for qualitative assessment, as excluding all LOD data might mask biologically significant findings, especially if a protein is highly expressed in one group but undetectable in another.
3. What can cause falsely elevated signals in my data?
A common cause is the presence of heterophilic antibodies or autoantibodies in human serum. These endogenous antibodies can bridge animal-derived immunoglobulin-based detection reagents even when the target protein is absent. This can be mitigated by using blocking reagents included in the assay buffer.
4. What is the best way to minimize batch effects in my experimental design?
- Randomization: Do not process all samples from one experimental group together. Instead, randomize sample placement across plates and processing batches to ensure technical variability is not confounded with biological factors.
- Reference Samples: Include well-characterized, identical biological bridging samples (e.g., pooled plasma) on every plate. These serve as anchors for normalizing data across batches.
- Standardized Protocols: Use the same reagent lots and calibrated instruments throughout the study, and maintain detailed records of all procedures.
5. What are the key steps in the Olink data analysis workflow after obtaining NPX values?
The workflow typically involves three stages:
(1) Pre-processing: Quality control (removing proteins with high LOD%), missing value imputation (e.g., median or KNN imputation), and batch effect correction (e.g., using limma::removeBatchEffect).
(2) Differential Analysis: Statistical testing (t-test, ANOVA) with multiple-testing correction (FDR) and calculation of fold changes.
(3) Biological Interpretation: Functional enrichment analysis (using tools like clusterProfiler for KEGG/GO pathways), clustering, and visualisation (PCA, heatmaps).
Related Reading
For deeper insights, we recommend exploring the following related guides:
How to Set Up Olink Proteomics for Your Lab: A Step-by-Step Guide — An overview of how to systematically implement Olink Proteomics in a research laboratory through strategic planning, robust experimental execution, and standardized data analysis to ensure high-quality protein biomarker discovery.
A Deep Dive into the Olink Explore 3072 Platform: Expanding the Boundaries of Proteomic Discovery — A vision of how Olink's scalable, high-throughput proteomics is accelerating biomarker discovery, reshaping drug development, and unlocking the functional proteome through ultra-sensitive, large-scale studies of complex biological samples.
References
- Tuck, M. K., Chan, D. W., Chia, D., Godwin, A. K., Grizzle, W. E., Krueger, K. E., et al. (2009). Standard Operating Procedures for Serum and Plasma Collection: Early Detection Research Network Consensus Statement Standard Operating Procedure Integration Working Group. Journal of Proteome Research, 8(1), 113-117.
- Sissala, N., Babačić, H., Leo, I.R. et al. Comparative evaluation of Olink Explore 3072 and mass spectrometry with peptide fractionation for plasma proteomics. Commun Chem 8, 327 (2025).
- Sun, B. B., Maranville, J. C., Peters, J. E., Stacey, D., Staley, J. R., Blackshaw, J., et al. (2018). Genomic atlas of the human plasma proteome. Nature, 558(7708), 73-79.
- Wilkins, M. R., Appel, R. D., Van Eyk, J. E., Chung, M. C. M., Görg, A., Hecker, M., et al. (2006). Guidelines for the next 10 years of proteomics. PROTEOMICS, 6(1), 4-8.


