
Introduction: Cytokines and the Challenge of Inflammation Research
Inflammation plays a central role in many research fields—from immunology and toxicology to drug development and biomarker discovery. Immune-mediated inflammatory diseases (IMIDs), such as rheumatoid arthritis, psoriasis, and inflammatory bowel disease, are increasing in incidence worldwide.
Despite their importance, cytokine measurement remains a technical bottleneck. Many cytokines circulate at extremely low concentrations (picograms per millilitre or lower), degrade quickly after sample collection, or produce transient signals that are hard to capture.
These limitations create problems in three specific areas:
- Sample volume constraints: Academic labs or small animal studies often have limited sample amounts. Traditional methods may require large volumes, which are impractical when sample is precious.
- Sensitivity and specificity: Detecting low‐abundance cytokines amidst background noise demands high sensitivity. Cross-reactivity and antibody performance can also impair specificity.
- Reproducibility and consistency: Variability between batches, handling conditions, or assay platforms can lead to inconsistent results. Such variability undermines comparative studies and slows down translational research.
The Olink Cytokine Panel responds to many of these challenges. It uses Proximity Extension Assay (PEA) technology, which allows for high multiplexing with small sample volumes, excellent sensitivity, and tight quality controls. In the following sections, we'll explore how this technology helps researchers accelerate inflammation science without sacrificing rigor.
Why Cytokine Profiling Matters in Modern Research
Cytokines serve as critical messengers in immune signalling—tiny proteins that orchestrate inflammation, tissue damage, and repair. Understanding their levels, timing, and interactions gives researchers a high-resolution view of immune responses.
Here are the main reasons cytokine profiling matters today:
Key Roles of Cytokines in Research Contexts
- Pro-inflammatory cytokines (e.g. TNF-α, IL-6) drive responses to infection, injury, or stress. Anti-inflammatory ones (e.g. IL-10, TGF-β) temper those responses. Disruptions in balance often lead to chronic inflammation or tissue damage.
- Cytokines respond quickly to stimuli. Their dynamics (when they rise, how long they persist) often reveal mechanisms that static measurements miss.
- They guide how other cell types activate, migrate, or behave. For example, chemokines recruit immune cells; interleukins modulate differentiation. These effects are central in fields like immunology, neurobiology, and cancer biology.
Limitations of Single-Cytokine or Low-Parameter Assays
- Many older assays target one cytokine at a time (e.g. ELISA). That's time-consuming and may miss network effects.
- Low sample volumes or complex matrices (serum, plasma, tissue interstitial fluid) often contain low-abundance cytokines. Singleplex approaches may not have enough sensitivity.
- Cross-reactivity, background noise, and lack of standardization across platforms make comparisons across experiments difficult.
How Multiplex Cytokine Profiling Improves Research Outcomes
- Multiplex panels let you measure many cytokines in a single run. That enables pattern discovery: pro- vs. anti-inflammatory signatures, or kinetic shifts over time.
- Smaller sample requirements allow repeated sampling, longitudinal studies, or work with limited volume sources (e.g., small animals, rare patient cohorts).
- Better throughput and consistency reduce variability between labs and increase reproducibility. This supports confident conclusions and more effective hypothesis testing.
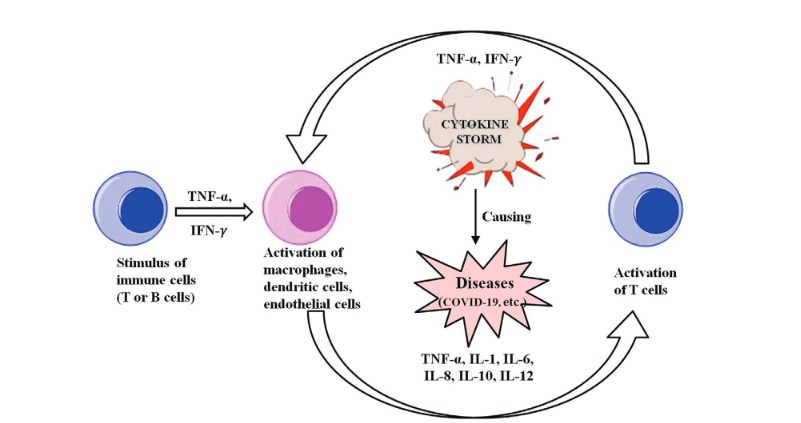 Figure 1. Proposed mechanism of cytokine release syndrome.
The Olink Cytokine Panel: Technology and Workflow
The Olink Cytokine Panel operates via Proximity Extension Assay (PEA) technology—a dual-antibody, DNA-coupled immunoassay—offering high multiplexing, exceptional specificity, and very low sample volume requirements.
How PEA Works: Key Steps
Dual Antibody Binding
Two matched antibodies, each linked to a unique DNA oligonucleotide, bind the same target cytokine. Only when both antibodies bind in proximity does the assay proceed.
Proximity Extension & DNA Barcode Formation
The oligonucleotides hybridise and are extended by DNA polymerase. The resulting DNA barcode is unique to that cytokine.
Amplification & Detection
The DNA barcodes are amplified using methods like PCR or next-generation sequencing (NGS) readout (depending on the specific Olink panel). Quantification of these DNA products yields relative or absolute measures of cytokine abundance.
Normalization & Quality Controls
Internal controls handle variation in antibody binding, amplification efficiency, and sample input. Readouts are converted to normalized units (NPX) or, in panels with calibration standards, to absolute concentration units.
Sample Types, Volume, and Pre-Analytical Handling
Sample Matrices: Serum and plasma are fully validated. Other biological fluids (cell culture supernatant, tissue lysates, biofluids) are often usable but may require extra validation.
Sample Volume: Many cytokine panels, including the Olink Target 48 Cytokine Panel, require as little as 1 µL of sample (serum or plasma) for a full run of multiple cytokines.
Pre-analytical Best Practices:
- Collect samples using consistent tube types and anticoagulants.
- Process quickly (spin down cells or remove clot), keep at cold temperatures, snap-freeze or store at −80 °C.
- Avoid repeated freeze-thaws; ensure sample integrity prior to running assay.
Workflow Overview in a Typical Lab or Service Setting
| Step | Description |
| Study design & panel selection | Choose panel size (e.g. Target 48), cytokine list, sample type, whether absolute quantification is needed. |
| Sample collection & QC | Collect, handle, store samples per pre-analytic standards; ensure sample integrity. |
| Assay setup | Antibody probe incubation (antibodies + oligos binding cytokines), extension reaction, prepare DNA barcodes. |
| Amplification & readout | PCR or NGS readout; depending on the panel, may use Olink's Signature Q100 or external qPCR/NGS systems. |
| Data normalisation & QC | Use internal and external controls; remove or flag outliers; convert raw signals to NPX or calibrated concentration. |
| Data output & analysis | Export data; integrate into downstream statistical or bioinformatics workflows. Patterns of expression, correlation with variables of interest. |
Performance Metrics: Sensitivity, Specificity, Dynamic Range
The PEA technology achieves exceptional specificity—cross-reactivity of assays is extremely low due to the dual antibody + DNA barcode design.
Sensitivity often reaches low-picogram per millilitre levels, enabling detection of rare or weakly circulating cytokines.
The dynamic range spans multiple orders of magnitude; this allows detection of both high-abundance and low-abundance targets in the same run.
Advantages of Olink Cytokine Panel in Inflammation Studies
When you're designing inflammation‐related experiments, the Olink Cytokine Panel brings several advantages that often make it the preferred choice in non-clinical research settings. Below are the most compelling strengths, illustrated with data and tied to situations you'll likely face in the lab or in project planning.
High Sensitivity and Minimal Sample Volume
Detecting cytokines reliably depends on being able to pick up very low concentrations. The Olink PEA (Proximity Extension Assay) format achieves exactly that—often down to low picograms per millilitre—with as little as 1 µL of serum or plasma. This is especially useful for:
- Longitudinal studies (where repeated sampling reduces sample reserves each time).
- Small-animal studies or rare samples (e.g. paediatric, or limited volume from animal models).
If you want more guidance on selecting which Olink panel fits your volume constraints and sensitivity needs, you may want to check our article How to Choose the Right Olink Panel for Your Study which walks through trade-offs among sensitivity, sample requirements, and analyte coverage.
Broad, Biologically Meaningful Coverage
The cytokine panel covers a wide spectrum of immune and inflammatory mediators—pro-inflammatory, anti-inflammatory, chemokines, interleukins etc. That breadth lets you:
- Observe interaction effects (e.g. see when IL-10 rises after a pro-inflammatory burst).
- Capture unexpected players in signalling networks.
- Compare across pathways without switching assay platforms.
This aligns with content in our "Using Olink's Cytokine Panels for Immune System Research" guide, where we discuss how profiling panels (versus single analyte assays) can reveal pathway cross‐talks that inform hypotheses.
Exceptionally Low Background & Cross-Reactivity
A common issue with multiplex immunoassays is cross-reactivity or background signal, especially when many antibodies are deployed. The dual-antibody + DNA barcode design of PEA reduces false positives and enhances specificity. A comparative white paper showed that Olink's Target 48 Cytokine Panel maintained strong linearity and low background even when overlapping targets were run on multiple platforms.
Wide Dynamic Range
Inflammatory responses often span a huge range: some cytokines shoot up quickly, others persist at low but biologically active levels. Olink's panels are designed to measure high-abundance and low-abundance analytes in the same run without saturation. This makes it possible to track temporal curves or dose-response relationships without having to split into different assays. For more on interpreting data across a wide range, our "Understanding Olink's Data Analysis Process" article offers good practical tips.
Reproducibility Across Batches and Matrices
Consistency matters: you want confidence that results from different days, operators, or sample types are comparable. Recent studies show that in the Olink inflammation panel, measurement precision (intra-assay and inter-assay) remains strong, even with low-volume samples. Also, validation in multiple sample matrices (e.g. plasma, serum, CSF) shows that the panel performs reliably under different conditions.
Flexible Quantification & Streamlined Workflow
Depending on the panel, you may get relative quantification (NPX) for better comparisons across samples, and some panels offer absolute quantification if needed. The workflow is streamlined enough that labs familiar with immunoassays can adopt it quickly. If you're deciding between panels or need help designing sample QC or analysis pipelines, our article Introduction to Olink Proteomics is a helpful reference.
Case Applications in Inflammation Research
Seeing how the Olink Cytokine Panel performs in real studies helps clarify its value. Below are several case applications showing how researchers have used the Olink panel for inflammation-related questions. These examples illustrate how to apply Olink in your own research, and highlight insights tied to panel choice, data analysis strategy, and biological interpretation.
Case 1: Monitoring Inflammatory Mediators in Cerebrospinal Fluid (CSF)
A recent protocol used the Olink Target 48 Cytokine Panel to measure inflammatory proteins in CSF using only 1 µL of sample. The goal: to track low-level inflammatory changes in neurological contexts. The workflow involved antibody-linked oligonucleotides, extension, amplification via microfluidic qPCR, yielding precise pg/mL quantification for a wide array of cytokines. (Fabricio Zambom-Ferraresi et al., 2025. DOI: 10.1007/978-1-0716-4462-1_5)
What makes this relevant:
- It demonstrates ability of Olink Cytokine Panel to work in biofluids with low protein content.
- Sample volume is minimal, yet sensitivity high.
- Useful for neuroinflammation, where CSF is more informative than blood in some respects.
Case 2: Tracking 48 Plasma Inflammation-Related Proteins in Clinical Trial Samples
In the STELLAR II study, researchers randomly selected 20 plasma samples to profile 48 inflammation-related proteins using an Olink Inflammation Panel. The authors identified differentially expressed proteins among patient subgroups, using tools like edgeR for analysis. This revealed novel protein signatures connected to inflammation progression in plasma. (Analyzing the Changes of Inflammation-Related Cytokines…, 2024. https://doi.org/10.1016/j.ijrobp.2024.07.997)
Key takeaways:
- Longitudinal/trial sample settings can benefit from Olink's reproducibility and multiplexing.
- Advanced statistical methods (e.g. edgeR) allow detection of subtle, significant effects in relatively small sample sets.
- Supports use of the panel in translational R&D and biomarker discovery.
Case 3: Differential Serum Protein Profiling in Kawasaki Disease (KD)
A study used the Olink Target 96 Inflammation Panel to compare serum proteins between Kawasaki Disease (KD) patients and febrile control (FC) children. They identified 25 differentially expressed proteins; five biomarkers (including IL-17A) showed high performance distinguishing KD vs FC, especially early in disease onset. (Tu et al., 2025. DOI: 10.2147/JIR.S506154)
Why this matters:
- Shows utility of Olink panels for acute inflammatory settings and early-stage biomarker discovery.
- Demonstrates combining clinical metadata (time since fever onset etc.) with proteomic data adds power.
- Emphasizes panel flexibility: using a larger inflammation panel, not just a focused subset.
How you might choose between Target-48 vs Target-96 panels depending on breadth vs depth.
Case 4: Comparative Platform Performance in Multiplex Inflammation Studies
The white paper Multiplex analysis of inflammatory proteins: A comparative study across multiple platforms directly compared the Olink Target 48 Cytokine Panel with MSD and Luminex. It showed that Olink requires far less sample volume (1 µL vs ~50-150 µL), delivers comparable or superior sensitivity, dynamic range, and lower background for overlapping analytes.
Application lessons:
If your samples are limited or rare (e.g. small animal, rare human cohort), Olink is often the feasible option.
Choosing assay platforms impacts cost, throughput, and data quality.
This case reinforces why having published comparative validation is useful when justifying platform choice to stakeholders or funders.
Practical Insights from These Studies
- Panel selection matters: Broad panels (Target-96) are excellent for discovery; more focused panels (Target-48) balance sensitivity and cost.
- Sample type and volume: Low volumes and challenging biofluids (CSF, infant/animal serum) can be successfully profiled.
- Data analysis strategy: Use appropriate normalization (NPX or absolute if available), account for batch effects, replicate measurements, and use statistical models tuned to multi-cytokine data.
Data Analysis and Interpretation
Once you've collected your cytokine panel data using Olink, interpreting the results correctly is essential. This section walks you through data preprocessing, normalization, handling technical variation, and turning NPX or calibrated values into insights. If you want greater technical detail—or code snippets—check out Understanding Olink's Data Analysis Process: From Raw Data to Insights .
Data Pre-Processing and QC (Quality Control)
Reliable analysis begins with rigorous quality control:
- Limit of Detection (LOD) & Limit of Quantification (LOQ): Remove or flag analyte measurements falling below LOD. Knowing LOQ helps interpret absolute concentration values if calibrated standards were used.
- Assay & Sample Controls: Internal controls in Olink assess three key steps: antibody binding, oligo extension, and detection/amplification. Unusual values in these controls (incubation, extension, detection) indicate technical issues. (based on Olink documentation)
- Replicates & CV Metrics: Use technical replicates (duplicate or triplicate internal sample controls) to compute intra-assay and inter-assay coefficients of variation (CV). High CV can signal low assay reliability for specific analytes.
Normalization: NPX Units, Absolute Quantification, and Bridging
- NPX (Normalized Protein eXpression) values are Olink's relative quantification metric, often log2-scaled. They allow comparison across samples within the same run or project. However, since NPX is relative, combining data across plates, batches or over time requires bridging or batch correction.
- Absolute Quantification vs Relative: Some panels (or specific study setups) include calibration standards so analyte concentrations can be expressed in pg/mL or similar units. Use absolute values when needed for biological interpretation (e.g., comparing to benchmark values in literature) but ensure calibration curves and LOQ are valid.
- Bridging Normalization & Cross-Project Integration: When two or more NPX datasets (from separate plates, batches, or product versions) need comparison, you should use shared or overlapping samples (bridge samples) to align the datasets. This allows adjustment of assay-specific differences so that combined data is comparable. Examples, tools, and methods are implemented in the OlinkAnalyze package (e.g. functions like olink_normalization_bridge, olink_normalization_n) .
Handling Batch Effects & Other Technical Variation
- Technical variation (batch effects) can mask true biological signals. Here are best practices and methods:
- Design for Minimizing Batch Effects: Randomize sample assignment to plates, include quality/control samples on all plates, maintain consistent reagents and handling, process batches in parallel if possible.
- Bridging Controls: These are the same biological samples included in multiple plates. Methods like the recently published BAMBOO (Batch Adjustments using Bridging cOntrOls) have been developed to correct for different types of batch effects (protein-specific, sample-specific, plate-wide). In tests, it outperformed methods like ComBat and median centering in reducing false discoveries when using ~10–12 bridging control samples per plate.
- Statistical Tools:
- Mixed-effects models to account for fixed effects (treatments) and random effects (batch or plate).
- Methods like ComBat, median centering, MOD (median of difference), or more recent tools specific to PEA data.
- Use specialized R tools (e.g. the OlinkAnalyze package) for normalization and NPX bridging.
Downstream Analysis & Biological Interpretation
After normalization and QC, move into interpreting cytokine data:
- Differential Expression / Fold Change Analysis: Compare groups (control vs treatment) using suitable statistical tests. Ensure you correct for multiple hypothesis testing because many analytes are involved.
- Temporal and Kinetic Profiles: In inflammation studies, cytokine levels often change rapidly. If samples are taken over time, plotting dynamics helps: e.g., early peaks in IL-6 or TNF-α followed by resolution via IL-10.
- Pathway or Network Analysis: Examine which cytokines group together (e.g., pro- vs anti-inflammatory), and integrate with existing knowledge of immune signalling pathways.
- Visualization & Reporting: Use heatmaps, PCA or UMAP, volcano plots. Provide context: concentration units if absolute, fold changes, confidence intervals. Transparently report QC metrics, detection rates (what % of samples had measurable cytokine), and any excluded analytes.
How Olink Cytokine Panels Accelerate Translational Research
Translational research often sits between discovery and application: the goal is to turn molecular insights into something usable in drug development, biomarkers, or pre-clinical validation. The Olink Cytokine Panel enables speed, reliability, and insight in this area by reducing technical friction and enhancing interpretability.
Bridging Preclinical Models and Human Biology
The Olink Target 48 Mouse Cytokine Panel lets researchers monitor serum or plasma cytokines in mouse models using just 1 µL of sample. That low sample demand makes longitudinal studies and repeated measures feasible without excessively large cohorts or sacrifice of animals.
Because many cytokines have conserved roles across species, panels validated in mice can help map mechanistic pathways that later are tested in human studies. The Olink documentation emphasizes that many mouse-human targets are shared, so comparative biology is facilitated.
Enhancing Biomarker Discovery & Validation
In a recent non-clinical human study, investigators used a 92-plex Olink panel to profile plasma cytokines pre- and post-neoadjuvant PD-1 blockade in head and neck squamous cell carcinoma (HNSCC). This multi-omics approach combined immune cell profiling (CyTOF) with soluble cytokine biomarkers to build a predictive model (AUC ~ 0.92). Although this is close to clinical settings, its design and utility are firmly non-therapeutic, supporting translational research in a discovery/validation framework. (Zhang et al., 2025. DOI: 10.1186/s12967-025-06770-2)
Such studies show how Olink panels allow early-stage identification of candidate biomarkers, which then can be tested in larger cohorts or orthogonal platforms before moving to human validation studies.
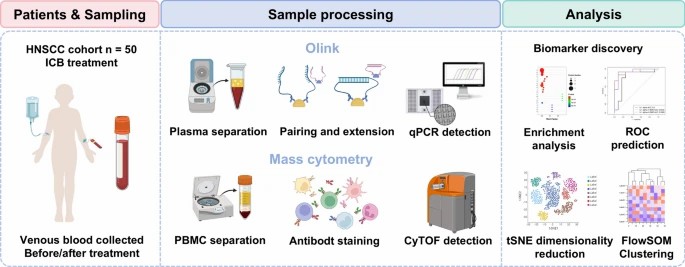 Figure 2. Blood immune Cytokine profiling
Reducing Time & Cost in Translational Pipelines
- Because Olink panels allow multiplexed detection (many cytokines per run) and use very small sample volumes, labs save not only on sample collection but also on time, reagents, and downstream processing. The fewer handling steps and smaller volumes reduce variability.
- The validated mouse panel (T48) reduces the need for large peripheral blood draws or pooling, accelerating projects and reducing ethical constraints.
Enabling Longitudinal & Mechanistic Studies
- Translational success depends on detecting how cytokine responses change over time—after treatment, in disease progression, or during perturbation. Olink's low volume requirement and high reproducibility make frequent sampling feasible without major logistic hurdles.
- The mouse T48 panel has already enabled multiple time-point assays in individual mice, opening windows into temporal kinetics of inflammatory signalling.
Frequently Asked Questions about Olink Cytokine Panel
What is the minimum sample volume required?
The Olink Target 48 Cytokine Panel needs only 1 µL of serum or plasma to measure up to 45 immune-related proteins. That makes it ideal for studies with very limited sample volumes (e.g. pediatric, small animals, CSF).
Which sample types (matrices) are validated? Can I use other biofluids?
Serum and plasma are fully validated. The panel is also used successfully with cerebrospinal fluid (CSF) (in neurological inflammation research) and other compatible matrices. However, performance (like sensitivity or background) may vary in non-standard matrices, so you'll want to check validation reports for that matrix.
Is the quantification relative (NPX) or absolute (pg/mL)?
Both modes are supported. The panel can deliver relative quantification via NPX (Normalized Protein eXpression) and, for assays with calibrators, absolute concentration units (e.g. pg/mL). This gives flexibility depending on whether you need cross-study comparability or precision in concentration estimates.
What are the sensitivity limits (LOD, LLOQ, ULOQ) and assay variability (precision)?
Many cytokines in the Target 48 Panel have lower limits of quantification (LLOQ) in low picogram/millilitre range. For example, for the analyte Thymic Stromal Lymphopoietin (TSLP), the limit of detection (LOD) is ~0.119 pg/mL; the lower quant limit (LLOQ) ~0.477 pg/mL; upper limit also spans very high levels. Precision is good: internal validation showed intra-assay and inter-assay coefficients of variation (CV) averaging ~4-6% for many analytes. Reproducibility across different sites and reagent lots is strong when following Olink's protocols.
How should data below the limit of detection (LOD) be handled?
When a measurement is below LOD, common practice is not to treat it as zero blindly. Options include replacing with LOD, half-LOD, or using censored data methods. The choice depends on how many samples are affected and what impact this will have on your analysis (bias, statistical power). Checking how often each analyte is below LOD is critical for deciding whether to include or exclude it. (Specific guidelines are in Olink validation documents.)
What about batch effects, lot-to-lot variability, and reproducibility over time?
Olink's Target 48 Cytokine Panel has been evaluated for inter-site (between labs), inter-batch, and inter-operator variability. In one study, when 15 samples were run in two different labs with two reagent lots and by different operators, the mean intra-assay CVs were ~7%, and mean inter-assay CVs ~8-10%. So with proper QC, lot tracking, and inclusion of controls, results are reproducible.
Conclusion & Next Steps
The Olink Cytokine Panel stands out as a powerful tool for inflammation research—offering high sensitivity, minimal sample volume, broad analyte coverage, and reproducible data. When you design studies using this panel, you can detect low‐abundance immune mediators, map temporal changes, and derive meaningful biological insights that might otherwise be masked by technical limits.
To make the most of what Olink offers:
- Choose the right panel (Target 48 vs Target 96 or others) based on sample constraints, number of cytokines of interest, and experimental design.
- Follow strict QC and normalization practices: include bridging controls, evaluate below-LOD data carefully, and account for batch effects.
- Use real-world case studies (such as plasma profiling, CSF studies, or comparative platform validations) as modeling guides.
- Integrate with downstream data workflows and related omics where possible to amplify the impact of your findings.
References
- Luo H. Global burden and cross-country inequalities in six major immune-mediated inflammatory diseases from 1990 to 2021: A systemic analysis of the Global Burden of Disease Study 2021. Autoimmun Rev. 2024
- Liu C, Chu D, Kalantar-Zadeh K, George J, Young HA, Liu G. Cytokines: From Clinical Significance to Quantification. Adv Sci (Weinh). 2021


