
In the fast-evolving field of biomarker discovery and translational medicine, few questions spark more debate—or confusion—than Olink vs. Mass Spectrometry (LC-MS). Choosing the right proteomics platform is a decision that shapes the scope, cost, and ultimate success of your research.
Olink delivers unmatched, high-throughput sensitivity in a convenient, ready-to-run format. Mass spectrometry (LC-MS), on the other hand, offers unbiased detection across the proteome, including the post-translational modifications (PTMs) that determine true biological activity.
With extensive in-house experience in both Olink and LC-MS platforms, Creative Proteomics has guided hundreds of research, biotech, and pharmaceutical teams through this critical choice. The most frequent misconception we encounter? Treating it as an either–or decision.
The real question is not "Which is better?" but "Which technology best answers your specific scientific question?" Increasingly, the most advanced research shows that the optimal solution often involves both—using Olink for rapid, high-throughput screening and LC-MS for definitive validation and functional insight.
This expert guide provides a clear, evidence-based comparison of both technologies. We examine their core principles, analytical limitations, and most importantly, demonstrate how an integrated Olink–Mass Spectrometry workflow can deliver what neither can achieve alone: a complete and validated view of the proteome.
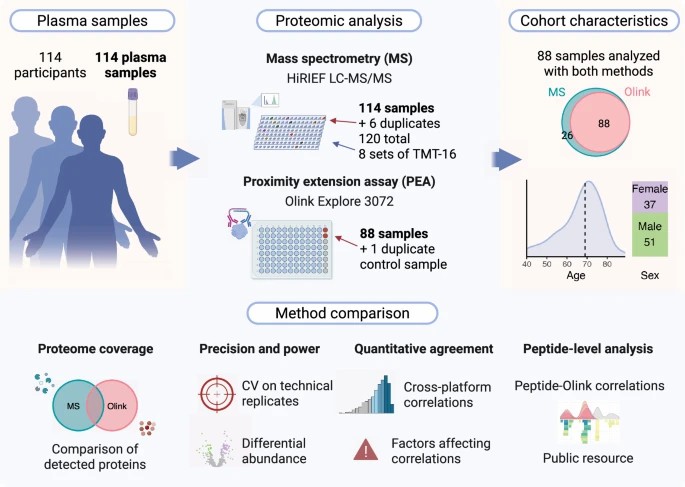 Study design for the comparative evaluation of Olink Explore 3072 and in-depth mass spectrometry (HiRIEF LC-MS/MS) in plasma proteomics.
Deep Dive 1: Olink Proteomics — The High-Throughput Specialist
What Is Olink? The Power of PEA Technology
Olink's strength lies in its proprietary Proximity Extension Assay (PEA), a method that merges the precision of immunoassays with the scalability of genomic readouts such as qPCR or next-generation sequencing (NGS).
Here's how it works, step by step:
- Dual Antibodies: Each target protein is recognized by a matched pair of antibodies that bind to two distinct epitopes.
- DNA Tags: Each antibody carries a unique, single-stranded DNA oligonucleotide tag.
- Proximity Binding: When both antibodies bind to the same protein, their DNA tags come into physical proximity.
- Hybridization & Extension: Only in this proximity can the DNA tags hybridize. A polymerase extends the sequence, creating a new double-stranded DNA "barcode" specific to that protein.
- Quantification: The barcode is quantified—by qPCR for Olink Target/Focus panels (low- and mid-plex) or by NGS for Olink Explore (high-plex). The resulting signal is proportional to the amount of protein present in the sample.
The Key Advantages of Olink
Olink has become the go-to platform for large clinical cohorts and translational studies because it combines sensitivity, throughput, and minimal sample requirements.
1. Unmatched Sensitivity — The fg/mL Frontier
Thanks to DNA-based signal amplification, Olink can detect proteins at femtogram-per-millilitre levels—orders of magnitude below the typical limits of detection for most mass spectrometers. This makes it ideal for low-abundance plasma or serum proteins that would otherwise remain undetectable.
2. High Throughput and Scalability
The NGS-based Olink Explore platform enables simultaneous quantification of thousands of proteins across hundreds of samples daily. It is the preferred choice for epidemiological and population-scale studies where sample number matters more than complete proteome depth.
3. Minimal Sample, Maximum Data
Olink typically requires around 1–3 µL of plasma or serum (panel dependent) to profile over 3,000 proteins.This micro-volume efficiency is invaluable for limited or precious specimens such as pediatric cohorts, cerebrospinal fluid (CSF), or mouse models.
The Critical Limitations of Olink
Despite its power, Olink is not without trade-offs. Its design imposes three inherent limitations that researchers should understand before interpreting results.
1. The Closed System — Limited Discovery
Olink is a targeted, antibody-dependent platform. It can only measure proteins included in its pre-validated panels. Novel biomarkers, protein isoforms, or non-human proteins—such as those from the microbiome—remain invisible. Your discovery space is limited to what Olink has predefined.
2. The Function Gap — PTM Blind Spot
Protein abundance does not equal protein activity. Many biological processes are driven by post-translational modifications (PTMs) such as phosphorylation or glycosylation. Olink cannot distinguish these functional states. It reports total protein levels, but not whether a molecule is active or inactive—information that is often crucial in oncology, neuroscience, and immunology.
3. The Relative Data — The NPX Limitation
Olink results are expressed as NPX (Normalized Protein eXpression) values—a relative, log₂-scaled metric. While excellent for comparative analysis (e.g., case vs. control), NPX does not provide absolute quantification (fmol/µg). Moreover, as an antibody-based technique, PEA is still subject to potential cross-reactivity and requires orthogonal validation by methods such as mass spectrometry.
Expert Insight: Correctly interpreting NPX values is a critical step in any Olink study. To learn more about Olink's data normalization, log₂ scaling, and how to get from raw data to biological insight, please read:
-> Understanding Olink's Data Analysis Process: From Raw Data to Insights
Deep Dive 2: Mass Spectrometry — The Unbiased Discovery Engine
What Is Mass Spectrometry? The "Bottom-Up" Approach
If Olink is a precision-guided tool for targeted detection, mass spectrometry (LC-MS) is the powerhouse for unbiased proteomic discovery. It serves as the foundation of modern "shotgun" or bottom-up proteomics, enabling scientists to identify and quantify thousands of proteins without prior assumptions.
Here's how the standard workflow operates:
- Protein Extraction and Digestion – Proteins are extracted from biological samples such as cells, tissues, or plasma, then enzymatically digested (typically with trypsin) into smaller peptides.
- Liquid Chromatography (LC) – The resulting peptide mixture is injected into a liquid chromatograph, which separates peptides based on chemical properties such as hydrophobicity. This step simplifies sample complexity.
- Ionization and Mass Analysis (MS1) – As peptides elute from the LC, they are ionized through electrospray ionization (ESI). The mass spectrometer (e.g., Orbitrap) measures each peptide's mass-to-charge ratio (m/z) with high precision, generating a comprehensive snapshot of the sample.
- Fragmentation (MS2) – Selected peptide ions are isolated and fragmented by collision energy, producing diagnostic fragment ions.
- Data Analysis and Protein Identification – The resulting MS2 fragmentation patterns serve as unique "fingerprints" for each peptide. These are matched against protein databases (e.g., UniProt), allowing computational reconstruction of the original proteins present in the sample.
The Key Strengths of Mass Spectrometry
Mass spectrometry remains the cornerstone of proteomic discovery and orthogonal validation because of three major advantages.
1. The Unbiased Discovery Engine
Unlike antibody-based platforms, LC-MS detects proteins directly from their peptide sequences. This means it is inherently unbiased and can identify:
- Novel or uncharacterized biomarkers not included in any Olink panel.
- Protein isoforms, variants, or truncated forms.
- Non-human proteins such as microbial or viral peptides.
You are limited only by analytical depth, not by predefined antibody lists.
2. The Gold Standard for PTM Characterization
Post-translational modifications (PTMs) such as phosphorylation, acetylation, and glycosylation alter peptide mass in precise, measurable ways. High-resolution MS can pinpoint the exact modification site and quantify the proportion of modified versus unmodified peptides. This allows researchers to understand protein function and regulation—a dimension that Olink cannot reveal.
3. Absolute Quantification and Validation (PRM/SRM)
While discovery-based (shotgun) MS is semi-quantitative, targeted mass spectrometry—including parallel reaction monitoring (PRM) and selected reaction monitoring (SRM)—enables absolute quantification.
By using synthetic stable-isotope-labeled (SIL) peptide standards, LC-MS can measure protein concentrations in fmol/µg units. This orthogonal, non-antibody-based approach is recognized as the gold standard for validating Olink findings and generating publication- or regulatory-grade evidence.
The Analytical Challenges of Mass Spectrometry
Despite its power, LC-MS comes with trade-offs that researchers must consider when designing large-scale studies.
1. The Depth vs. Throughput Trade-off
Comprehensive proteomic profiling is time-intensive. A deep LC-MS run can identify around 8,000–10,000 proteins in cellular or tissue lysates with extensive fractionation, while plasma coverage is lower due to its wide dynamic range.While modern automation and data-independent acquisition (DIA) methods have improved throughput, LC-MS still cannot match Olink's speed for large cohort screening. Researchers must balance depth of coverage with the number of samples analyzed.
2. The Dynamic Range and Stochastic Sampling Challenge
In plasma or serum, the top 20 most abundant proteins (e.g., albumin, immunoglobulins) represent over 99% of total protein mass, masking low-abundance biomarkers. Although depletion and enrichment methods help, LC-MS struggles to reach the femtogram-per-millilitre (fg/mL) sensitivity that Olink achieves.
Furthermore, data-dependent acquisition (DDA) strategies may select different peptides across runs, introducing missing values between samples. Advanced DIA approaches are reducing this variability, but it remains a technical consideration for reproducibility.
Olink vs. Mass Spectrometry: A Head-to-Head Comparison
This table summarizes the core differences every researcher must understand.
| Feature | Olink Proteomics (e.g., Explore) | Mass Spectrometry (e.g., Shotgun LC-MS/MS) | |
| Core Principle | Targeted (PEA): Antibody-based proximity ligation | Unbiased: Physical detection of peptide mass & sequence | |
| Primary Goal | High-Throughput Screening | In-Depth Discovery & Characterization | |
| New Protein Discovery? | No. Limited to the pre-defined panel. | Yes. The gold standard for novel, unbiased discovery. | |
| PTM Analysis? | No. This is a critical blind spot. | Yes. The gold standard for PTM site identification & localization. | |
| Sensitivity | Extreme (fg/mL): Ideal for low-abundance proteins. | Good (pg/mL - ng/mL): Struggles with the "dark proteome." | |
| Throughput | Very High: Thousands of samples/week. | Medium-Low: Hours per sample for deep runs. | |
| Sample Volume | Extremely Low (1-6 µL) | Low (requires µg of protein, ~10-50 µL of plasma) | |
| Quantification | Relative (NPX) | Semi-Quantitative (Shotgun) or Absolute (PRM/SRM) | |
| Key Weakness | The "Closed System" / PTM Blind Spot | Dynamic Range / Throughput Trade-off | |
| Best For... | Large-scale cohorts, screening known pathways. | Novel discovery, PTMs, validation, mechanism of action. |
Related Comparisons: While this guide focuses on Olink vs. MS, other platform decisions are often part of the same conversation.
- For a comparison against another major platform, read: Olink vs SomaScan: Which Proteomics Platform Delivers Greater Biological Insight?
- For a specific look at cytokine detection, see: Olink vs Luminex: Comparing Multiplex Cytokine Detection Accuracy
Beyond "vs." — The Power of "And": The Integrated Olink + Mass Spectrometry Workflow
The long-running "Olink or Mass Spectrometry" debate is increasingly outdated. In today's most advanced proteomics studies, the two technologies are no longer competitors—they are complementary partners within a single, integrated workflow.
At Creative Proteomics, our most successful collaborations combine the speed and scale of Olink proteomics with the depth and precision of LC-MS validation. Below are two proven use cases that illustrate how this integrated strategy delivers both discovery breadth and analytical depth.
Use Case 1: The Parallel Workflow — Complementary Breadth & Sensitivity
The Scenario: A research team faced a common challenge: how to balance proteomic depth, detection sensitivity for low-abundance proteins, and the throughput required for a 173-sample plasma cohort.
The Integrated Workflow:
- Parallel Analysis: Instead of choosing one platform, the team ran two complementary technologies in parallel from the same sample set.
- Olink PEA Analysis: Olink Proximity Extension Assay (PEA) technology quantified 728 proteins. This approach provided exceptional sensitivity (down to the pg/mL level), ideal for measuring low-abundance cytokines and signaling proteins often missed by MS.
- LC-MS/MS Analysis: Concurrently, unbiased LC-MS/MS quantified over 300 proteins, primarily high-abundance plasma proteins that occupied a different proteomic space than the Olink panel.
- Data Integration: Integrating these two datasets provided a far more complete map of the plasma proteome than either technology could achieve alone.
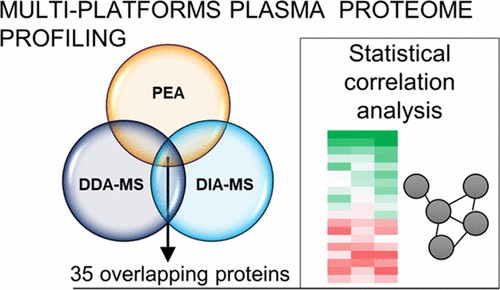 Multi-platform plasma proteome profiling using Olink PEA, data-dependent acquisition mass spectrometry (DDA-MS), and data-independent acquisition mass spectrometry (DIA-MS).
The Outcome: This parallel strategy captured the most complete and biologically relevant data. A 2021 study published in the Journal of Proteome Research (Zgaga, L. et al.) investigated this exact methodology, concluding that the two platforms are highly complementary. Olink delivered the required sensitivity for "low-abundance signal proteins," while MS provided unbiased coverage of "high-abundance functional proteins."
Use Case 2: Real-World Study — Plasma Proteome Integration
The Scenario:
A team of proteomics researchers analysed 88 human plasma samples using both the Olink Explore 3072 platform and a deep-fractionation LC-MS/MS workflow. Their aim: compare the coverage, concordance and complementarity of the two technologies in biomarker-relevant plasma proteomics.
The Workflow:
- Parallel Profiling: All 88 samples underwent Olink Explore 3072 analysis while a slightly larger cohort (120 samples) underwent HiRIEF LC-MS/MS with extensive peptide fractionation and TMT labelling.
- Coverage & Overlap: Olink detected ~2,913 proteins, LC-MS ~2,578 proteins; 1,129 proteins were common to both platforms.
- Quantitative Agreement: For overlapping proteins, the median correlation between platforms was ~0.59 (IQR 0.33-0.75) — indicating moderate agreement influenced by missing values and technical factors.
- Complementary Strengths: Olink achieved better detection across low-abundance signalling proteins, whereas LC-MS provided deeper coverage of mid-to-high abundance proteins and enabled PTM/isoform insight.
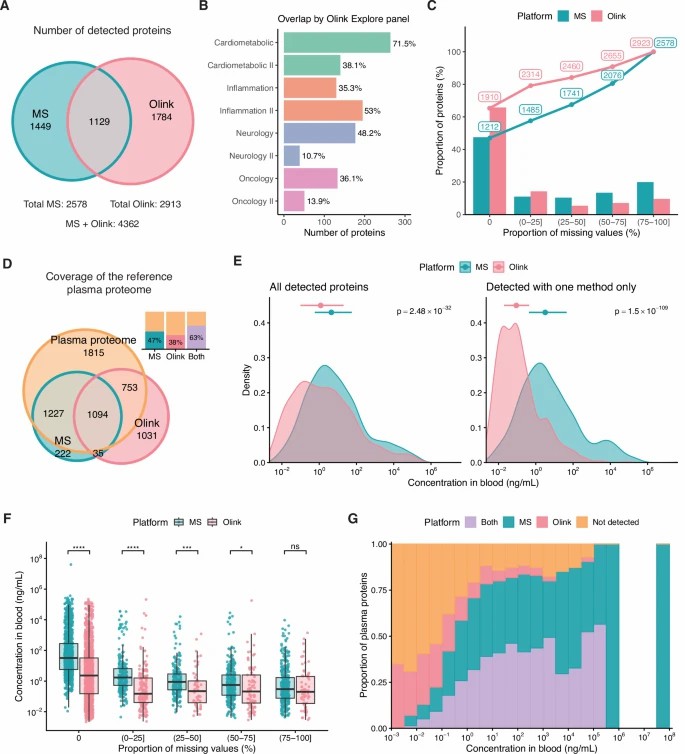 Detected proteins, missing values, and plasma proteome coverage by olink and mass spectrometry.
The Outcome:
This study confirmed that Olink and LC-MS provide complementary, non-redundant coverage of the plasma proteome. Rather than choosing one method exclusively, the optimal strategy is to integrate both platforms—use Olink for scalable screening and LC-MS for depth and validation—to build a more complete biomarker discovery and validation pipeline.
The Creative Proteomics Advantage
By combining Olink's scalable screening with LC-MS's functional precision, Creative Proteomics delivers an end-to-end biomarker discovery and validation solution. Our integrated Olink + MS workflow helps researchers move from "signal" to mechanistic insight, bridging the gap between detection and biological understanding.
From "Versus" to "Workflow": Why the Right Partner Defines Your Strategy
The decision isn't just Olink or Mass Spectrometry—it's about choosing a scientific partner who understands how to use both technologies effectively. Success in modern proteomics requires two things:
- The integrity to provide unbiased guidance, and
- The technical depth to master both platforms within one coordinated workflow.
Many CROs act only as Olink providers, delivering NPX data without downstream validation. Others specialize solely in mass spectrometry, viewing Olink as a competing technology.
At Creative Proteomics, we bridge that divide. Our foundation is built on advanced LC-MS expertise, with decades of experience solving the most complex quantification and PTM characterization challenges. We incorporate Olink not as a competitor, but as a complementary platform—an essential component of our integrated proteomics toolbox.
We are among the few laboratories globally that can manage your entire project under one roof:
- Strategic Consultation – Objective assessment to determine the optimal workflow: Olink, LC-MS, or both.
- High-Throughput Olink Screening – Leveraging the latest Olink Explore and Target platforms for scalable biomarker discovery.
- Seamless Data Integration – Direct transition from Olink results to LC-MS validation, eliminating data silos or inter-vendor shipping.
- Gold-Standard Validation – Absolute quantification via targeted PRM/SRM mass spectrometry.
- Functional Insight – Advanced PTM profiling for mechanistic understanding beyond protein abundance.
With Creative Proteomics, you don't just receive data—you gain a complete, validated, and biologically interpretable solution.
Stop choosing between "or."
Start your project with the power of "and."
> Learn More About Our Integrated Olink + Mass Spectrometry Solution
Frequently Asked Questions (FAQ)
Q1: Can Olink detect post-translational modifications (PTMs)?
No. This is the primary limitation of Olink's Proximity Extension Assay (PEA) technology. Olink measures total protein abundance but cannot differentiate or quantify post-translational modifications (PTMs) such as phosphorylation, glycosylation, or acetylation.
For functional or mechanistic insight, mass spectrometry (LC-MS) remains the gold-standard tool for PTM detection and quantification.
Q2: Is Olink better than Mass Spectrometry?
Neither is universally better—they serve different scientific purposes.
- Olink Proteomics excels at high-throughput screening of known proteins across hundreds or thousands of samples.
- Mass Spectrometry (LC-MS) excels at unbiased discovery, PTM analysis, and absolute quantification.
- The most advanced studies combine both platforms to achieve comprehensive, validated results.
Q3: How are Olink hits validated?
Olink NPX results must be confirmed using an orthogonal method—a technology independent of antibody binding.
The industry standard is Targeted Mass Spectrometry (PRM/SRM), which provides:
- Absolute, calibrated quantification (e.g., fmol/µg) using stable-isotope-labeled internal standards.
- Direct sequence confirmation of the target protein.
- This step converts Olink "hits" into validated biomarkers suitable for publication or regulatory submission.
Q4: What is Olink NPX, and is it quantitative?
NPX (Normalized Protein eXpression) is Olink's standard relative quantification metric, reported on a log₂ scale. It enables reliable within-study comparisons (e.g., case vs. control) but does not provide absolute concentration units such as ng/mL or fmol/µg.
For true quantitation, Olink results should be cross-validated with targeted LC-MS methods.
Q5: Can Olink be used to discover new biomarkers?
Not entirely. Olink's predefined panels measure a curated set of validated proteins—meaning it cannot detect novel or uncharacterized proteins or isoforms.
Mass spectrometry-based proteomics is required for genuine discovery of new biomarkers or post-translational variants beyond existing Olink panels.
Q6: I have 500 plasma samples. Should I use Olink or Mass Spectrometry?
For large cohorts, the optimal and most cost-effective strategy is an integrated Olink + MS workflow:
- Screen Broadly with Olink: Identify top candidate proteins across all 500 samples using high-throughput PEA panels.
- Validate Precisely with LC-MS (PRM/SRM): Confirm those hits with absolute quantification and PTM analysis.
- This two-stage approach—our specialty at Creative Proteomics—combines Olink's statistical power with the functional validation of mass spectrometry, producing publication-ready, biologically meaningful data.
References
- Aebersold, R., & Mann, M. (2016). "Mass-spectrometric exploration of proteome structure and function." Nature.
- Assarsson, E., et al. (2014). "Homogenous 96-plex protein analysis using proximity extension assay." PLoS ONE.
- Dammer, E.B., et al. (2022). "Multi-platform proteomic analysis of Alzheimer's disease cerebrospinal fluid and plasma reveals network biomarkers associated with proteostasis and the matrisome" Alzheimer's Research & Therapy.
- Gisler, A., et al. (2023). "Comparison of Olink and LC-MS/MS proteomics platforms for the identification of systemic lupus erythematosus biomarkers." Frontiers in Immunology.
- Lundberg, M., et al. (2010). "Homogeneous antibody-based proximity extension assays for high-throughput protein biomarker discovery." Nucleic Acids Research.
- Picotti, P., & Aebersold, R. (2012). "Selected reaction monitoring-based proteomics: workflows, potential, pitfalls and future directions" Nature Methods.
- Rutledge, J., et al. (2024). "Comprehensive proteomics of csf, plasma, and urine identify ddc and other biomarkers of early parkinson's disease." Acta Neuropathologica.
- Agnese Petrera, et al. (2021). "Multiplatform Approach for Plasma Proteomics: Complementarity of Olink Proximity Extension Assay Technology to Mass Spectrometry-Based Protein Profiling" J Proteome Res.
- Noora Sissala, Haris Babačić, Isabelle R. Leo et al. Comparative evaluation of in-depth mass spectrometry and Olink Explore 3072 for plasma proteome profiling, 05 May 2025,. Research Square


