
The Shifting Landscape of Proteomics Research
Proteomics is no longer niche—it's central to modern biologic research. In the last five years, high-throughput and multiplex proteomics methods have surged in adoption across biotech, academia, and CROs. Researchers demand greater sensitivity, precision, and data throughput than what traditional tools like ELISA and Western blotting can offer.
Key Trends Reshaping Proteomics
High-throughput / Multiplexing: Emerging methods allow quantification of many hundreds to thousands of proteins per sample. This supports screening in large cohorts or multiple experimental conditions.
Dynamic range and sensitivity improvements: Modern techniques are detecting lower-abundance proteins more reliably, which is essential for biomarker discovery in biofluids like plasma or serum.
Sample volume constraints: Researchers are frequently working with limited or precious samples (e.g. sorted cell populations, rare specimens), pushing for methods that require minimal input. Reproducibility and cross-site standardization: As studies move from pilot to large-scale, reproducible workflows and standardized data are becoming essential. Differences in reagents, antibodies, instrumentation, and sample handling are no longer tolerable sources of noise.
See Olink's Plasma Proteomics: Unlocking Insights for Disease Research for study-design tips on matrix choice, sample handling, and panel selection (research use only).
Limitations of Traditional Methods
Although ELISA, Western blotting, and classical immunoassays are still workhorses, they show weaknesses in the face of modern research demands:
Limited multiplexing: ELISA is generally restricted to low-plex (often single-plex or small panels). Western blots usually handle one or a few targets at a time.
High sample consumption: To detect low-abundance proteins with ELISA or Western blot, large volumes or higher protein concentrations may be needed.
Labor, time, and throughput constraints: Traditional workflows are more manual, often slower, and less scalable for large sample numbers.
Variability and reproducibility issues: Antibody quality, lot-to-lot differences, and variability in experimental execution can introduce noise.
If you'd like a concise primer on how Proximity Extension Assay (PEA) overcomes these bottlenecks, see our step-by-step guide to PEA principles and how it compares with mass spectrometry.
Why Olink Proteomics Stands Out
Olink's Proximity Extension Assay (PEA) technology combines attributes of immunoassays and DNA-based detection to overcome many limitations of traditional protein measurement methods. Below are the key technical advantages that make Olink a powerful option for non-clinical research.
Key Advantages of Olink PEA
High specificity via dual antibody recognition
In PEA, each target protein must be simultaneously bound by two matched antibodies, each labeled with a complementary DNA oligonucleotide. Only when both antibody-oligo probes bind their target do the oligos come into proximity, hybridize, and get extended. This dual binding reduces background noise and cross-reactivity.
Multiplexing capacity with minimal sample input
Some Olink panels can assay thousands of proteins in parallel using as little as 1-6 µL of sample (e.g., plasma, serum). This low input requirement is especially valuable when working with precious or limited samples.
Wide dynamic range and sensitivity
PEA captures protein expression spanning several orders of magnitude, enabling detection of both abundant and very low-abundance proteins in complex biofluids. This range improves the ability to detect subtle changes in protein levels.
Not sure which panel fits your cohort size and endpoints? How to Choose the Right Olink Panel for Your Research walks through panel selection, sample input, and budget trade-offs for non-clinical studies.
Scalable readout options (qPCR or NGS)
Depending on the panel and desired throughput, Olink supports either quantitative real‐time PCR (qPCR) or next-generation sequencing (NGS) as the readout. This flexibility allows labs to choose based on capacity, cost, and study scale. To understand how raw signals become decision-ready NPX values and QC metrics, see Understanding Olink's Data Analysis Process: From Raw Data to Insights.
Robustness and reproducibility
Studies comparing Olink with multiple other multiplex platforms (e.g., MSD, Luminex) show that Olink maintains high precision, consistency, and detectability across proteins, panels, and labs.
Ready to scope a study with low input volumes and high multiplexing? Review our Olink Proteomics Analysis Service to see panel options, workflows, and submission guidance for research-use projects.
Case Study Highlight
96-plex PEA assay performance: A PLoS ONE study (Assarsson et al., 2014) demonstrated a 96-plex PEA immunoassay with high sensitivity and specificity, excellent scalability, and only 1 µL sample consumption per test even with serum/plasma.
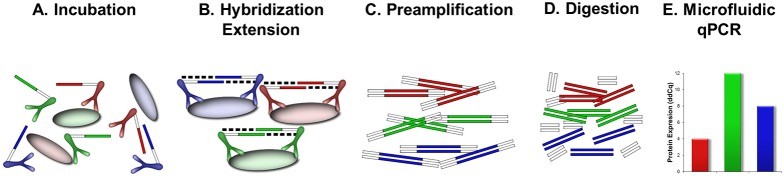 Figure 1. Design and description of 96-plex PEA.
High-throughput proteome-wide PEA + NGS: Wik et al., 2021 showed nearly 1,500 proteins measured across 96 samples in a single run using Olink Explore 3072/384 with NGS readout. That equals ~150,000 data points per run, enabling powerful discovery-scale experiments.
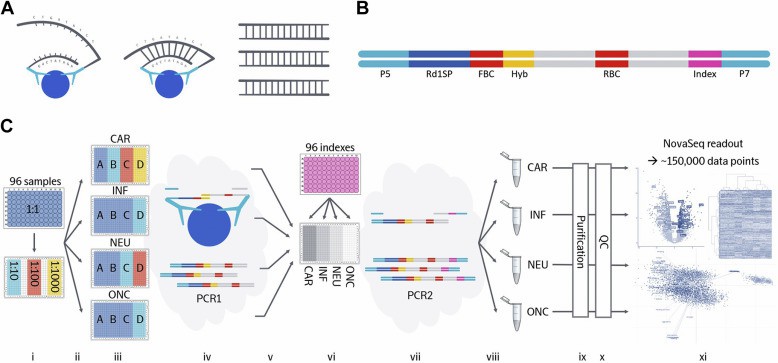 Figure 2. Schematic overview of Olink Explore.
For a birds-eye view of our Olink panels (from focused targets to high-plex discovery) and how we support research teams end-to-end, explore our Olink Proteomics hub.
Comparing Olink to Traditional Methods Head-to-Head
Below is a side-by-side technical comparison of Olink's PEA platform versus ELISA / Western blot and Mass Spectrometry (MS) methods. I draw on peer-reviewed studies to illustrate strengths and trade-offs.
Comparison Table: Olink PEA vs ELISA / Western Blot vs Mass Spectrometry
| Feature | Olink | ELISA / Western Blot | Mass Spectrometry (Discovery / Deep Profiling) |
| Multiplex capacity | Very high (dozens to thousands of proteins per panel) | Low; typically one target per assay (ELISA) or few (Western blot) | Very high for discovery; can detect many thousands of proteins depending on fractionation and sample prep |
| Sample input / Minimal volume | Ultra-low (often ~1 µL of plasma/serum for many panels) (Assarsson et al., 2014) | Requires significantly more sample; some ELISA require tens to hundreds of microliters; Western blot needs enough protein for gel loading and transfer | Generally needs larger sample amounts, especially for deep coverage (pre-fractionation, depletion of abundant proteins) |
| Sensitivity / Detection of low-abundance proteins | Excellent sensitivity; dual antibodies reduce background; able to detect proteins at low concentrations that are difficult via MS or ELISA without amplification steps | ELISA can be sensitive, especially for abundant targets; Western blot less quantitative/sensitive for low abundance; often limited by antibody quality and detection method | MS sensitivity has improved, but detecting very low abundance proteins in complex matrices like plasma often requires depletion or enrichment; ion suppression can be a problem |
| Quantitative reproducibility | High intra- and inter-assay precision; PEA has built-in controls and normalization (e.g., in Assarsson et al., 2014) | ELISA can be reproducible for single proteins, but variability in reagents/antibody lots; Western blots less reproducible quantitatively between labs | Modern MS workflows have good reproducibility, especially for abundant or medium proteins and when using isobaric labels / standardized workflows; but variability increases for low abundance, post-translational modifications, etc. (e.g. HiRIEF + LC-MS vs Olink Explore study) |
| Depth / Proteome coverage | Covers pre-selected protein panels; good breadth for proteins included in panels; may miss some proteins outside those panels | Very limited coverage; only what is targeted; Western blot may also miss isoforms or modifications unless specific antibodies are available | MS excels in breadth; can detect many thousands of proteins, including novel or unplanned ones; can reveal peptide-level detail, isoforms, PTMs when properly designed |
| Sample types / Matrix compatibility | Validated largely in plasma, serum; some panels also work with other biofluids; small sample volume helps with precious or rare samples | ELISA / Western blot versatile across sample types but may require optimization; Western blot requires sample prep (denaturation, reducing, etc.) | MS can handle many sample types (cells, tissues, fluids) but sample prep often more complex; solid tissue or low volume biofluids need special protocols |
| Throughput / Hands-on time | High throughput; multiplex panels reduce hands-on steps; fewer manual washes, easier automation; readout via qPCR or NGS depending on panel | ELISA moderate throughput but scaling to many proteins is laborious; Western blot low throughput and labor-intensive | MS discovery workflows are more complex, longer sample prep, instrument time); for large numbers of samples there are faster MS workflows, but still more time per sample than many panel-based assays |
| Cost (per sample / per protein) | Moderate to high depending on panel size; cost-efficiency increases with number of proteins measured per sample | Cost per protein low when only one or few proteins; cost per sample for many proteins becomes large; Western blot has consumable + labor costs | High: instrument cost, reagents, sample prep, fractionation, specialized staff; but cost per detected protein decreases in large, discovery-scale experiments |
Key Studies Illustrating the Comparison
Assarsson et al., 2014 (Homogenous 96-Plex PEA Immunoassay):
Demonstrated a 96-plex PEA assay using only 1 µL of serum or plasma per test. The assay showed excellent intra-assay precision, strong sensitivity in complex biofluids, and excellent scalability.
Comparative evaluation of in-depth MS (HiRIEF LC-MS/MS) vs Olink Explore 3072:
In a recent study with ~88 plasma samples analyzed on both technologies (~1,129 overlapping proteins), the results showed moderate quantitative agreement (median correlation ~0.59). MS provided greater total protein coverage; Olink offered superior consistency for proteins within its panel, especially low abundance ones.
Technical evaluation of plasma proteomics technologies (Olink vs MS-based methods):
A study comparing multiple plasma proteomics workflows observed that while MS-based methods could detect more proteins overall, Olink's PEA-based panels achieved greater reproducibility with lower sample input and better sensitivity for certain protein classes (e.g., cytokines, chemokines) in complex matrices.
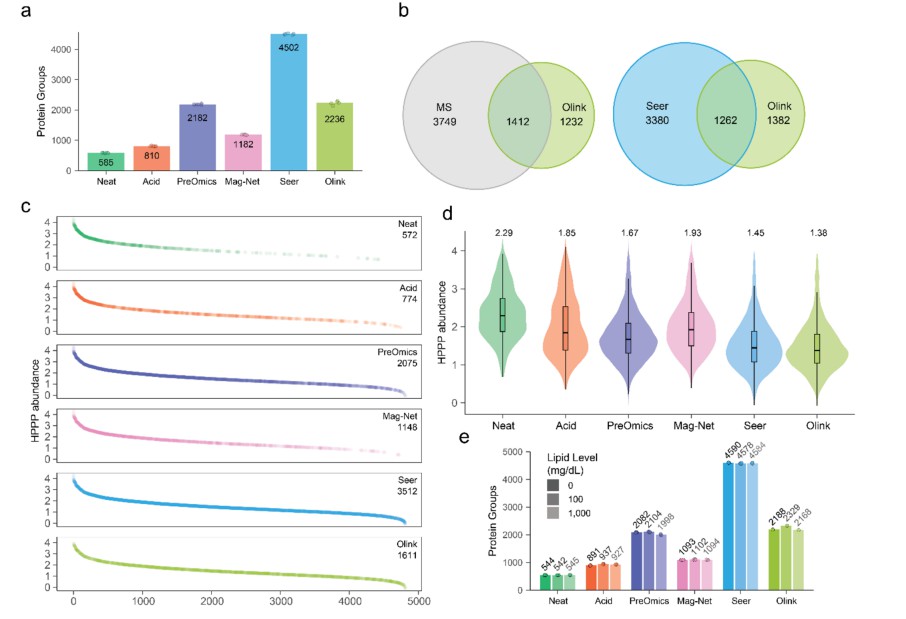 Figure 3. Depth of proteomic analysis for the tested methods.
Evidence from Industry and Research
Case Studies & Major Research Examples
China Kadoorie Biobank vs SomaScan: Comparative Platform Study
In nearly 4,000 Chinese adults, over 2,000 proteins were measured using both Olink Explore and SomaScan platforms. This study (Oxford Population Health et al.) assessed cross-platform consistency, reproducibility, and genetic and non-genetic determinants of protein levels. It showed that proteins at higher concentrations in plasma were more consistently quantified across assays. This helps researchers make informed choices about which proteomics technology to use for large cohorts.
UK Biobank Pharma Proteomics Project (UKB-PPP): Population-Scale Proteomics
Using Olink Explore 3072 panels, the UKB-PPP measured ~3,000 proteins in >54,000 samples (pilot phase). Publication highlights include insights into aging biology, early biomarkers for brain aging and cognitive decline, and small-protein models that predict risk for multiple diseases years in advance. These large sample sizes with broad panels epitomize the throughput, sensitivity, and downstream analytic power of Olink platforms in non-clinical research.
"A Method for Comparing Proteins Measured in Serum and Plasma by Olink"
A recent study compared matched serum and plasma samples using high-throughput PEA-based Olink panels to understand how sample matrix affects detectability and quantification. Findings are important for researchers planning studies with mixed sample types or when comparing historical and prospective datasets.
Olink Proteomics + Lipidomics in Mycobacteria vs Non-Tuberculous Mycobacteria (NTM vs MTB)
In a study of serum samples, Olink proteomics (immune-related panels) was combined with lipidomics to characterize differences among patients (MTB, RGM, SGM) and healthy controls. Key inflammatory proteins such as IFN-γ, CXCL9, CXCL10 were upregulated, and multiple lipids were differentially expressed. While this study is closer to translational/clinical, its design, sample handling, and analytical rigor illustrate how Olink can generate high-dimensional, multi-omics datasets with small serum volumes.
When you need pathway-level context or metabolite–protein crosstalk, consider our Integrated Olink & Metabolome Service to run coordinated proteomics–metabolomics projects with aligned sample handling and analysis.
What These Studies Show
From these examples, you can draw multiple lessons relevant to choice, design, and trust when using Olink proteomics:
High detectability & reproducibility even with complex matrices (plasma/serum) and small sample volumes.
Strong performance in cohort‐scale studies: enabling statistical power, discovery of biomarkers, aging signatures, etc.
Comparability across platforms and sample types, which supports meta-analysis, replication, and longer longitudinal studies.
Integration with other omics / metadata (lipidomics, genomics, phenotypic data) adds interpretative depth.
Planning longer-term platforms or multi-omics integration? The Future of Proteomics: Where Olink Fits Into Emerging Technologies maps how PEA pairs with AI analytics, single-cell workflows, and next-gen readouts—strictly for research use.
Practical Implications for CROs and Biotech Teams
For Contract Research Organisations (CROs) and biotech R&D teams, adopting Olink proteomics delivers several operational, experimental, and strategic benefits. Below are the key implications, supported by real studies whenever available.
Operational & Experimental Advantages
Lower sample requirements reduce cost and risk
When sample availability is limited (e.g. rare specimens, small animal models, sorted cell populations), methods like Olink that require as little as 1 µL of plasma or serum per sample help prevent waste and allow multiple assays. This enables more experiments per sample and lowers per-study risk.
Improved reproducibility in large studies and across time
A study comparing Olink vs. SOMAscan in epidemiological cohorts (Nurses' Health Study, Health Professionals Follow-Up) showed that for Olink's 972-protein panel, over 55 % of proteins measured in triplicates (processed immediately, 24h, 48h delay) had intra-class correlation (ICC) or Spearman's correlation ≥ 0.75; 87 % had ICC/r ≥ 0.40.
This suggests that Olink is reliable even with delays in sample handling, which is common in multi-site or outsourced studies.
Greater throughput & workflow efficiency
Multiplex panels reduce the number of separate immunoassays needed: more protein targets can be measured per run. This cuts down on labour, reagents, and overall processing time. For labs scaling up proteomics work (e.g., sample cohorts of hundreds or thousands), this matters dramatically.
Better data comparability across batches / labs
Olink panels include internal control features and normalization (NPX values etc.), helping to control batch effects. The Olink vs. SOMAscan study showed high stability over 1-year sample remeasurements, reinforcing that longitudinal and multi-site studies can produce comparable data.
Strategic Implications for Project Design and Decision Making
Panel selection enables precise trade-off calibration
CROs can choose from targeted panels (fewer proteins, focusing on specific pathways) to high-multiplex discovery panels depending on budget, turnaround time, and the biological question. That allows optimizing cost vs depth vs speed. (White paper from Creative Proteomics states 48 to ~3,072 proteins depending on panel; sample volume remains low.)
Feasibility for pilot studies and biomarker validation workflows
Before committing to large survey or discovery studies, small pilot runs using Olink can test hypothesis, filter potential biomarkers, verify sample matrix effects, etc., at lower cost. Then the validated panel or a subset can be used in deeper analyses.
Risk mitigation in multi-site / longitudinal cohorts
Sample collection, shipping, handling delays often introduce variation. The demonstrated stability of Olink's measurements even with delayed processing (24-48h) and frozen archival samples provides assurance in real-world CRO operations.
Integration potential with other omics or readouts
While Olink does not provide peptide-level detail or post-translational modification mapping like mass spec in all cases, the consistent, high-multiplex protein quantification makes it ideal for integrating proteomics with transcriptomics, metabolomics, or phenotypic data in systems biology / discovery pipelines.
Frequently Asked Questions (FAQ)
1. What sample types are compatible with Olink proteomics?
Olink PEA assays have been validated with a variety of sample matrices. Typical sample types include plasma and serum. Additional compatible matrices include cerebrospinal fluid (CSF), tissue lysates, conditioned media, exosomes, urine, and other biofluids.
2. How small a sample volume is needed?
Olink panels can require very low sample input—often around 1 µL for many panels. For some high-plex panels or matrix types, slightly more may be needed depending on panel design and readout method.
3. How many proteins can Olink measure in a single panel?
The number depends on the panel type:
Target panels (Target-48, Target-96) generally measure up to ~92 proteins.
Flex / Focus panels allow custom selection (up to ~21 proteins) from a larger validated assay library.
High-plex / Discovery panels (e.g. Olink Explore) provide coverage of hundreds to several thousands of proteins.
4. What does NPX mean, and how is quantification handled?
NPX stands for Normalized Protein eXpression. It is an arbitrary unit in a log2 scale used by Olink for relative quantification of protein levels across samples. Differences in NPX reflect fold-changes (a 1 NPX difference ≈ doubling of protein concentration under ideal conditions). Absolute quantification (e.g. pg/mL) is possible in certain Target panels.
5. What are the limits of detection (LOD) and reproducibility like?
Each assay has a specific LOD defined per plate, based on negative controls and background signal.
Reproducibility: In large-cohort studies, many Olink proteins show low intra- and inter-assay variation. For example, in UK Biobank's Explore 1536 project, control samples and bridging samples were used across plates/batches to ensure that coefficients of variation remain acceptable.
6. How should samples be handled to maintain data quality?
Use consistent collection methods (e.g. serum vs plasma, anticoagulant type) across all samples.
Process samples quickly, keep them cold (2-8°C) during handling, and freeze at -80°C for long-term storage. Transport on dry ice.
Include QC / control samples in each plate to monitor assay performance. Plate controls, negative controls, incubating/detection controls are used in Olink workflows.
References
- Assarsson E, Lundberg M, Holmquist G, Björkesten J, Thorsen SB, Ekman D, Eriksson A, Rennel Dickens E, Ohlsson S, Edfeldt G, Andersson AC, Lindstedt P, Stenvang J, Gullberg M, Fredriksson S. Homogenous 96-plex PEA immunoassay exhibiting high sensitivity, specificity, and excellent scalability. PLoS One. 2014
- Wik, Lotta et al. Proximity Extension Assay in Combination with Next-Generation Sequencing for High-throughput Proteome-wide Analysis. Molecular & Cellular Proteomics, Volume 20, 100168
- Noora Sissala, Haris Babačić, Isabelle R. Leo et al. Comparative evaluation of in-depth mass spectrometry and Olink Explore 3072 for plasma proteome profiling, 05 May 2025, PREPRINT (Version 1) available at Research Square
- William F. Beimers, Katherine A. Overmyer, Pavel Sinitcyn, Noah M. Lancaster, Scott T. Quarmby, and Joshua J. Coon. Technical Evaluation of Plasma Proteomics Technologies. Journal of Proteome Research 2025 24 (6), 3074-3087
- Study supports future research into proteins by comparing different technologies
- Shraim R, Diorio C, Canna SW, Macdonald-Dunlop E, Bassiri H, Martinez Z, Mälarstig A, Abbaspour A, Teachey DT, Lindell RB, Behrens EM. A Method for Comparing Proteins Measured in Serum and Plasma by Olink Proximity Extension Assay. Mol Cell Proteomics. 2025
- Wang L, Yang G, Guo L, Yao L, Liu Y, Sha W. Olink proteomics and lipidomics analysis of serum from patients infected with non-tuberculous mycobacteria and Mycobacterium tuberculosis. Inflamm Res. 2024


