
Introduction
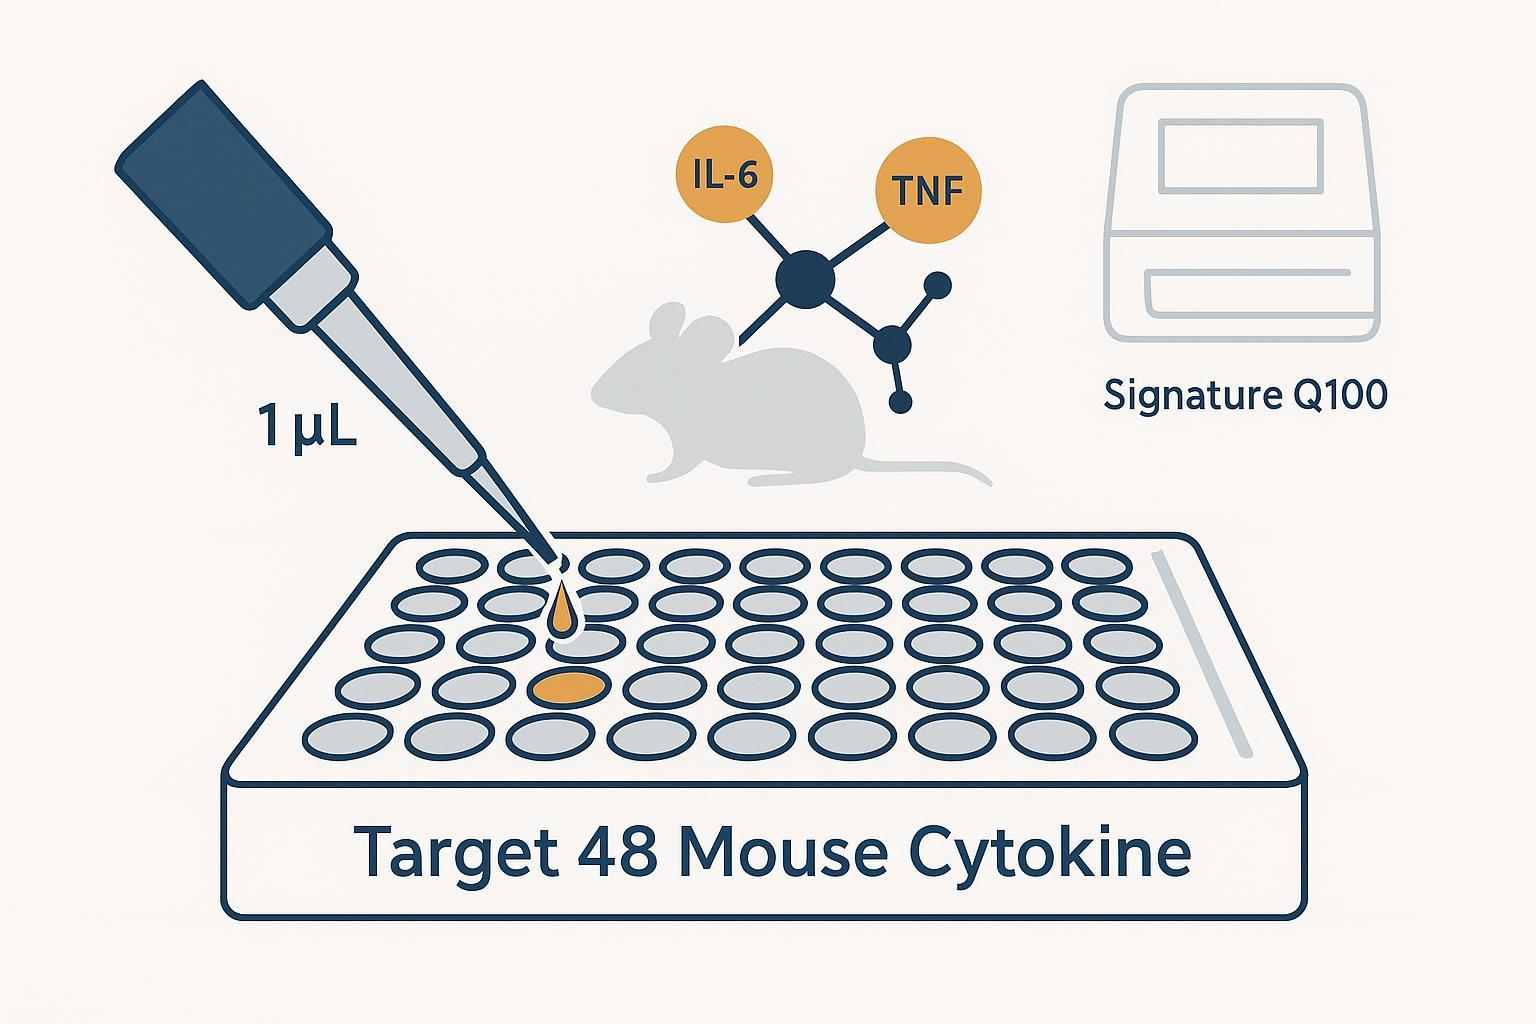
Running the Olink Target 48 Mouse Cytokine panel with just 1 µL of mouse plasma is feasible for cytokine quantification and has been demonstrated across manufacturer documentation and peer‑reviewed use cases. The panel offers mouse‑validated content and delivers readouts in two complementary modes: absolute concentrations in pg/mL (when calibrated on the Signature Q100) and relative abundance as NPX (Normalized Protein eXpression). Together, they support discovery and translational analyses with minimal sample burden.
This guide clarifies species validation and analyte coverage (approximately 43 mouse‑reactive immune mediators), explains absolute readouts via the plasma‑free calibrator, and highlights when NPX is the better choice. You'll also get practical operational nuances, a bench‑ready QC workflow, and study design pointers for longitudinal mouse work.
Key takeaways
- 1 µL assay input is supported for Olink Target 48 Mouse Cytokine and enables repeated sampling in longitudinal mouse studies.
- The panel covers roughly 43 mouse‑validated cytokines and related immune mediators using PEA chemistry.
- Two readout modes are complementary: pg/mL (Signature Q100 with calibrator) for absolute reporting and NPX for relative comparisons and broader normalization.
- Instrumentation and throughput: runs on the Olink Signature Q100 with about 40 samples per kit/run, allowing efficient plate planning with bridge samples for inter‑plate alignment.
- QC essentials: standardize preanalytics (EDTA plasma, controlled centrifugation, −80°C storage), use plate controls and bridge samples, monitor CVs/detection rates, and follow calibrator‑anchored normalization.
Feasibility and technical specifics for Olink Target 48 Mouse Cytokine
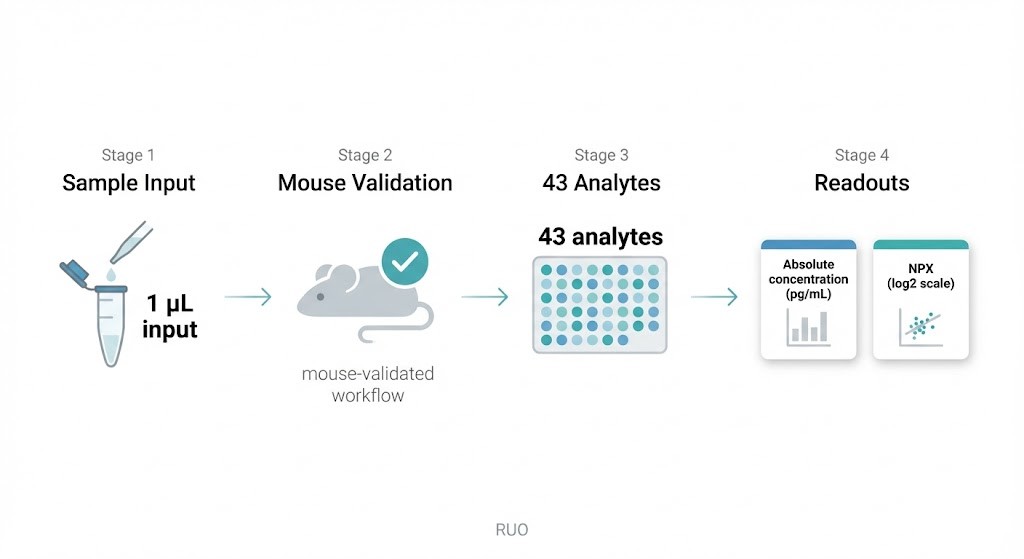 Workflow overview: 1 µL sample input, mouse-validated performance, 43 analytes, and dual readouts in absolute concentration (pg/mL) and NPX.
Sample volume and assay input
Proximity Extension Assay (PEA) chemistry enables multiplexed detection from minimal input volumes. For Olink Target 48 panels, an assay input around 1 µL per sample is typical, which is why the setup is attractive for small‑animal studies. If you're new to PEA, start with the platform primer in the manufacturer's overview of the technology in the What is PEA documentation.
Mouse validation and analyte coverage
The Olink Target 48 Mouse Cytokine panel includes approximately 43 mouse‑reactive immune mediators validated in mouse EDTA plasma. Representative assay pages for Interleukin‑4 (Mouse Cytokine) and Interleukin‑6 (Mouse Cytokine) document performance characteristics in mouse matrices, underscoring suitability for preclinical immunology. For a consolidated view of performance characteristics across cytokines, see the manufacturer's Target 48 Cytokine validation data (PDF) .
Absolute quantification and calibration
By default on the Olink Signature Q100 , Target 48 panels can report absolute concentrations (pg/mL) using a plasma‑free Calibrator comprised of fixed recombinant proteins. This supports pharmacology‑minded reporting and cross‑study comparisons when matrix assumptions hold. NPX remains crucial for discovery and relative analyses. Note that in‑vitro calibration curves on public assay pages are illustrative; they are not intended to convert NPX to pg/mL post hoc.
Operational considerations and submission volumes
Assay input vs CRO submission
While assay input is ~1 µL per panel, many CROs request 40–50 µL of mouse plasma per sample. The buffer between input and submission volume covers intake QC, potential repeats, and aliquoting for archive or further analyses. Planning for this practical delta prevents avoidable resampling later.
Instrumentation and throughput
Olink Target 48 panels run on the benchtop Signature Q100 qPCR instrument. Typical kit capacity is about 40 samples/run. For multi‑plate studies, pre‑define bridge samples that repeat across plates to support inter‑plate normalization. If you expect re‑runs due to out‑of‑range markers, budget additional wells from the outset.
Dilution strategies and dynamic range
Mouse cytokines can span wide concentration ranges. A prudent approach is to pilot a subset of samples neat and at 1:2–1:10 dilutions to confirm linearity for high‑abundance targets. Re‑run any analytes that exceed the upper linear range and document the final dilution factors for accurate pg/mL reporting. For NPX‑based analyses, preserve the same dilution factor across comparative groups and note any deviations in your analysis plan.
Preanalytical handling and QC workflow
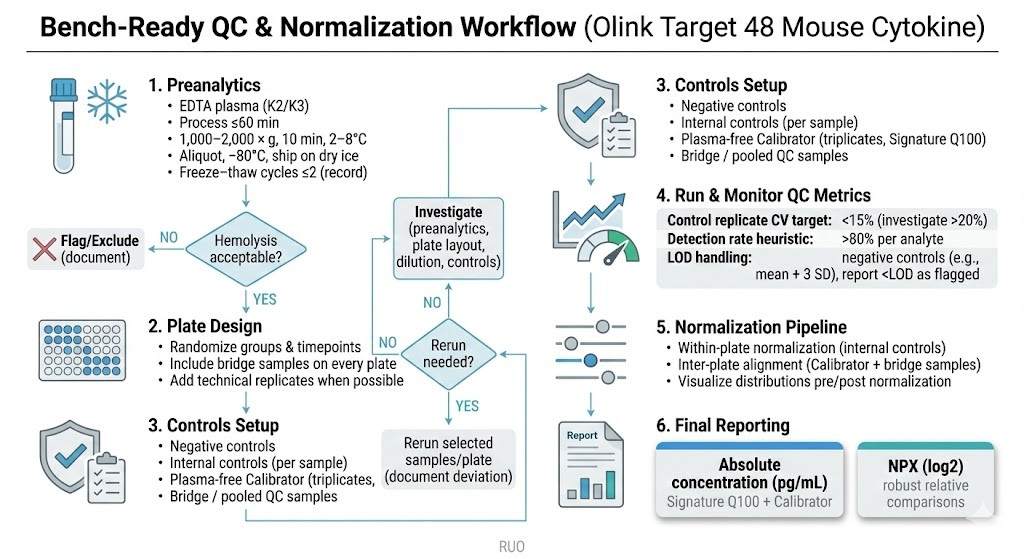 Bench-ready QC and normalization workflow for Olink Target 48 Mouse Cytokine studies, summarizing preanalytical handling, plate design with bridge samples and controls, key QC checks (CVs, detection rates, and <LOD flagging), calibrator-anchored inter-plate alignment, and final reporting as absolute pg/mL (Signature Q100) and NPX.
Collection, processing, and storage
- Anticoagulant: Prefer K2/K3 EDTA plasma; if using citrate or heparin, keep the choice consistent across the entire cohort.
- Processing: Within 60 minutes of collection, centrifuge at 1,000–2,000 × g for 10 minutes at 2–8°C. Avoid buffy coat disturbance; transfer supernatant to low‑bind tubes.
- Storage: Aliquot promptly to minimize freeze–thaw. Store at −80°C and ship on dry ice. Document freeze–thaw counts in the sample manifest. A conservative rule is to keep cycles ≤2 unless the study plan specifies otherwise.
For step‑by‑step intake details and shipping checklists, see the Olink Sample Preparation Guidelines (Knowledge Base Source).
Centrifugation and hemolysis control
Set explicit acceptance criteria before the study starts. Use a hemolysis index or spectrophotometric check; exclude or flag visibly hemolyzed specimens given their broad effect on cytokine measurements. Keep the g‑force/time/temperature fixed across runs to reduce preanalytical variance. Several peer‑reviewed studies highlight meaningful impacts of hemolysis and freeze–thaw on proteomic measurements; build your SOP to avoid these failure modes.
Plate randomization and controls
Plate design and normalization are where rigor pays off:
- Randomize: Distribute groups and timepoints across plates to avoid confounding. Include bridge samples that repeat on each plate for inter‑plate alignment.
- Controls: Include manufacturer‑recommended negative controls, the plasma‑free Calibrator in triplicate, and internal controls (spiked into each sample) to monitor reaction steps. Add sample replicates where feasible.
- Heuristics to monitor: target within‑plate CVs <15% for control replicates; investigate assays with CV >20% or low detection rates (<80%). Determine per‑assay LOD from negative controls (e.g., mean + 3 SD) and report <LOD values with flags according to your analysis plan.
- Normalization: Apply within‑plate normalization using internal controls, then inter‑plate normalization using calibrator/bridge samples. For multi‑plate projects, document the bridging strategy and visualize distributions before and after normalization.
When you need a practical template, consult these knowledge resources from Creative Proteomics (Disclosure: Creative Proteomics is our product) presented in a neutral, how‑to format: an overview of the Olink Data Analysis Process for plate QC, normalization, and LOD handling, and guidance on Interpreting Olink Serum Proteomics for NPX distributions and common QC flags. Use them to cross‑check your SOP rather than as a substitute for manufacturer instructions.
Applications, limitations, and study design
Longitudinal mouse studies
The 1 µL assay input is particularly well‑suited to serial sampling in longitudinal designs, reducing animal burden and enabling dense time courses. In pharmacology‑oriented designs, absolute pg/mL supports dose–response modeling and cross‑study comparability, while NPX provides robust relative changes when you prioritize group contrasts and broad normalization.
Translational comparisons
For preclinical‑to‑clinical translation, consider reporting both pg/mL and NPX when feasible and be transparent about matrix differences. Bridge samples and harmonized preanalytics help, but species‑specific biology and binding affinities can still create offsets. Think of pg/mL as your absolute anchor and NPX as a stable relative compass across cohorts—each has a place.
Conclusion
Olink Target 48 Mouse Cytokine measurements from 1 µL of mouse plasma are feasible and practical for longitudinal and translational research. With Signature Q100 calibration, you can report absolute concentrations in pg/mL; with NPX, you gain robust relative comparisons and normalization flexibility. The essentials are straightforward: standardize preanalytics (EDTA plasma, controlled centrifugation, −80°C storage), plan plate randomization with appropriate controls and bridge samples, monitor detection rates and CVs, and apply calibrator‑anchored normalization. Do that, and you'll have a reproducible workflow ready for demanding mouse plasma studies.
FAQ
What minimum sample volume does Olink Target 48 Mouse Cytokine require?
The assay itself requires roughly 1 µL of plasma per panel. For logistics (intake QC, repeats, archiving) many providers request 40–50 µL as a submission minimum—plan for the larger amount when working with a CRO. See the Olink Signature Q100 instrument page and Target 48 validation data for context on input and kit capacity (Olink Signature Q100; Target 48 validation PDF).
Should I report pg/mL or NPX for my study?
Use pg/mL when absolute concentrations matter (pharmacokinetics, cross‑study comparisons) and you run the Signature Q100 with the built‑in Calibrator. Use NPX for relative comparisons, discovery work, or when broad normalization across plates is the priority. Reporting both (pg/mL + NPX) is a sensible compromise for translational projects.
How much plasma should I submit to a CRO versus what the assay needs?
Although the assay input is 1 µL, submit at least 40–50 µL per sample to most CROs to allow intake checks, replicate wells, and archive aliquots. If samples are extremely limited, agree an intake plan with the CRO that documents acceptable tradeoffs.
Which anticoagulant and centrifugation conditions should I use?
Prefer K2/K3 EDTA plasma and keep the anticoagulant consistent across the cohort. Centrifuge at 1,000–2,000 × g for 10 minutes at 2–8°C, avoid disturbing the buffy coat, and transfer plasma to low‑bind tubes for aliquoting.
How should I handle hemolyzed or freeze–thaw‑exposed samples?
Measure a hemolysis index or use visual scoring; flag or exclude markedly hemolyzed samples because hemolysis can bias many cytokine measurements. Minimize freeze–thaw cycles (aim ≤2); document cycles in the manifest and exclude or flag samples with excessive cycles during analysis.
What dilution strategy should I use if an analyte reads out of range?
Pilot a small set of samples neat and at 1:2–1:10 dilutions to identify high‑abundance markers. Re‑run individual analytes or samples at the appropriate dilution when values exceed the upper linear range; record final dilution factors used for pg/mL reporting.
How are LOD/LOQ handled and how should values below LOD be reported?
Derive LOD/LOQ per assay/plate from negative controls (commonly mean + 3 SD) or follow the manufacturer's validation. Report values below LOD with a clear flag (do not silently impute) and pre‑specify handling rules in the analysis plan (e.g., report as "<LOD," perform sensitivity analyses if imputation is needed).
What QC and normalization controls are essential, and when should I re‑run a plate?
Include manufacturer negative controls, the plasma‑free Calibrator (triplicates), and internal controls in every sample. Add bridge/pooled QC samples across plates. Investigate and consider re‑running when control CVs exceed targets (e.g., within‑plate CVs >15–20%), calibrator/bridge values diverge notably from run medians, or detection rates fall below study thresholds (commonly <80% for a given analyte).
Where can I find step‑by‑step templates for plate QC and data normalization?
Consult the Olink software documentation for NPX workflows and the platform basics, and use practical SOP templates such as the Creative Proteomics guides for sample preparation and data analysis for plate QC and bridging strategies (NPX software; Creative Proteomics: Olink Data Analysis Process).
Can I convert NPX to pg/mL after the fact?
No—NPX is a normalized relative unit and public assay calibration curves on reference pages are illustrative. Converting NPX to pg/mL post hoc is unreliable unless samples were run with the appropriate calibrator on the instrument that produced pg/mL (Signature Q100) and the calibrator/plate mapping is preserved. If absolute units are required, plan for pg/mL reporting at the time of the run.

