
You have the file in your inbox. After weeks of planning, your Olink proteomics screen is complete, evealing a list of dozens of potential biomarker hits. This is a critical first step. But it is only the first step.
As researchers, we understand the temptation to view this NPX (Normalized Protein eXpression) file as the final result. However, this preliminary list of candidates is not a validated discovery. To move toward publication, regulatory submission, or clinical development, you must perform Olink data validation. This guide outlines the essential Olink hits next steps and provides a clear framework for transforming your candidates into confirmed, functional biomarkers.
Relying on unconfirmed NPX data is a significant risk. Olink's PEA (Proximity Extension Assay) technology is a world-class screening tool, but its design creates three distinct gaps. These gaps must be bridged before you can assign true biological meaning to your results.
The Three Gaps Olink Data Alone Cannot Bridge
Gap 1: The Validation Gap (Relative vs. Absolute)
Olink's NPX data is a relative, log₂-scaled value. It is generated by an antibody-based method, which, like any immunoassay, carries a risk of cross-reactivity or non-specific binding.
Top-tier journals and scientific reviewers will not accept this data as standalone evidence. They require orthogonal validation—proof of your finding using a non-antibody-based technology. Without this, your "hit" is just a hypothesis.
Gap 2: The Function Gap (The PTM Blind Spot)
This is the most critical scientific gap. Olink tells you the abundance of a protein has changed. It tells you nothing about its function.
Biological function is governed by protein activity, which is controlled by Post-Translational Modifications (PTMs). A protein's total level may be stable, but its phosphorylation, glycosylation, or ubiquitination state determines if it is "on" or "off."
Your Olink hits show you which proteins are on the field; A dedicated PTM analysis workflow is required to determine whether these proteins are functionally active.
Gap 3: The Discovery Gap (The Closed Panel)
Olink Explore 3072 currently covers ~3,000 proteins; it cannot detect proteins beyond this predefined list. What if the true driver of your disease mechanism is a novel protein, a different isoform, or a PTM-variant that isn't on the panel?
You will miss it completely. This is why Olink data, while excellent, must be integrated with unbiased methods to see the full picture.
The 4-Step Playbook for Olink Data Validation
Transforming a candidate list into a validated discovery requires a systematic, multi-step process. Rushing from NPX data to a conclusion is the most common mistake we see.
Based on our work processing thousands of biomarker samples, we have developed a 4-step framework. This playbook ensures your Olink hits next steps are robust, efficient, and scientifically sound.
Step 1: Data Triage and Bioinformatic Triage
Before investing in laboratory validation, you must first triage your data. A p-value alone is not sufficient.
A common error is to simply take the "Top 10" hits by p-value and proceed. A more robust approach involves deep bioinformatic analysis to distinguish statistical noise from true biological signal.
A. Data QC and Normalization
First, we assess the quality of the NPX data. We check for plate effects, inter-sample variance (CVs), and other technical artifacts. We re-run normalization if necessary to ensure the data is clean.
B. Pathway Enrichment Analysis
We then move beyond single-protein hits. We use pathway analysis tools (e.g., GSEA, IPA, Reactome) to ask a more powerful question:
"Are my hits random, or are they all clustering in one specific biological pathway (e.g., the TNF-alpha signaling pathway)?"
A hit that is part of a significantly perturbed pathway is a far better validation candidate than an isolated "hit" with no biological context.
C. Cross-Corroboration
We also integrate your Olink data with other available -omics data (e.g., transcriptomics). If a protein "hit" also shows a corresponding change in its mRNA transcript, it becomes a high-priority candidate for validation.
Only after this "in-silico" triage do we select a focused list of 10-20 high-confidence candidates for laboratory validation.
Step 2: Gold-Standard Orthogonal Validation (PRM/SRM)
This is the core of Olink data validation. We must now confirm the identity and quantity of our candidates using a non-antibody method. While ELISA is an option, it suffers from the same antibody-dependent limitations as Olink. The widely recognized gold standard is targeted mass spectrometry.
 Protein quantitation by MRM/SRM and PRM. MRM/SRM monitors each precursor ion transition at a time, while PRM analyzes all fragment ions derived from a precursor ion.
A. What is Targeted Mass Spectrometry?
Unlike "unbiased" (shotgun) mass spec, which tries to see everything, targeted mass spec is programmed to hunt for specific peptides from your specific proteins of interest.
The most advanced form of this is Parallel Reaction Monitoring (PRM).
B. The PRM Workflow Explained:
- Sample Digestion: We take your original sample (e.g., plasma or tissue) and digest proteins under denaturing conditions using trypsin.
- Peptide Selection: From our triage list (Step 1), we identify 2-3 unique, high-flying "proteotypic" peptides for each candidate protein.
- Targeted Instruction: We program the mass spectrometer (e.g., an Orbitrap) to only look for those specific parent ion m/z values.
- Targeted Fragmentation: When the instrument "sees" a candidate peptide, it isolates it and fragments it.
- Confirmation: We then confirm the protein's identity by matching all of its fragment ions. This is a highly specific "fingerprint" that is impossible to get from an antibody.
C. Achieving Absolute Quantification
The true power of PRM is its ability to provide absolute quantification.
We do this by adding a known amount of a "heavy" peptide standard (a Stable Isotope-Labeled, or SIL, peptide) for each target. This SIL peptide is chemically identical to the "native" peptide from your protein, but its mass is slightly heavier.
By comparing the signal intensity (Area Under the Curve) of your native peptide to the known quantity of the internal standard, we can calculate the exact concentration of your protein (e.g., in fmol/µg or ng/mL).
This absolute, non-antibody data is the form of evidence most trusted in scientific publications.
Step 3: Functional Characterization (The PTM Workflow)
You have now validated that your protein is present and its quantity has changed. The next question is: So what?
This is where we address the "Function Gap" (Gap 2) by performing a dedicated Olink PTM analysis.
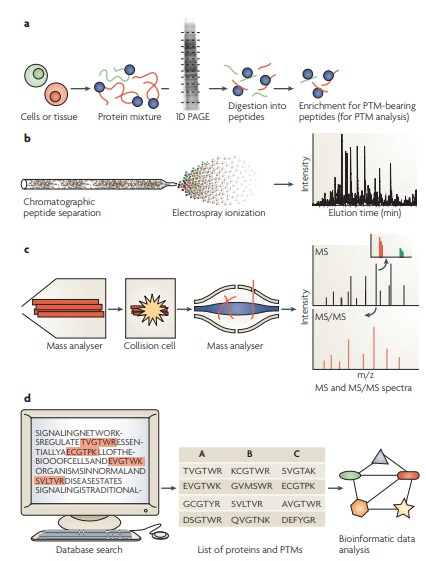 Typical work flow for proteome and PTM analysis using shotgun proteomics.
A. Why PTMs are the Real Story
Numerous proteomics studies have shown that many biologically significant regulatory changes occur through post-translational modifications rather than changes in total protein abundance (Picotti & Aebersold, 2012; Mann & Jensen, 2003; Olsen et al., 2006; Choudhary & Mann, 2010). This underscores the need for complementary PTM analysis to reveal functional mechanisms that standard Olink data alone cannot capture.
B. The PTM Validation Workflow
To understand function, we cannot use the whole protein digest from Step 2. We must perform specific enrichment steps to isolate the modified peptides, which are often present in low amounts.
- For Phosphorylation: We use technologies like a Ti-IMAC (Titanium or Iron Immobilized Metal Affinity Chromatography) column. This column specifically binds to phosphorylated peptides and lets all non-phosphorylated peptides flow through.
- For Glycosylation: We might use lectin-affinity chromatography or other enrichment kits to capture specific glycan structures.
We then analyze these "enriched" fractions using targeted (PRM) or unbiased (shotgun) mass spectrometry. This allows us to pinpoint which protein was modified at which specific amino acid site, providing a direct window into the protein's activity state.
Step 4: Unbiased Confirmation (Bridging the Discovery Gap)
This final, expert-level step answers the "Discovery Gap" (Gap 3). We now ask: What did the Olink panel miss?
The most efficient way to do this is to use the same samples you've already validated and run a deep, unbiased (shotgun) LC-MS/MS analysis.
A. The Power of "Unbiased"
In a shotgun run, the mass spectrometer is not given a target list. It simply scans, fragments, and identifies as many peptides as it can in a "data-dependent" fashion. This allows it to:
- Confirm Olink Hits: We check if the candidates we validated in Step 2 also appear as significant in this unbiased dataset.
- Find Novel Hits: We perform a new statistical analysis to find proteins that were not on the Olink panel but are highly significant in our data.
- Identify Isoforms: We can differentiate between protein isoforms (splice variants) that Olink's antibodies may not have been able to distinguish.
By the end of Step 4, you have a complete, a fully comprehensive dataset. You have your Olink screen, your absolute validation, your functional/PTM context, and a deep unbiased profile. This is the very definition of a publishable, conclusion-driven project.
The Creative Proteomics Integrated Solution
Navigating this 4-step framework requires deep expertise and a diverse set of high-end instrumentation. Switching between different vendors for Olink screening, bioinformatic analysis, PRM validation, and PTM analysis is slow, costly, and risks sample integrity.
Creative Proteomics is among the few providers with in-house expertise across both Olink and LC-MS platforms.We provide a single, seamless workflow from candidate to conclusion.
Our "Olink + Mass Spec" Integrated Workflow Includes:
- Full Olink Service: We run your samples on any Olink platform (Explore, Target).
- Bioinformatic Triage: Our Ph.D. data scientists perform the pathway and cluster analysis (Step 1) to identify high-potential candidates.
- Gold-Standard PRM Validation: We develop custom, targeted PRM assays with SIL standards for your Olink hits to deliver absolute quantification (Step 2).
- PTM Characterization: We perform advanced PTM enrichment and analysis to uncover the functional story behind your hits (Step 3).
- Unbiased Discovery: We run deep, shotgun mass spec on your samples to provide the final layer of confirmation and discovery (Step 4).
You do not just get an NPX file. You receive a single, comprehensive report that contains your screening data, your absolute validation, and your functional insights.
Frequently Asked Questions (FAQ)
Q1: How do you validate Olink NPX data?
Olink NPX data is relative, antibody-based data. The gold standard for validation is an orthogonal, non-antibody method such as targeted mass spectrometry (PRM/SRM).We use Targeted Mass Spectrometry (PRM/SRM) with stable isotope-labeled (SIL) standards to provide absolute quantification (e.g., ng/mL) and confirm the protein's identity via its unique peptide fragments.
Q2: Can Olink detect PTMs (Post-Translational Modifications)?
No. The standard Olink PEA technology is not designed to detect or differentiate PTMs like phosphorylation or glycosylation. It measures total protein abundance. To analyze PTMs on Olink hits, a separate mass spectrometry workflow with specific PTM enrichment (e.g., Ti-IMAC) is required.
Q3: What are the essential "Olink hits next steps"?
The first step is bioinformatic triage to prioritize your hits. The second, non-negotiable step is orthogonal validation, ideally using targeted mass spectrometry (PRM), to confirm the identity and quantity of your candidates. After that, PTM analysis is recommended to understand function.
Q4: Is an ELISA a good way to validate Olink hits?
An ELISA may provide a preliminary validation, but as another antibody-based method, it cannot fully confirm specificity. Since ELISA is also an antibody-based method, it may suffer from the same cross-reactivity issues as the Olink assay. Mass spectrometry (PRM) is superior as it is a non-antibody, "orthogonal" method that validates based on the protein's physical sequence.
Q5: What is the difference between Olink and unbiased (shotgun) mass spectrometry?
Olink is a targeted platform: it is extremely sensitive but can only find the ~3,000 proteins on its pre-defined panel. Unbiased mass spectrometry is a discovery platform: it is generally less sensitive but can identify any protein in your sample (10,000+), including novel proteins or isoforms not on the Olink panel.
Related Resources to Continue Your Validation Workflow
- Principle of PEA Technology – A quick refresher on how PEA works, what NPX means, and why antibody design matters for specificity.
- Understanding Olink's Data Analysis Process: From Raw Data to Insights – QC, normalization, controls, and how NPX is derived before you move to PRM.
- How to Interpret Results from Olink's Serum Proteomics Panels – Practical tips for thresholds, multiple testing, and avoiding common NPX pitfalls.
- How to Integrate Olink Proteomics with Other Omics Technologies – Use RNA-seq, metabolomics, or microbiome data to cross-corroborate your hits pre-validation.
- Olink vs. Mass Spectrometry (LC-MS): A Latest Expert Comparison – An expert deep-dive comparing Olink (PEA) vs. Mass Spectrometry (LC-MS) on sensitivity, PTMs, discovery, and throughput.
- Olink Sample Preparation Guidelines: From Serum to Specialized Samples – Pre-analytical best practices that protect downstream PRM sensitivity and PTM readouts.
- Olink vs SomaScan: Which Proteomics Platform Delivers Greater Sensitivity and Biological Insight? – Platform context to inform your screening-then-validation plan.
- Case Study: Using Olink Proteomics to Investigate Cancer Biomarkers – A real-world example of moving from NPX signals to validated, functional markers.
References
- Picotti, P., & Aebersold, R. (2012). "Selected reaction monitoring-based proteomics: workflows, standards, and case studies." Nature Methods.
- Lundberg, M., et al. (2010). "Homogeneous antibody-based proximity extension assays for high-throughput protein biomarker discovery." Nucleic Acids Research.
- Mann, M., & Jensen, O. N. (2003). Proteomic analysis of post-translational modifications. Nature Biotechnology, 21, 255–261.
- Olsen, J. V., Blagoev, B., Gnad, F., et al. (2006). Global, in vivo, and site-specific phosphorylation dynamics in signaling networks. Cell, 127, 635–648.
- Choudhary, C., & Mann, M. (2010). Decoding signalling networks by mass spectrometry-based proteomics. Nature Reviews Molecular Cell Biology, 11, 427–439.
- Aebersold, R., Mann, M. Mass-spectrometric exploration of proteome structure and function. Nature 537, 347–355 (2016).
- Wang Y, Bednarcik M, Ament C, Cheever ML, Cummings S, Geng T, Gunasekara DB, Houston N, Kouba K, Liu Z, Shippar J. Immunoassays and Mass Spectrometry for Determination of Protein Concentrations in Genetically Modified Crops. J Agric Food Chem. 2024


