

 Submit Your Request Now
Key takeaways
- Absolute quantification and NPX-based profiling are designed for different decisions: calibrated concentrations and prespecified ratios vs relative, within-protein comparisons and discovery.
- NPX is not a concentration scale, cannot be compared across different proteins, and should not be converted to pg/mL without validated calibration.
- In longitudinal or multi-site work, comparability depends on matrix consistency, SOPs, assay versioning, batch design, and reference/bridge samples—not on units alone.
- Many programs benefit from a staged workflow: NPX discovery → candidate prioritization → focused quantitative follow-up → orthogonal validation (when needed).
Introduction
Absolute quantification and NPX-based profiling are often discussed as competing options. In reality, they answer different research questions.
Choose absolute quantification when the study requires calibrated concentration values, a predefined biomarker set, prespecified biomarker ratios, or tightly controlled longitudinal comparisons for a small number of endpoints. Concentration data can also be the right format for follow-up work when candidates are already known and the goal is confirmation rather than broad screening.
Choose NPX-based profiling when the goal is broad discovery and relative comparison of the same protein across samples—supporting differential-abundance testing, clustering, and pathway-level prioritization. NPX is an assay-defined, normalized output; it is not a universal concentration scale.
For many neurodegeneration studies, the most defensible approach is sequential: discover broadly first, then measure a focused panel quantitatively.
Absolute Quantification or NPX? The Decision in One Minute
What Absolute Quantification Is Designed to Answer
Absolute quantification is built for questions that require calibrated concentrations (for example, pg/mL) rather than relative signal intensity. In neurodegeneration biomarker work, this commonly applies when you need:
- Calibrated concentration data for prespecified endpoints.
- A predefined biomarker set that is not expected to change mid-study.
- Biomarker ratios (with an explicit rationale and error plan).
- Focused longitudinal analysis where repeated measurements of selected markers are the main endpoint.
- Quantitative follow-up of previously identified candidates.
A practical caution: absolute units do not automatically guarantee comparability across every run, site, matrix, or assay version. Concentration values are still conditional on calibration materials, matrix effects, acceptance criteria, and versioning.
What NPX-Based Profiling Is Designed to Answer
NPX-based profiling is designed for relative comparison of the same protein across samples within a dataset. If you need a shorthand label, treat it as “NPX vs concentration data”: NPX is relative evidence; concentration is calibrated evidence.
It is most valuable for:
- Broad protein discovery and differential-abundance analysis.
- Pathway enrichment and mechanistic hypothesis generation.
- Candidate prioritization before committing sample volume and budget to follow-up.
As defined in Olink’s documentation on normalization and NPX (see Olink Knowledge Documents), NPX is a normalized output (typically log2-scaled) intended for within-project comparisons. For practical planning, start by writing down your “Olink NPX interpretation” rules: what comparisons are allowed, what covariates you will model, and what QC flags trigger exclusion.
Why the Two Approaches Are Often Sequential
A staged workflow is common in translational neurodegeneration research:
- Broad NPX discovery
- Candidate prioritization
- Focused quantitative follow-up
- Orthogonal validation when needed
| Study objective | Output | Advantage | Limitation |
| Broad discovery | NPX matrix (relative) | Coverage + prioritization | Not a concentration scale; merging across runs needs careful QC |
| Predefined endpoints | Concentrations (assay-calibrated) | Ratio/threshold modeling within-study | Units don’t remove matrix/batch/version effects |
| Discovery → confirmation | NPX then focused quant | Separates exploration from verification | Requires sample reservation for follow-up |
Start with the Study Objective, Not the Panel Name
Broad Mechanistic Discovery
Broad profiling is appropriate when mechanisms are uncertain.
Broad NPX profiling is often justified when mechanisms are uncertain and several domains might contribute—making “neurodegeneration biomarkers Olink” less about a fixed list and more about biological coverage (and more about planning how you will interpret relative profiles).
Broad NPX profiling is often justified when:
- Multiple pathways plausibly contribute (neuroimmune signaling, synaptic biology, vascular mechanisms, protein clearance).
- Known biomarkers cannot capture the full biology you need.
- The goal is signature discovery or hypothesis generation.
Focused Biomarker Measurement
Focused measurement is usually more appropriate when:
- Biomarkers are predefined.
- Concentration data and/or ratios are required.
- The study follows earlier discovery.
- Longitudinal change in selected markers is the primary endpoint.
Exploratory, Verification, and Validation Studies Are Different
These stages should not be used interchangeably:
- Exploratory discovery
- Technical feasibility
- Candidate verification
- Analytical validation
- Clinical validation
Design choices (matrix, QC, deliverables) that are acceptable in discovery are often insufficient for verification, and what is “good enough” for verification may not be appropriate for validation.
Longitudinal and Multi-Site Studies Need More Than a Quantitative Unit
For longitudinal or multi-site cohorts, comparability depends on:
- Matrix consistency
- Collection and processing SOPs
- Storage history and freeze–thaw exposure
- Calibration and controls
- Assay version and lots
- Batch allocation and plate layout
- Reference or bridge samples
- Statistical adjustment informed by batch metadata
In other words, “bridging samples batch effects proteomics” is not an analysis afterthought—it is a design choice that determines whether you can merge or compare runs later.
Even when data are reported in concentration units, uncontrolled pre-analytical and batch effects can dominate. A practical example from PEA studies is the use of bridging controls for batch correction; Smits et al. describe this approach (including recommended numbers of bridging controls) in Scientific Reports (2024).
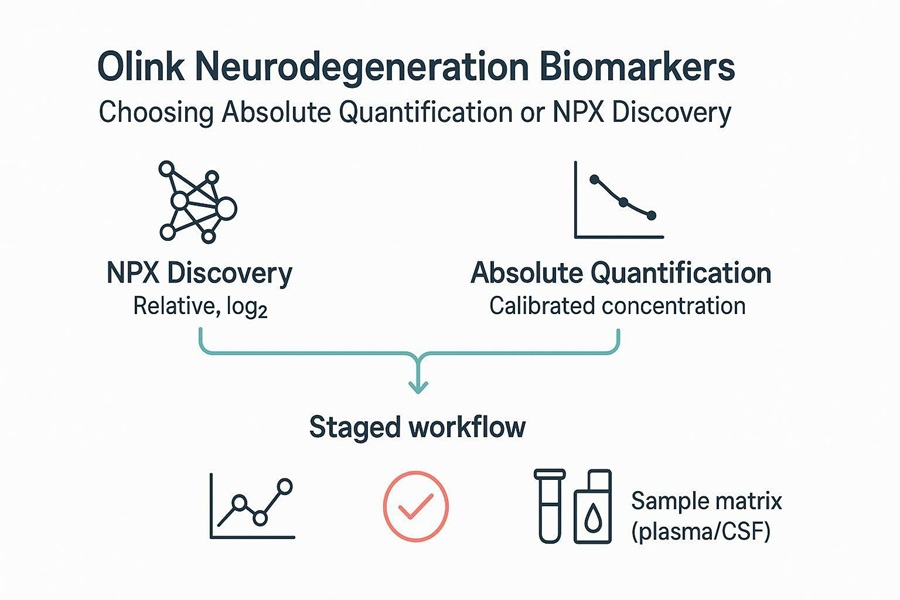 Figure 1. Study-objective framework for selecting broad discovery, focused quantification, or a staged workflow.
From Amyloid Pathology to Neuroaxonal Injury: Interpreting Complementary Biomarker Domains
Neurodegeneration studies often combine biomarkers from different biological domains. Each domain represents a different research dimension—and none is universally sufficient for every neurological disease or objective.
Amyloid-Related Biomarkers and Peptide Ratios
Amyloid-related biology is often discussed with Aβ40, Aβ42, and the Aβ42/Aβ40 ratio as representative examples.
Why interpret Aβ40 and Aβ42 together?
- Joint interpretation can reduce sensitivity to some sources of biological and pre-analytical variability.
- Ratios can help normalize some inter-individual differences when both components are affected similarly.
But ratios introduce their own constraints:
- Measurement error in either component propagates into the ratio.
- If one component is near the quantification range boundary, ratio variability can inflate.
- The ratio should be prespecified (avoid post hoc ratio fishing).
- Matrix and analytical method affect interpretation; plasma and CSF are not interchangeable.
Alzheimer’s-Associated Tau Pathology and pTau217
Phosphorylated tau biomarkers are important in Alzheimer’s-associated research because they provide information related to tau pathology and amyloid-associated processes. Plasma pTau217 has been evaluated in multiple cohorts, including an immunoassay performance report in JAMA Neurology (2024).
Key boundaries:
- pTau217 should not be generalized to every tauopathy.
- Published thresholds cannot be transferred automatically between assays, versions, or cohorts.
- When the endpoint requires within-study quantitative modeling (including prespecified ratio endpoints), concentration data may be more useful than relative comparison alone.
Astrocyte Reactivity and Glial Response
Astrocyte reactivity is a common response to CNS injury and inflammation. GFAP is frequently used as a representative marker.
- GFAP provides information that is different from amyloid- and tau-associated biomarkers.
- GFAP is not disease-specific.
- Interpretation is sensitive to covariates (age and systemic factors) and should be modeled accordingly.
Neuroaxonal Injury Across Neurological Disorders
Neuroaxonal injury biomarkers aim to reflect axonal damage or degeneration. NfL is a commonly studied representative marker.
- NfL is generally interpreted as a marker of axonal injury/neurodegeneration.
- NfL can increase across diverse neurological diseases and injury states.
- NfL does not identify the cause of injury; age and other covariates must be considered.
Combining Biomarker Domains Without Overinterpreting the Results
Different biomarker domains provide complementary information but are not interchangeable. The best combination depends on the disease model, study stage, matrix, and required output type. A multi-marker profile does not automatically establish diagnosis, causality, or disease specificity.
| Biomarker Domain | Representative Examples | Research Dimension | Main Limitation |
| Amyloid-related biology | Aβ40, Aβ42, Aβ42/Aβ40 | Amyloid-associated change | Method- and matrix-dependent |
| AD-associated tau biology | pTau217 | Tau- and amyloid-associated processes | Not universal across tauopathies |
| Glial response | GFAP | Astrocyte reactivity | Limited disease specificity |
| Neuroaxonal injury | NfL | Axonal injury or degeneration | Does not identify the cause |
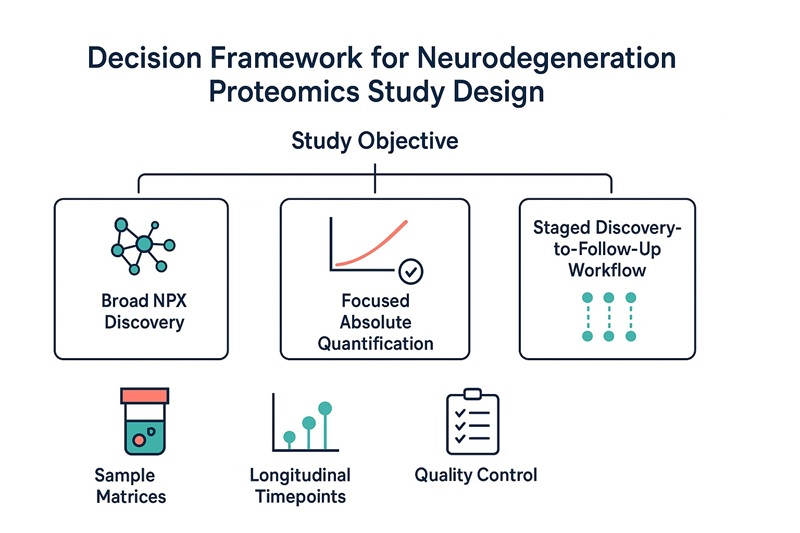 Figure 2. Complementary biological domains represented by commonly studied neurodegeneration biomarkers.
Olink NPX vs absolute quantification: NPX and concentration evidence
What Can Be Compared Within an NPX Dataset
Within a single NPX dataset (after normalization and QC), NPX supports comparison of the same protein across samples:
- Group comparison
- Longitudinal analysis
- Clustering
- Differential-abundance analysis
- Relative fold-change interpretation
A technical evaluation of Olink PEA in longitudinal Alzheimer’s studies emphasizes that NPX values reflect relative abundance rather than absolute quantification (see Carlyle et al., 2022, PMC).
Why NPX Values Cannot Be Compared Across Different Proteins
A higher NPX value for one protein does not mean that protein is more abundant than another protein. NPX is assay- and protein-specific, and assays differ in sensitivity and dynamic range.
Why NPX Cannot Simply Be Converted to pg/mL
Concentration values require assay-specific calibration and a validated quantitative range. NPX is not designed to be converted into pg/mL using a general formula.
Cross-Run, Cross-Site, and Cross-Timepoint Comparability
Cross-run comparability depends on design and documentation:
- Calibration and control strategy
- Matrix consistency
- Assay versioning
- QC acceptance criteria
- Reference/bridge samples
- Batch metadata
- Statistical correction validated by diagnostics
For general guidance on diagnosing and correcting batch effects in proteomics, see the tutorial in Molecular Systems Biology (2021).
Do Not Assume
- NPX is not an absolute concentration.
- NPX values cannot be compared across proteins.
- NPX cannot be converted to pg/mL without validated calibration.
- Separate runs should not be merged without compatibility and QC review.
Focused Quantification, Broad Discovery, or a Staged Workflow?
When Focused Absolute Quantification Fits
Focused quantification fits when biomarkers are predefined, concentrations or ratios are required, repeated measurements are central, and candidates are already identified.
When Broad NPX Discovery Adds Value
Broad NPX discovery adds value when mechanisms remain uncertain, multiple pathways may be involved, the aim is signature discovery, and candidate prioritization is required.
Discovery First, Focused Follow-Up Second
- Broad screening
- Candidate filtering
- Biological prioritization
- Focused quantitative follow-up
- Independent validation when needed
Key Takeaway: Use NPX discovery to decide what matters; use focused quantification to confirm what you will report and model.
When Additional Biological Coverage Is Justified
Additional coverage is justified when the hypothesis explicitly involves neuroimmune signaling, systemic inflammation, synaptic biology, vascular mechanisms, protein clearance, or treatment-response research. Adding panels only to increase protein count increases multiple-testing burden and can dilute interpretability.
Plasma, Serum, CSF, and Limited Sample Volume
Match the Matrix to the Biological Question
Choose the matrix based on biological relevance, collection feasibility, longitudinal accessibility, existing samples, expected abundance, and validated assay performance.
Plasma, Serum, and CSF Are Not Interchangeable
These matrices reflect different compartments and can produce different baseline ranges and matrix effects. Do not pool different matrices without a justified analysis plan.
Allocate Precious Samples Before Testing
Plan sample allocation (volume, dead volume, transfer loss, repeat-testing reserve, backup aliquot, other omics, freeze–thaw limits) before running broad screening.
When a Feasibility Pilot Is Appropriate
A feasibility pilot is appropriate for unusual matrices, very limited volume, uncertain analyte abundance, variable storage history, irreplaceable samples, or multi-platform comparisons.
QC and Deliverables Should Be Defined Before Testing
Calibration Range, LOD, LLOQ, ULOQ, and CV
- LOD: lowest level distinguishable from background
- LLOQ: lowest level quantifiable with defined performance
- ULOQ: upper boundary of quantitative range
- Calibration range: validated span of calibrators
- CV: precision metric; interpretation depends on context and scale
Sample-Level and Assay-Level QC
Define QC flags and exclusion rules before analysis: missingness, out-of-range values, replicate performance, plate/batch structure, and recorded exclusion reasons.
Decide the Required Data Deliverables
| Deliverable | What it contains |
| Concentration table | concentrations + units + flags |
| NPX matrix | NPX values + QC flags |
| Biomarker ratio table | prespecified ratios + propagated flags |
| QC report | sample/assay pass-fail, missingness, outliers |
| Statistical analysis report | models, covariates, correction |
| Metadata dictionary | field definitions and allowed values |
Metadata for Longitudinal or Multi-Site Studies
Include subject/model ID, group, timepoint, site, matrix, collection device, processing time, storage history, freeze–thaw count, plate/batch, and relevant covariates. Incomplete metadata can make technically valid measurements difficult to interpret.
A Practical Decision Framework
| Research Scenario | Preferred Starting Strategy | Main Reason | Main Caution |
| Unknown mechanisms | Broad NPX discovery | Wider biological coverage | Requires candidate confirmation |
| Predefined biomarkers | Focused quantification | Direct quantitative output | May miss additional pathways |
| Longitudinal focused study | Controlled quantitative workflow | Supports repeated-measurement goals | Requires harmonized collection and QC |
| Discovery followed by confirmation | Staged workflow | Separates discovery from verification | Samples must be reserved |
| Limited, irreplaceable material | Small feasibility pilot | Protects samples | Pilot findings may not support broad inference |
Checklist:
- What biological question should the data answer?
- Are the biomarkers predefined?
- Are concentrations or relative differences required?
- Are biomarker ratios planned?
- Will results be compared across timepoints or sites?
- Which matrix and volume are available?
- What QC and analysis deliverables are needed?
Method Boundaries and Research-Use-Only Interpretation
These data can support research comparisons, biomarker prioritization, pathway exploration, longitudinal research analysis, hypothesis generation, and follow-up study planning. They cannot independently establish clinical diagnosis, treatment selection, universal cutoffs, clinical utility, causality, or disease specificity.
Frequently Asked Questions
What is the difference between NPX and absolute concentration data?
NPX is an assay-defined, normalized output designed for relative comparison of the same protein across samples within a dataset. Absolute concentration data are assay-calibrated values intended for concentration-anchored interpretation. Both still require explicit QC, metadata, and comparability planning—especially across runs and sites.
When is absolute quantification needed in a neurodegeneration study?
Absolute quantification is most useful when biomarkers are predefined and the endpoint depends on calibrated concentrations, prespecified ratios, or controlled longitudinal tracking of a small marker set. It is also common in verification phases after discovery, where you want confirmation under tighter, predefined criteria.
Can NPX values be converted directly to pg/mL?
Not generally. Converting to concentration requires assay-specific calibration and a validated quantitative range in the chosen matrix. NPX is not designed as a universal concentration scale, so generic conversions create numbers that look interpretable but are not analytically justified.
Can NPX values be compared across different proteins?
No. NPX values are protein-assay specific. A higher NPX for one protein does not imply higher abundance than another protein because assays have different sensitivity and dynamic ranges. NPX comparisons should be restricted to the same protein across samples within the same normalized dataset.
Should a study begin with broad discovery or focused biomarker measurement?
Start with the study objective. If mechanisms are uncertain and you need broad coverage, NPX discovery is a strong starting point. If biomarkers are predefined and you require concentrations or ratios, focused quantification is more appropriate. Many studies use a staged workflow to keep discovery and confirmation distinct.
Can focused quantification follow broad discovery?
Yes—and it often should. NPX discovery prioritizes candidates, while focused follow-up supports prespecified endpoints and tighter QC definitions. The main operational requirement is reserving sample volume for confirmation and, when needed, orthogonal validation.
Why are Aβ42 and Aβ40 often interpreted as a ratio?
Aβ42 and Aβ40 are biologically linked, and ratios can reduce sensitivity to some sources of variation compared with single-peptide values. However, ratios propagate error from both components and can be unstable near quantification limits. Ratios should be prespecified and interpreted with matrix- and method-awareness.
Do pTau217, GFAP, and NfL represent the same biological process?
No. pTau217 is typically discussed within Alzheimer’s-associated tau pathology and amyloid-related processes. GFAP reflects astrocyte reactivity/glial response, and NfL reflects neuroaxonal injury. These domains can overlap in disease but are not interchangeable and are not disease-specific on their own.
Can plasma, serum, and CSF be analyzed in the same project?
They can, but they should not be treated as interchangeable. Plasma/serum and CSF are distinct compartments with different baseline ranges and matrix effects. If multiple matrices are included, plan distinct hypotheses and analysis strata rather than pooling them without justification.
Can results from different runs, sites, or timepoints be compared?
Only if comparability is designed. That typically requires harmonized SOPs, matrix consistency, assay version control, balanced batch allocation, and reference/bridging samples. Statistical correction should be validated with diagnostics rather than assumed.
What if a biomarker is frequently below the quantification range?
Treat it as a design and interpretation signal. It may reflect low abundance in the chosen matrix or sensitivity limits. Options include changing matrix, focusing on different markers, using an assay with a better-suited range, or analyzing patterns cautiously with transparent missingness rules.
How much sample should be reserved for repeat testing?
Reserve enough volume to rerun key samples, confirm outliers, and perform orthogonal validation when needed. Practically, keep a backup aliquot plus a repeat-testing reserve after accounting for dead volume and transfer losses. The exact volume depends on assay requirements and the follow-up plan.
When is an additional inflammation-focused panel useful?
Additional coverage is useful when the hypothesis explicitly involves neuroimmune signaling, systemic inflammation, vascular biology, or treatment-response mechanisms. Adding panels only to increase protein count increases multiple testing and can reduce decision clarity unless you have an interpretation plan for that extra domain.
When is a pilot study appropriate?
A pilot is appropriate when samples are irreplaceable, volume is limited, storage history is uncertain, or the matrix is unusual. It is also useful when comparing platforms. A pilot protects sample material and clarifies QC behavior, but its findings may not generalize to broad inference.
Conclusion and CTA
Measurement strategy should follow the research objective. Use NPX-based profiling for broad discovery and within-protein comparisons, use absolute quantification when calibrated concentrations or prespecified ratios are required, and consider a staged workflow when you need discovery and confirmation in one program.
Before testing, define study objective, biomarker or pathway priorities, sample matrix, sample number, available volume, groups and timepoints, required output type, longitudinal or multi-site requirements, and the QC and bioinformatics deliverables needed to interpret results.
Author: Caimei Li, Senior Scientist at Creative Proteomics
For Research Use Only. Not for use in diagnostic procedures.