

 Submit Your Request Now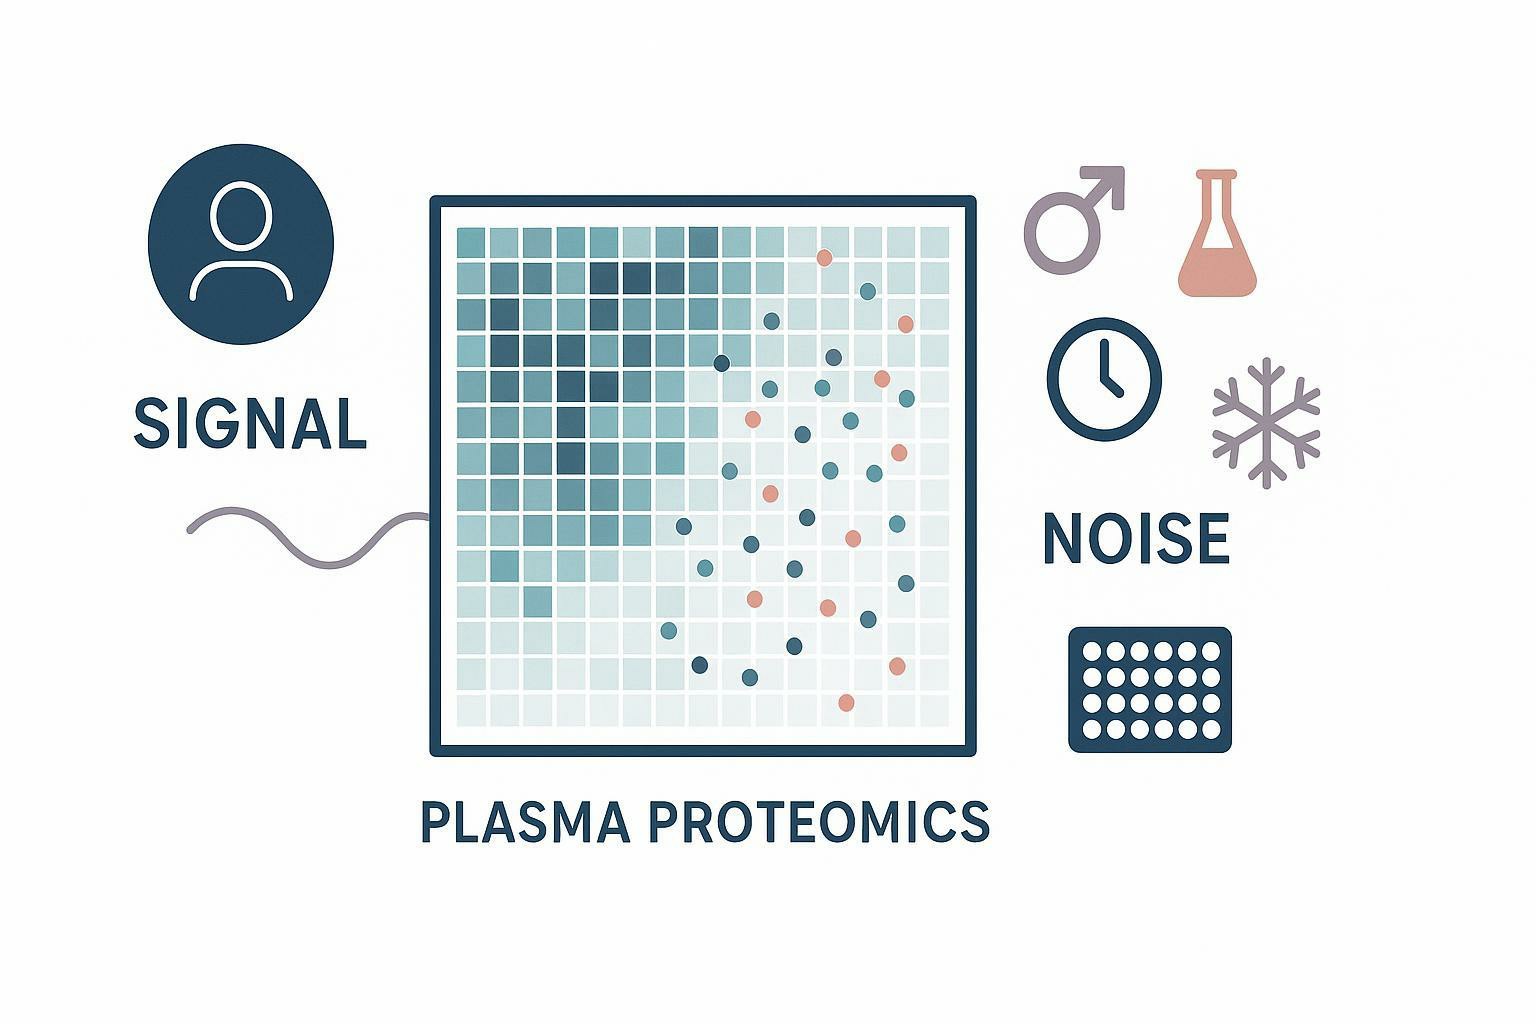
Introduction
A statistically significant protein difference is not automatically a disease-related signal. In high-dimensional protein profiling, it is easy to confuse a reproducible difference with a reproducible mechanism. Circulating proteins shift for reasons that can be unrelated to the endpoint you care about.
Olink protein measurements may also be influenced by age, sex, BMI and metabolic status, medication and comorbidities, and short-term physiological state. The sample matrix matters, and collection and processing conditions can reshape what is measurable before the assay even begins. Storage history, freeze–thaw exposure, and multi-site logistics introduce additional structure. After measurement, plate effects, batch effects, calibration differences, and the way missing or below-range values are handled can further move estimates. Low-abundance targets add another layer: measurement uncertainty can be large enough that small biological effects become hard to interpret without tight baseline control.
This article shows how to identify, control, and report these sources of variation before you interpret biological differences. The goal is not to eliminate variability. It is to separate disease biology from demographic, preanalytical, and analytical noise so conclusions remain defensible.
Not Every Protein Difference Is a Disease Signal
Biological variation
Some differences are the signal you want: shifts driven by disease biology, treatment exposure, disease stage, immune status, or broader physiological state. In practice, these effects can be real and still hard to interpret when they overlap with other structured drivers. For example, treatment exposure can be confounded with sampling time; late-stage disease can be confounded with hospitalization and medication.
Demographic and physiological variation
Participant characteristics can affect circulating proteins independently of your primary endpoint. Age-associated changes can touch inflammatory, vascular, metabolic, and neurodegeneration-linked proteins. Sex-related differences can reflect hormones, immune set points, and body-composition effects. BMI and metabolic status can shift adipose-related inflammation and lipid-linked pathways.
If cases and controls are imbalanced on these factors, a “disease signature” may actually be a demographic signature. Even with balanced groups, these variables can change variance, not only means, making some cohorts look noisier.
Preanalytical variation
Preanalytical variation is introduced before the assay begins. It includes collection, processing, transportation, and storage. Delays in centrifugation or freezing, temperature excursions, hemolysis, residual platelets, and freeze–thaw history can create protein-specific changes that are systematic rather than random.
Analytical variation
Analytical variation includes assay variability, plate effects, batch effects, calibration differences, and missing/below-range handling. In high-dimensional datasets, modest technical drift can produce apparent group separation in PCA. If biological groups are confounded with plate or batch, the dataset may become biased beyond repair.
Reliable interpretation requires the biological signal to be separated from demographic, preanalytical, and analytical variation.
Demographic and Physiological Factors That Shape Protein Profiles
Age
Age is a pervasive covariate in circulating proteomics. Many inflammatory proteins change with age, but so do vascular, metabolic, and neurodegeneration-related markers. Age can also change variability, which matters when cohorts differ in age spread.
Plan for age at design and analysis: match groups when feasible; stratify when distributions differ; include age in regression models; and run sensitivity analyses to confirm conclusions are not driven by age structure.
Sex
Sex should not be treated only as a descriptive variable. Hormonal influences, immune differences, and body-composition differences can generate sex-specific protein patterns. If sex distributions differ across groups, interpret group differences with caution and consider stratified reporting or interaction testing when biologically plausible.
BMI and metabolic status
BMI is an imperfect proxy, but metabolic status can still be a major driver. Insulin resistance, lipid metabolism, and adipose-related inflammation can shift circulating proteins across immune and vascular pathways. In many therapeutic areas, metabolic status is correlated with both disease risk and disease severity, raising confounding risk.
Decide up front whether metabolic variables are nuisance covariates, causal intermediates, or key biology. That decision determines whether adjustment clarifies the signal or removes it.
Medication, infection, and comorbidity
Medication exposure is a frequent driver of protein variability. Anti-inflammatory drugs can blunt inflammatory proteins; metabolic drugs can shift lipid- and inflammation-linked markers. Recent infection can move immune proteins for weeks. Renal or hepatic impairment can change baseline concentrations through clearance effects. Cardiovascular conditions and other inflammatory diseases can introduce overlapping signals.
Treat these exposures as first-class metadata. If coverage is incomplete, document what is missing and prespecify sensitivity analyses around what you can measure.
Sampling time and physiological state
Fasting status, time of day, recent exercise, and acute illness can shift circulating proteins. Where relevant, menstrual or hormonal status adds structured variation. If one group is systematically sampled differently, “endpoint effects” can be sampling effects.
The pragmatic stance: record these variables whenever operationally possible, then test whether they explain variance or bias group comparisons.
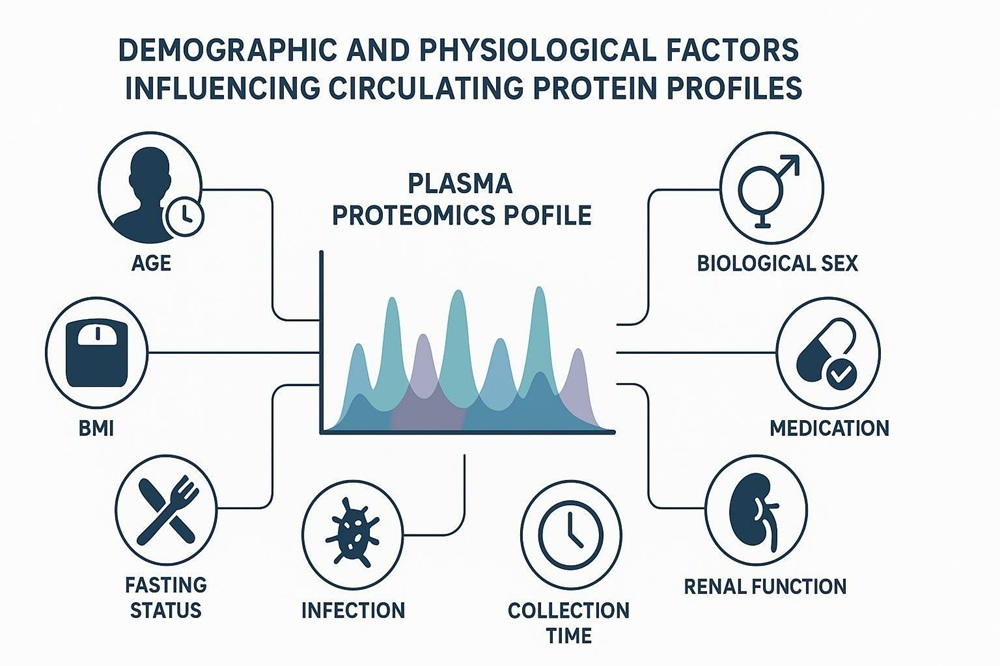 Figure 1. Demographic and physiological variables that may influence circulating protein measurements.
Preanalytical Variables Can Reshape the Dataset
Serum versus plasma
Serum and plasma are different matrices and may produce different protein profiles. Coagulation and platelet activation during serum preparation can change platelet- and coagulation-linked proteins relative to plasma, while plasma retains clotting factors and differs in background composition.
Do not assume values are directly interchangeable. If both matrices exist, treat matrix as a design variable: analyze separately, adjust explicitly, and run sensitivity analyses. Many studies benefit from committing to a single matrix from the start.
Anticoagulant and collection device
Tubes and anticoagulants can affect protein stability, cellular activation, matrix background, and comparability between samples. Even when effects are small for most targets, a subset can be sensitive.
Standardize collection devices across sites and record tube/anticoagulant type as metadata. If mixed devices are unavoidable, treat them like batch factors rather than footnotes.
Processing delay
Delayed centrifugation or delayed freezing can drive cellular leakage, proteolysis, platelet activation, and sustained release of inflammatory proteins from blood cells. Effects are often protein-specific and amplified by temperature variation.
Avoid universal “acceptable delay” claims unless they are validated for your context. Instead, record timestamps (collection, processing, freezing), model delay as a covariate when appropriate, and test sensitivity by excluding long delays or clearly flagged samples.
Centrifugation and cellular contamination
Residual platelets, hemolysis, and leukocyte contamination can introduce structured artifacts. Inconsistent centrifugation protocols change cellular carryover, and platelet contamination is particularly relevant for platelet-enriched proteins.
QC should include objective checks (hemolysis metrics when available, sample-level flags, and protein-level patterns consistent with cellular contamination) rather than relying only on stated SOP compliance.
Storage and freeze–thaw history
Record storage temperature, storage duration, number of freeze–thaw cycles, prior aliquoting, and thawing conditions. Some proteins are stable, others are not.
A study evaluating preanalytical stressors in Olink measurements reported that hemolysis affected a large fraction of targets while repeated freeze–thaw cycles affected a smaller subset (see Candia et al. on hemolysis and freeze–thaw effects in Olink data (2025)). Use this kind of evidence to justify why preanalytical QC belongs in the primary analysis plan.
Multi-Site and Remote Collection Add Another Layer of Variation
Standardize collection kits and instructions
Across sites or participant-collection pathways, standardization reduces avoidable variability and improves interpretability. Align tubes, labels, timing instructions, processing protocols, and storage materials.
Record shipping time and temperature
Document collection time, dispatch time, receipt time, shipping temperature, temperature excursions, and packaging conditions. Without this metadata, remote collection becomes hard to audit, and site effects become hard to diagnose.
Clinic-collected and participant-collected samples may not be equivalent
Clinic and participant collection can differ in collection quality, processing delay, temperature control, sample volume, and metadata completeness. Even when a device is nominally the same, operations may not be.
When to run a logistics pilot
Run a pilot when samples are mailed, multiple sites are involved, a new collection device is used, conditions are difficult to standardize, or samples are irreplaceable. The goal is to discover failure modes early enough to change SOPs or packaging.
When datasets should not be directly combined
If collection methods differ substantially, direct combination can create spurious differences. In these cases, separate analysis or prespecified sensitivity testing is often safer than pooling and hoping adjustment fixes it.
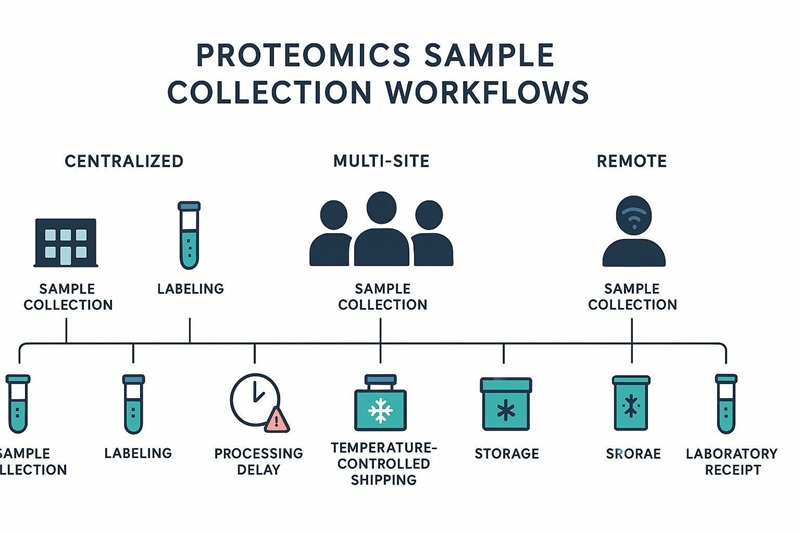 Figure 2. Preanalytical variation points in centralized, multi-site, and remote sample collection.
Low-Abundance Proteins Require Careful Interpretation
LOD, LLOQ, and missingness are different concepts
Limit of detection (LOD) is the lowest concentration distinguishable from background noise; the lower limit of quantification (LLOQ) is the lowest concentration that can be quantified with acceptable precision and accuracy. They are related but not interchangeable (see Armbruster and Pry’s LoB/LoD/LoQ definitions (2008)).
A missing measurement is different again. Missingness can reflect true low abundance, censoring below a reporting threshold, matrix interference, degradation, or technical failure.
Low concentration is not the same as measurement failure
Low or absent signal can reflect true biology, matrix effects, sensitivity limits, degradation, or technical failure. Treating all low values as failures discards biological possibilities. Treating all low values as biology ignores measurement constraints.
Unequal missingness can bias group comparisons
If one group has more below-range measurements, group comparisons can be biased. Below-range values are effectively censored observations, and naive exclusion or substitution can distort group differences and variance (see statistical methods for assays with limits of detection (2011)).
Avoid automatic or unjustified imputation
Replacing missing values with a single constant can distort group differences, correlations, variance, and classification models. If explicit values are required, consider approaches designed for detection limits and validate conclusions through sensitivity analyses (see multiple imputation for data subject to limits of detection (2014)).
Small biological changes need strong baseline control
Small effect sizes demand strong baseline control: well-matched groups, consistent handling, reliable QC, and a prespecified analysis plan.
Key Takeaway: For low-abundance targets, start interpretation with quantification-range behavior and missingness patterns, not only p-values.
Study Design Can Protect the Biological Signal
Match or stratify important covariates
Match or stratify covariates that plausibly affect circulating proteins and correlate with your endpoint: age, sex, BMI, site, medication exposure, disease stage, and key comorbidities.
Randomize samples across plates and batches
Do not separate cases, controls, timepoints, or treatment groups by plate. Batch effects are pervasive in high-throughput data, and confounding biological groups with batches can create artifacts that are hard to correct after the fact (see Leek et al. on batch effects in high-throughput data (2010)). Proteomics biomarker literature emphasizes blocking and randomization as core design principles to avoid confounding (see blocking and randomization in proteomic biomarker discovery (2012)).
Use pooled or bridge samples where appropriate
Pooled or bridge samples can help monitor consistency, identify drift, and support batch review. They do not solve every batch issue, especially when design confounding is severe.
Collect metadata before testing
A minimum metadata plan may include sample ID, group, timepoint, matrix, collection site, collection time, processing delay, storage history, freeze–thaw count, and key demographic covariates. Treat metadata as part of the dataset.
Use models that match the study structure
Use models that match the study structure: multivariable regression for covariate adjustment; mixed-effects models for site and batch structure; repeated-measures analysis for longitudinal designs; and prespecified sensitivity analyses. Keep implementation software-agnostic. The aim is to reflect how data were generated.
Pro Tip: Run a metadata-first review before differential testing. If site or processing delay separates samples more than your endpoint, interpretation should pause.
How to Use Population Reference Data
Reference data provide context, not a replacement for controls
Public reference data can help contextualize common distributions, demographic associations, expected variability, and outliers. It does not replace study-specific controls collected under the same SOPs.
Population and ancestry differences matter
Population structure, geography, lifestyle, environment, and genetic background can shift baseline proteins. If the reference population differs, treat reference ranges as context rather than as a benchmark.
Platform and assay version must be compatible
Review reference datasets for platform, panel version, sample matrix, normalization method, and processing. If these differ, avoid direct numeric comparisons.
Scope and limitations for Olink panels and normalization
Interpretation depends on how NPX values were generated and what panel/version was used. Differences in panel content, assay version, calibration strategy, and normalization pipeline can change scale, missingness behavior, and comparability.
Practical guardrails:
- Avoid direct numeric comparisons across studies unless panel/version and normalization are compatible and documented.
- When combining data across sites or time, prespecify a harmonization plan (bridge samples, consistent QC rules, and the same normalization approach).
- Report the panel name/version, sample matrix, and normalization steps alongside any reference-range or population-context discussion.
Universal reference ranges can be misleading
One range rarely applies across populations, age groups, matrices, assays, and study designs. Treat ranges as a starting point for plausibility checks.
Deliverables That Reveal Confounding and Technical Noise
PCA and sample-level outlier review
PCA and clustering can reveal batch separation, site effects, matrix effects, and extreme samples. Do not treat PCA separation as proof of biological causality.
Missingness and quantification-range summaries
A QC report should include missingness per protein, missingness per sample, below-range frequency, group-specific missingness, and excluded features.
Covariate association tables
Summarize associations between protein levels and age, sex, BMI, site, processing delay, and storage history. These tables surface plausible alternative explanations.
Site and batch effect plots
Show plate-level distributions, batch boxplots, site-level comparisons, and QC sample trajectories or drift plots when available. If adjustment is applied, report what changed.
Sensitivity analyses
Examples include excluding poor-quality samples, adjusting additional covariates, analyzing sites separately, and comparing complete-case with alternative missing-data strategies.
For teams that want a consolidated interpretation workflow, see the site’s overview on interpreting Olink serum proteomics results.
If you need help turning these QC deliverables into a reproducible workflow, Creative Proteomics supports Olink proteomics study planning and downstream bioinformatics/QC reporting, including covariate review, batch diagnostics, and sensitivity analysis packages (see the overview on interpreting Olink serum proteomics results).
A Practical Framework for Separating Signal from Noise
A short illustrative example: when a “signature” disappears
Consider an illustrative case in which cases are older on average and were processed later in the day, while controls were processed immediately. A differential analysis flags an inflammatory protein set as “disease-associated.”
A metadata-first review shows:
- Age explains a large fraction of variance for the same proteins.
- Processing delay correlates with the case label.
- Samples also separate by plate because cases were preferentially loaded together.
After re-running the model with age and processing delay as covariates (and applying a batch-aware design), the apparent signature shrinks or disappears—suggesting the original result was driven by cohort structure and handling rather than disease biology.
The point is not that adjustment always removes the signal. It is that without these diagnostics, you can’t tell whether you are looking at biology or operations.
Decision guide: serum vs plasma
- If you have only one matrix (serum or plasma): analyze within that matrix and report it explicitly.
- If you have both matrices:
- If matrix is perfectly balanced across groups and sites: you may model matrix as a covariate and run matrix-stratified sensitivity checks.
- If matrix is imbalanced or aligned with site/plate: avoid pooling; analyze separately or treat as a primary stratification variable.
- If you plan to compare against external reference data: require matrix and normalization compatibility before comparing distributions.
Decision guide: below-range values and missingness
- Start by separating concepts: below-range (censoring) vs missingness (mechanisms vary).
- If below-range frequency is low and balanced across groups: complete-case analysis may be acceptable, but still report frequencies.
- If below-range frequency is moderate/high or differs by group:
- Avoid single-constant substitution.
- Consider censored-data approaches or detection-indicator analyses.
- Validate conclusions with sensitivity analyses using at least two reasonable handling strategies.
| Observed Pattern | Possible Explanation | Recommended Review |
| Protein differs between groups | Disease biology or demographic imbalance | Adjust age, sex, BMI, and key covariates |
| Samples cluster by site | Collection or processing differences | Review site SOPs and batch structure |
| One group has more missing values | True low abundance or technical bias | Review LOD, QC, and missingness mechanism |
| Longitudinal change appears only in one batch | Batch or timepoint confounding | Check plate allocation and bridge samples |
| Remote samples differ from clinic samples | Collection and shipping variation | Review device, temperature, and processing metadata |
| Small effect with high variability | Weak biological signal or uncontrolled noise | Perform sensitivity and power analysis |
Checklist:
- Are groups demographically comparable?
- Were matrices and collection devices consistent?
- Were samples processed and stored consistently?
- Are cases and controls balanced across batches?
- Are low-abundance proteins being handled appropriately?
- Are important covariates included in the model?
- Do sensitivity analyses support the same conclusion?
Copy-and-paste templates
Minimal metadata checklist
| Category | Fields to record |
| Sample identity | Sample ID, participant ID (if applicable), visit/timepoint, case/control/group label |
| Demographics | Age, sex, BMI (or metabolic measures when available) |
| Clinical context | Key medications, major comorbidities, recent infection/acute illness flag |
| Collection | Collection date/time, fasting status (if relevant), collection site, collector/care pathway |
| Matrix & device | Serum/plasma, tube type, anticoagulant, lot number (if feasible) |
| Processing | Centrifugation protocol, processing timestamps, time-to-spin, time-to-freeze |
| Shipping & temperature | Ship date/time, receipt date/time, temperature log/excursions, packaging conditions |
| Storage | Storage temperature, storage duration, aliquot history, freeze–thaw count |
| Assay & run | Panel/version, plate ID, batch/run ID, operator (if tracked), bridge/QC sample IDs |
| Data processing | Normalization method, missing/below-range handling rules, QC exclusion criteria |
Plate randomization template
Use a simple allocation table to ensure cases/controls, sites, and timepoints are mixed within each plate.
| Plate | Well range | Group mix target | Site mix target | Notes |
| Plate 1 | A01–H12 | Balanced cases/controls | Balanced across sites | Include bridge/QC samples |
| Plate 2 | A01–H12 | Balanced cases/controls | Balanced across sites | Keep paired samples blocked as needed |
If you have paired/longitudinal samples, block pairs together within plates while still balancing groups across plates.
Frequently Asked Questions
How much Olink protein variation is expected in healthy populations?
It depends on the protein and the cohort. Use matched controls and covariate association review to contextualize observed variability rather than relying on a single “expected” value.
Which participant covariates should be collected?
At minimum: age and sex. Strongly consider BMI (or better metabolic measures if available), key medications, major comorbidities, and recent infection status. For multi-site or longitudinal cohorts, add site identifiers and timepoint definitions.
Can age and sex affect circulating protein levels?
Yes. They can shift both baseline levels and variance. Interpret group differences alongside balance checks and covariate-adjusted models.
Should BMI be included as a covariate?
Often, but not automatically. If BMI is a confounder, adjustment can reduce bias. If BMI is central to the biology of interest, prespecify a model that avoids adjusting away the signal.
Can serum and plasma samples be combined?
Only with explicit handling of matrix differences. Many cohorts benefit from analyzing matrices separately or demonstrating stability through sensitivity analyses.
How much processing delay is acceptable?
There is no universal threshold that applies across proteins and workflows. Record timestamps and evaluate delay effects empirically within the study, including prespecified sensitivity analyses.
Do freeze–thaw cycles affect protein measurements?
They can, often in a protein-specific way. Record freeze–thaw history and assess whether conclusions change when samples with heavier handling are excluded.
Can remotely collected samples be compared with clinic-collected samples?
Sometimes, but do not assume equivalence. Compare collection pathways explicitly and avoid pooling without diagnostics and sensitivity testing.
Must every site use the same collection device?
For comparability, yes. If not possible, record device type and SOP details and model or stratify by site/device.
When should a logistics pilot be performed?
When samples are mailed, multiple sites are involved, a new device is introduced, conditions are hard to standardize, or samples are irreplaceable.
What if a protein is frequently below the quantification range?
Report below-range frequency and group differences. Consider censored-data approaches or detection-indicator analyses rather than single-constant substitution.
Can public reference data replace matched controls?
No. Reference data provide context, not a substitute for controls collected under the same SOP and analytical structure.
How can technical and biological variation be distinguished?
Combine design controls (matching, randomization) with diagnostics (PCA, batch plots, missingness summaries) and prespecified sensitivity analyses.
Which plots should be included in the QC report?
Include PCA/clustering, missingness and below-range summaries, plate/batch distributions, site comparisons, QC trajectories (if available), and the prespecified sensitivity analyses.
References
- Candia J, et al. Hemolysis and freeze–thaw effects in Olink data (2025).
- Armbruster DA and Pry T. LoB, LoD, and LoQ definitions and usage (2008).
- Guidance on censored measurements: Statistical methods for assays with limits of detection (2011).
- Guidance on missing/below-range handling: Multiple imputation for data subject to limits of detection (2014).
- Leek JT, et al. Batch effects in high-throughput data (2010).
- Proteomic biomarker design principles: Blocking and randomization in proteomic biomarker discovery (2012).
Conclusion and CTA
Protein differences may reflect biology, demographics, sample handling, or analytical variation. Study design and metadata collection are essential for separating these effects. Low-abundance proteins and multi-site collections deserve extra caution. Plan QC deliverables and sensitivity analyses before interpreting disease-related signals.
Prepare the cohort structure, demographic variables, collection SOPs, sample history, batch plan, and expected analysis outputs before beginning a research-use-only Olink study.
If your team wants a second set of eyes on study design, preanalytical SOPs, or Olink data QC/interpretation (especially for multi-site cohorts, mixed matrices, or below-range-heavy panels), Creative Proteomics can support Olink proteomics and integrated multi-omics projects with end-to-end analysis and bioinformatics deliverables. For service details, see Olink proteomics assay services at Creative Proteomics.
For Research Use Only. Not for use in diagnostic procedures.
Editorial note: This article provides methodological considerations for research planning, QC, and interpretation. It does not provide medical advice and should not be used to support clinical diagnosis or treatment decisions.
Author
CAIMEI LI
Senior Scientist at Creative Proteomics
CAIMEI LI on LinkedIn