
Choosing an Olink Explore HT provider is not a "bigger panel" or "faster sequencer" decision. For biopharma teams planning a pilot and then scaling to hundreds or thousands of samples, the real risk is signal drift—when biology is confounded by plate effects, batch effects, and preanalytical variability. The provider you select must be able to demonstrate cross-batch comparability with audit-ready evidence, not just deliver an NPX file.
If you're evaluating end-to-end options, start with our Olink proteomics services overview to see how we structure execution, QC, and reporting for research-use-only studies.
At Creative Proteomics, our Olink Explore HT panel service is built around four buyer-critical pillars:
- Bridging expertise that keeps multi-plate, multi-run cohorts comparable
- Audit-ready QC with explicit thresholds and corrective actions
- Predictable execution with transparent batching and milestone-based delivery
- Multi-omics integration that turns NPX into mechanism and decisions
Why Olink Explore HT Projects Fail in Scale-Up (and How to Prevent It)
Most scale-up failures happen for reasons that are invisible in small pilots. The root cause is rarely "not enough proteins" or "not enough sequencing." It's that pilot ≠ scale: as you expand across plates, runs, weeks, and sometimes sites, unmodeled technical structure can start to dominate biology unless you actively control for it.
What fails in the real world
In pilot mode (e.g., 40–200 samples), you can get clean-looking results even with imperfect randomization or minor preanalytical heterogeneity. When you scale to 600–5,000+, those same weaknesses amplify:
- Plate/batch effects accumulate and create false clusters
- Near-LOD targets inflate CVs and missingness for subsets of samples
- Preanalytical drift (processing window, freeze–thaw, storage) shifts detectability and call rate
- Inconsistent metadata and covariate definitions block downstream stratification and integration
How to prevent scale-up drift
Scale-up success requires two safeguards from day one:
- Bridging by design (not as an afterthought)
- Audit-ready QC with clear pass/fail rules and corrective actions
Suggested figure to insert: Pilot vs scale-up "batch effect" schematic — PCA/UMAP showing minimal clustering in pilot, then plate/batch clustering emerging at scale when bridging is absent or underpowered.
Suggested KPI callout: Risk factor → expected impact
- Preanalytics variability → call rate ↓, missingness ↑
- Freeze–thaw burden → near-LOD dropouts ↑, CV ↑
- Weak plate randomization → PCA/UMAP plate separation ↑
- Near-LOD targets → assay-level CV ↑, replicate discordance ↑
Creative Proteomics' Core Differentiator: Bridging Expertise That Protects Cohort Integrity
When decision-makers ask, "Can I trust cohort-wide comparisons across plates and time?" the only credible answer is a bridging SOP with measurable outcomes. We treat bridging as a designed control system that connects plates and batches into a single comparable dataset.
Bridging as an executable SOP (what we do)
A practical bridging plan includes:
- Bridge sample strategy: a defined bridge sample plan per batch, placed across plates in consistent, documented positions
- Plate layout discipline: controls and bridges placed to support both QC and harmonization diagnostics
- Randomization: a locked randomization seed and script( or an equivalent reproducibility artifact)
- Centering and normalization loop: executed with diagnostics that confirm whether residual plate/batch structure remains
How we prove bridging worked (what you'll see)
We don't ask you to "trust the pipeline." We show audit-ready evidence:
- Bridge-sample correlations reported as distributions (per batch and overall), with outlier plates/batches flagged for investigation when correlations fall outside the pre-defined acceptance band for the study matrix
- Residual plate/batch separation checks in PCA/UMAP post-normalization (no systematic plate-driven clustering)
- Variance attribution views confirming batch is not a dominant driver after harmonization
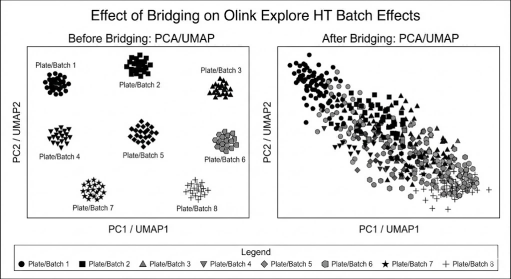 Illustrative PCA/UMAP comparison showing plate/batch-driven clustering before harmonization and improved cross-batch mixing after bridging and normalization.
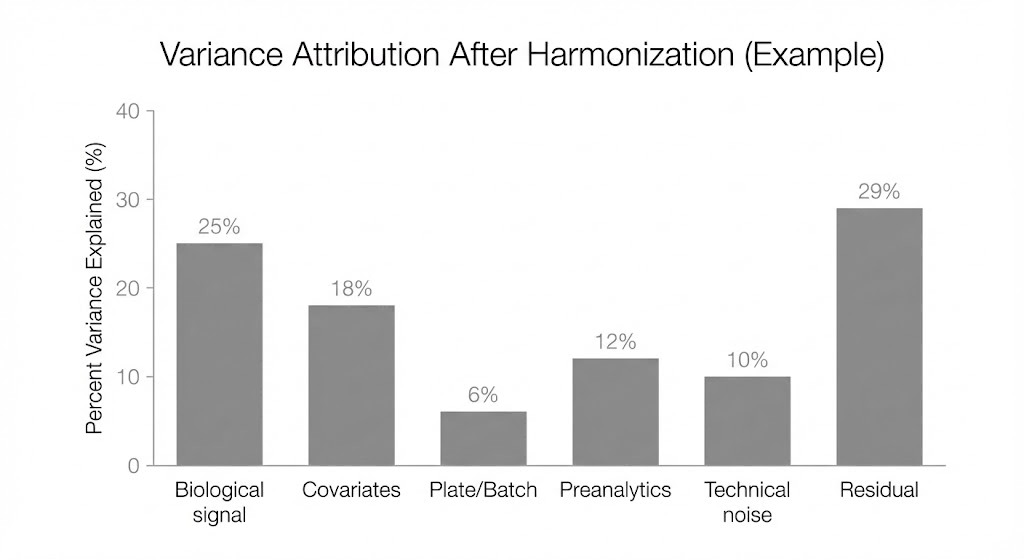 Example variance attribution view used to confirm that plate/batch effects are not the dominant driver after harmonization
Any outlier batch/plate triggers a documented investigation and corrective action path (re-centering, bridging adjustment, or re-run where warranted).
Audit-ready deliverables (what you get)
Bridging isn't real unless it is documented. By default, you receive:
- Plate maps (including bridge/control placement)
- Randomization artifacts (seed + script, or equivalent)
- A bridging/harmonization report with diagnostics, decisions, and corrective actions
If you need a canonical reference for how PEA works conceptually (useful for internal stakeholder alignment), see our PEA technology primer in the Knowledge Hub.
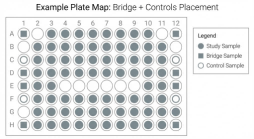
Example plate map schematic showing consistent placement of bridge samples and controls to support cross-plate harmonization and audit-ready QC.
QC Rigor You Can Audit: Pilot Rubric, Thresholds, and Actions
If you're choosing a provider for pilot → scale, the key question is: Do you have explicit QC gates, and do you show your work? We use a rubric that converts QC into a decision, not a debate.
Pilot QC rubric (decision-ready)
| Domain | Metric/Check | Pass threshold (pilot) | Typical action if fail |
| Platform performance | Intra-assay CV (Sample Control triplicates) | ≤20% | Investigate outlier assays; check near-LOD effects; consider assay-level exclusions or re-run |
| Platform performance | Inter-plate CV (Sample Control across plates; cohort duplicates) | ≤30% | Revisit normalization; confirm control-based centering; consider bridging; re-run suspect plate |
| Platform performance | Per-sample call rate | Median ≥70% assays above LOD | Review LOD basis; exclude poor-quality samples; assess preanalytics and internal controls |
| Preanalytics & harmonization | Internal/external control checks | All within expected ranges; no failed plates | Re-run failing plates; audit pipetting/reagents |
| Preanalytics & harmonization | Post-normalization plate separation | No systematic plate clustering in PCA/UMAP | Re-check centering/bridging; adjust normalization strategy |
| Biological signal | Sentinel pathway directionality and effect sizes | Plausible directionality; consistent with prior | Revisit cohort balance; increase n for weak strata; reassess pathway targets |
What "audit-ready QC" looks like in delivery
We don't just report "pass." We provide:
- CV distributions (by assay and control type)
- Call rate and missingness diagnostics (per sample and per plate)
- Plate stability views (control trending across plates; outlier flags)
- Explicit action logs (reruns, exclusions, normalization adjustments, rationale)
Suggested figures to insert:
- CV distribution plot (histogram or box plot)
- Call-rate distribution + missingness heatmap
- Plate-by-plate control stability trend (control metrics across plates)
Predictable Turnaround Without Guesswork: How We Plan 172 vs 600 Samples
Turnaround becomes unreliable when projects are treated as "one big run" and reruns, batching constraints, and checkpoints are ignored. Our approach is operational: we plan work as a controlled pipeline with transparent stages and milestone-based deliveries.
Our execution stages (what happens when)
- Sample intake & verification (volume, matrix, condition, metadata completeness)
- Scheduling & batching plan (plate maps, randomization, bridging design locked)
- Run execution (sequencing aligned to the platform strategy)
- NPX generation + QC gates (rubric-based checkpoint)
- Analysis & reporting (study-ready outputs, diagnostics, interpretation support)
- Final delivery package (data + reproducibility artifacts)
172 vs 600: what changes operationally
- 172 samples: fewer plates/batches, faster feedback loops, earlier pilot checkpoint
- 600 samples: more plates and runs, stronger need for bridging continuity, formal rerun buffers and contingency windows
Rather than over-promising a fixed day count that ignores real-world contingencies, we align on a delivery window plus milestone deliverables so your internal stakeholders see progress and risk early.
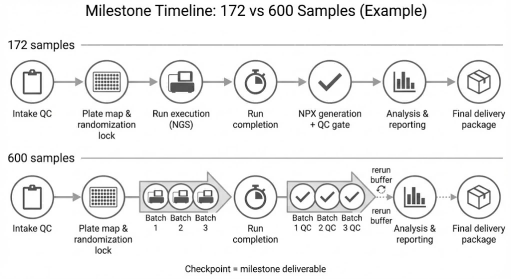 Milestone-based execution plan showing the same QC and delivery checkpoints for 172 vs 600 samples, with additional batching and rerun buffers incorporated for scale.
Deliverables by Default: What Creative Proteomics Hands Back to Your Team
A high-performing provider doesn't just "send NPX." They deliver a complete package your biostats and translational teams can use immediately—and audit later.
Default deliverables (what you get)
- Annotated NPX matrix (study-ready format)
- QC dashboards (CVs, call rates, missingness, control tracking, plate/batch diagnostics, PCA/UMAP)
- Bridging/harmonization documentation (plate maps, randomization artifacts, bridging report with decisions)
- Read-level QC summaries and sequencing run metrics (and assay count summaries where applicable)
- Metadata codebook / data dictionary (covariates, endpoints, batch fields, sample lineage)
- Export-ready tables for downstream modeling (model-ready formats aligned to your analysis plan)
- Reproducibility assets (version notes, parameters, and a signed decision memo when pilot gating is used)
If your stakeholders want transparency on what's covered on the HT panel, you can also reference the Explore HT protein list table as an internal planning aid.
Optional add-on tiers (choose what you need)
- Core QC + NPX delivery (for internal analysis teams)
- Statistical discovery module (differential protein analysis, covariate modeling, multiplicity control)
- Mechanistic / multi-omics module (pathway/network analysis, integration-ready deliverables)
Multi-Omics Integration: Turning HT Signals into Mechanism and Action
Explore HT becomes most valuable when NPX results translate into mechanism and decision support. Multi-omics is not a buzzword if the outputs are integration-ready and reproducible.
The questions multi-omics helps you answer
- Target prioritization: which proteins are plausible drivers versus correlated markers?
- MoA support: do pathways align with genetic, transcriptomic, or metabolic context?
- Patient stratification: which proteomic signatures define response subgroups?
- Companion biomarkers: which markers remain robust across batches and sample matrices?
How Creative Proteomics makes integration real
- Harmonized IDs and a metadata schema designed for joint modeling
- Batch-aware integration strategy (bridging diagnostics carried into multi-omics tables)
- Reproducible notebooks and model-ready exports for internal analytics
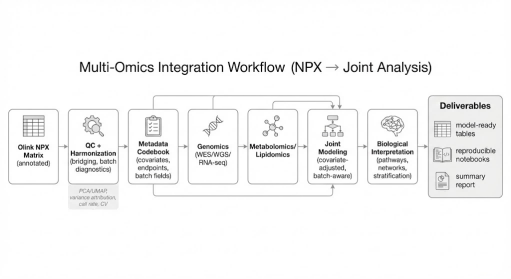 Workflow from annotated NPX through harmonization and metadata alignment to batch-aware joint modeling with genomics and metabolomics for mechanistic interpretation..
Typical integration pairings include Explore HT with WES/WGS/RNA-seq and Explore HT with metabolomics/lipidomics.
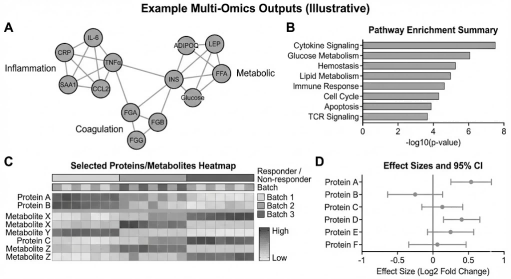 Illustrative multi-omics outputs commonly used to summarize mechanism and decision signals, including network modules, pathway enrichment, integrated heatmaps, and covariate-adjusted effect-size estimates.
Which Engagement Fits You? Pilot → Scale-Up Pathways with Creative Proteomics
You shouldn't have to guess the right path. We structure engagements around cohort size, sample constraints, and decision timelines—while keeping the plan scalable.
Path A: Large discovery cohorts (n > 5,000)
- Strategy: Explore HT at scale with formal bridging continuity across runs
- QC gates: residual batch structure checks + stable CV/call-rate distributions
- Milestones: pilot checkpoint → rolling batch deliveries → final harmonized release
Path B: Mid-size cohorts (n = 500–1,500)
- Strategy: Explore HT as the default for broad discovery; if biology is tightly hypothesis-led, we can advise on a modular panel strategy as part of study design
- QC gates: replicate-driven precision checks for key targets; strong plate randomization and bridging discipline
- Milestones: pilot + design lock → scale batches → integrated report
For teams comparing modular options, our overview of Explore 3072/384 panels (and the dedicated page for Explore 3072 panel combinations) can help align expectations on coverage strategy.
Path C: Pilot validation / iterative design
- Strategy: targeted designs emphasizing detectability and precision; rapid iteration before committing to full scale
- QC gates: sentinel proteins above LOD with acceptable CV; fast rerun cycles with documented actions
- Milestones: fast QC feedback → refine design → scale decision
A/B/C engagement paths for Olink Explore HT projects, organized by cohort size, operational strategy, QC gates, and deliverables.
| Path | Typical cohort size | Primary goal | Batch strategy | Bridging & replicates (recommended) | QC gates (pilot-ready examples) | Default deliverables | Best fit when… |
| A. Large discovery scale-up | n > 5,000 | Broad discovery with cohort-wide comparability | Rolling batches across multiple plates/runs; scheduled releases | Formal bridging continuity across runs; consistent bridge placement; control trending across plates; cohort duplicates where needed | Stable CV distributions within targets; no systematic plate clustering post-normalization; acceptable call-rate distribution; bridging diagnostics within acceptance band | Annotated NPX + QC dashboards + bridging report + randomization artifacts + run metrics/QC summaries + data dictionary + model-ready exports | You need population-scale discovery and harmonized results across time/batches |
| B. Mid-size cohort | n = 500–1,500 | Efficient discovery with controlled cost and time | Planned batches with defined milestones; optional focused design support | Bridging and randomization locked early; targeted replicate strategy for key endpoints; rerun buffer defined | Pilot QC gate before full scale; call-rate stability; plate/batch diagnostics clean; sentinel pathway sanity checks | Same default package; optional statistical discovery module | You have a defined timeline and want predictable execution with strong QC documentation |
| C. Pilot / iterative validation | n ≤ 500 (often 40–200 pilot) | De-risk feasibility, detectability, and variance | Small batches, fast feedback loops | Higher emphasis on replicates; bridge samples to test harmonization; designed to learn and refine | Priority proteins above LOD; precision acceptable for endpoints; no obvious plate-driven separation; clear go/no-go memo | Default package + signed decision memo; optional pathway/network outputs | You need quick learning cycles before committing budget and samples to scale |
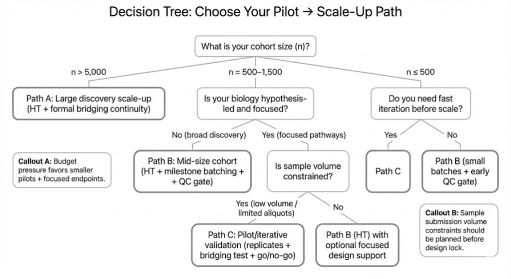 Decision tree to align cohort size, hypothesis strength, budget pressure, and sample volume constraints to the most efficient pilot-to-scale engagement path.
If your pilot is pathway-led, you can also review targeted options such as the Explore 384 Inflammation panel or the Explore 384 Cardiometabolic panel to see how domain-focused designs are typically structured.
Getting Started: What We Need From You (and What You'll Get Back)
A smooth project starts with clean intake and a documented design. We keep this lightweight, but specific enough to prevent rework.
What we need (intake checklist)
- Sample matrix (plasma/serum/CSF), tube type, and processing time window
- Available submission volume and aliquot plan
- Freeze–thaw history, storage conditions, and shipping constraints
- Cohort metadata: key covariates, endpoints, stratification variables
- Timeline: pilot decision date and scale-up milestones
Intake checklist for Olink Explore HT projects to minimize rework and improve cross-batch comparability.
| Category | What to provide | Why it matters for Olink Explore HT | Typical pitfalls to avoid |
| Sample matrix & collection | Plasma/serum/CSF; tube type; anticoagulant | Matrix affects detectability, background, and QC expectations | Mixing tube types without recording; inconsistent draw/processing SOP |
| Preanalytics window | Time-to-spin/time-to-freeze; processing temp | Major driver of call rate, missingness, and near-LOD stability | Variable delays across sites; undocumented deviations |
| Storage & freeze–thaw | Storage temperature; freeze–thaw count | Impacts degradation and low-abundance proteins | Multiple freeze–thaws; missing freeze–thaw metadata |
| Available volume & aliquots | Submission volume per sample; aliquot count/volume | Providers require submission volume above assay input; supports reruns | Not accounting for dead volume/QC repeats; uneven aliquot sizes |
| Shipping & chain-of-custody | Shipping temp (dry ice), schedule, tracking | Prevents preanalytical drift during transport | Thaw events; long transit time; poor packaging |
| Cohort metadata & covariates | Age/sex/BMI; meds; site; collection batch; key endpoints | Enables adjusted models and interpretable stratification | Missing covariates; inconsistent coding; no batch fields |
| Study design intent | Pilot vs scale; target effect sizes; groups/strata | Determines replicate needs, bridging plan, and power | Underpowered strata; late changes to grouping |
| Compliance & governance | Data format needs; access rules; RUO statement | Aligns delivery, reproducibility assets, and internal review | Vague deliverables; no data dictionary expectations |
What you get back (planning deliverables)
- Recommended design: replicates + bridging plan + randomization approach
- QC plan mapped to your endpoints (thresholds + failure actions)
- Deliverables preview (QC dashboard layout + file list)
- Project plan with batching logic and milestone delivery
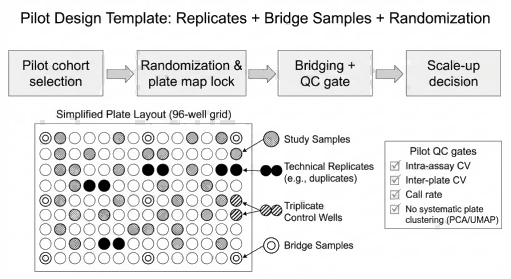 Pilot design template illustrating how replicates, bridge samples, and locked randomization support QC gating and confident scale-up decisions in Olink Explore HT studies.
FAQ: High-Intent Questions From Biopharma Teams
How do you prove cross-batch comparability—what will I see?
Answer: We treat comparability as a measured outcome with acceptance criteria.
How we do it: bridging samples + disciplined plate design + control-based centering/normalization with residual batch diagnostics.
What you receive: bridge correlation distributions (per batch and overall), PCA/UMAP before/after, variance attribution views, and a harmonization report with decisions.
What's your approach for 172 vs 600 samples, and how do you de-risk delays?
Answer: We plan around stages and buffers—not optimistic single-run assumptions.
How we do it: locked plate maps, batch scheduling, rerun triggers, and milestone deliveries.
What you receive: a timeline with checkpoints, defined rerun triggers, and an SLA-ready definition of "on-time delivery."
Can you integrate Explore HT with genomics/metabolomics for multi-omics insights?
Answer: Yes—when the study is instrumented for integration from the start.
How we do it: harmonized IDs, covariate schema, batch-aware exports, and reproducible notebooks.
What you receive: a metadata codebook, model-ready tables, and integration-ready outputs aligned to your internal analytics.
What's included in your deliverables by default?
Answer: NPX is only the beginning.
How we do it: standardized QC dashboarding + bridging documentation + reproducibility artifacts.
What you receive: annotated NPX, QC dashboards, bridging report, plate maps, randomization artifacts, run metrics/QC summaries, and export-ready tables (plus optional downstream analytics modules).
How flexible are your SOPs for constrained preanalytics and low-volume samples?
Answer: We adapt within controlled boundaries and document trade-offs.
How we do it: intake verification, risk-based QC thresholds, and pilot-first validation for near-LOD endpoints.
What you receive: a documented plan outlining feasibility, risk, and mitigation actions—before you commit the full cohort.
If you're doing targeted cytokine-heavy validation, you may also want to compare against a focused option such as the Olink Target 48 Cytokine Panel during study planning.
(We can provide sample dashboard layouts and QC template examples on request.)
Disclosure / RUO Statement
Creative Proteomics is a biotechnology service provider offering Olink panel data analysis and interpretation services for research use only (RUO). Upon request, we can support a neutral pilot review and share practical QC calculator templates used to compute CVs, call-rate metrics, and harmonization diagnostics. We emphasize reproducibility through documented plate maps, randomization artifacts, versioned parameters, and audit-ready reporting. Services are provided for research use only and are not intended for diagnostic procedures.
Next step
If you're planning an Explore HT pilot with scale-up intent—or you're already seeing plate/batch drift—send us your cohort size, sample matrix, available submission volume, endpoints, and timeline. We will return a study plan + bridging/QC design + deliverables preview aligned to your decision milestones. For an overview of service scope and execution options, see our Olink proteomics services page.